

Abstract

The role of insulin-like growth factor-1 receptor (IGF-1R) in cancer tumorigenesis was established decades ago, yet there are limited studies evaluating the imaging and therapeutic properties of anti-IGF-1R antibodies. Noninvasive imaging of IGF-1R may allow for optimized patient stratification and monitoring of therapeutic response in patients. Herein, this study reports the development of a Zirconium-89 (89Zr)-labeled anti-IGF-1R antibody (89Zr-Df-1A2G11) for PET imaging of pancreatic cancer. Successful chelation and radiolabeling of the antibody resulted in a highly stable construct that could be used for imaging IGF-1R expressing tumors in vivo. Western blot and flow cytometry studies showed that MIA PaCa-2, BxPC-3, and AsPC-1 pancreatic cancer cell lines expressed high, moderate, and low levels of IGF-1R, respectively. These three pancreatic cancer cell lines were subcutaneously implanted into mice. By employing the PET imaging technique, the tumor accumulation of 89Zr-Df-1A2G11 was found to be dependent on the level of IGF-1R expression. Tumor accumulation of 89Zr-Df-1A2G11 was 8.24 ± 0.51, 5.80 ± 0.54, and 4.30 ± 0.42 percentage of the injected dose (%ID/g) in MIA PaCa-2, BxPC-3, and AsPC-1-derived tumor models at 120 h postinjection, respectively (n = 4). Biodistribution studies and ex vivo immunohistochemistry confirmed these findings. In addition, 89Zr-labeled nonspecific human IgG (89Zr-Df-IgG) displayed minimal uptake in IGF-1R positive MIA PaCa-2 tumor xenografts (3.63 ± 0.95%ID/g at 120 h postinjection; n = 4), demonstrating that 89Zr-Df-1A2G11 accumulation was highly specific. This study provides initial evidence that our 89Zr-labeled IGF-1R-targeted antibody may be employed for imaging a wide range of malignancies. Antibodies may be tracked in vivo for several days to weeks with 89Zr, which may enhance image contrast due to decreased background signal. In addition, the principles outlined in this study can be employed for identifying patients that may benefit from anti-IGF-1R therapy.
Keywords: Positron emission tomography (PET), Zirconium-89 (89Zr), Insulin-like growth factor-1 receptor (IGF-1R), Molecular imaging
Introduction
Insulin-like growth factor 1 receptor (IGF-1R) is a transmembrane receptor of the tyrosine kinase class involved in cell growth, apoptosis, and tumor invasion in cancer.1 Although it is expressed at low levels in normal tissue, IGF-1R is upregulated in most cancers, including malignancies of the breast, lung, prostate, and pancreas.2 Upregulation of IGF-1R is critical for malignant transformation and has been linked to increased lethality in patients, whereas decreased IGF-1R expression levels correlated with diminished tumor growth and improved survival.3 Several therapeutic strategies have been developed to block the cancerous activity of IGF-1R, including receptor-targeted antibodies and tyrosine kinase inhibitors.4 Although many of these anti-IGF-1R therapies are in clinical trials, their efficacy has yet to be established.5,6 Currently, immunohistochemistry is the primary method for assessing IGF-1R expression in human tumors; however, this is an invasive procedure limited by the heterogeneous expression of IGF-1R found in many solid tumors.7 For addressing this concern, several researchers have turned to molecular imaging for noninvasively assessing IGF-1R expression in several cancer models.8
Pancreatic cancer remains the most lethal form of cancer worldwide despite significant advancements in the treatment of other malignancies.9 The dismal outcomes associated with pancreatic cancer have been linked to several factors, including the late onset of clinical symptoms in patients, inefficient screening modalities for detecting precancerous lesions, and ineffective treatment options.10 In addition, more than 80 percent of patients are found to have locally advanced or metastatic disease when first diagnosed; thus, patients have limited treatment options.11 In 2015, the five-year mortality rate for patients with pancreatic cancer was 93% in the United States.9 Much research has been devoted to the development of novel agents for detecting early pancreatic cancers, especially in high-risk patients. While scientists strive to discover new medicinal and imaging agents, the harsh microenvironment of pancreatic tumors effectively limits the delivery and accumulation of most compounds. It is thought that IGF-1R may serve as an effective diagnostic biomarker in pancreatic cancer, as it is overexpressed in most pancreatic cancers and associated with higher tumor grade and poor survival.33 Thus, IGF-1R could be used for imaging of IGF-1R-expressing tumors, monitoring of therapeutic response, enhancing prognostic stratification, and identifying individuals or groups more likely to respond to novel anti-IGF-1R therapies.
Targeting IGF-1R with monoclonal antibodies for molecular imaging has several advantages, including the high specificity and affinity exhibited by antibodies for the target protein. Also, IGF-1R antibodies are much larger than insulin-like growth factor-1 (IGF-1) analogues and thus provide more sites for bioconjugation. Currently, several anti-IGF-1R antibodies are in preclinical development, and a few are in clinical investigations.12−15 For example, R1507, a fully humanized recombinant anti-IGF-1R monoclonal antibody, has been evaluated in many clinical trials.14,16,17 R1507 was successfully labeled with 111In and 89Zr for SPECT and PET imaging, respectively, and assessed for their imaging efficiencies in a triple-negative breast cancer model.18 However, the investigators noted that clinical translation of R1507 may be hindered by nonspecific uptake in other organs and tissues in patients. Another humanized anti-IGF-1R antibody, AVE-1642, was studied in an orthotopic human breast cancer MCF-7 model.19 Near-infrared (NIR) imaging of the antibody conjugated to QD705 or Alexa680 was performed to detect receptor expression and downregulation of IGF-1R in vivo. Tumor uptake of Alexa680-labeled AVE-1642 was mostly attributed to active targeting, whereas tumor accumulation of the QD conjugate was mainly due to the enhanced permeability and retention (EPR) effect resulting from its relatively large size. Because IGF-1R is expressed predominantly on tumor cells instead of on tumor vasculature, the majority of QD705-labeled AVE-1642 or any nanomaterial-based immunotargeting could not efficiently extravasate to reach the targeted receptor on tumor cells.
ImmunoPET imaging is a noninvasive strategy that utilizes the enhanced specificity of antibodies for molecular imaging of solid malignancies. Recently, the 64Cu-labeled IGF-1R monoclonal antibody (called 1A2G11) was successfully developed for in vivo PET imaging of prostate cancer.20 It was shown that 64Cu-NOTA-1A2G11 accumulated in IGF-1R tumors with high specificity, yet 64Cu limited their imaging capabilities.20 Employment of long-lived isotopes (e.g., 89Zr) may provide further insight into the long-term behavior of antibodies in vivo as antibodies may circulate for up to 45 days. In this study, we evaluated 89Zr-labeled 1A2G11 for PET imaging of IGF-1R in three pancreatic cancer cell line-derived tumor models. This was accomplished by mapping the biodistribution and determining the tumor targeting efficiency of the tracer. We hypothesized that 89Zr-Df-1A2G11 accumulation would be dependent upon IGF-1R expression levels and vascularity of the tumor model.
Experimental Section
Production of Anti-IGF-1R Antibody
The production of 1A2G11, a monoclonal antibody targeting IGF-1R, was performed by NeoClone Biotechnologies International, LLC (Madison, WI, USA) and described previously.20 Briefly, several immunogens were screened for reactivity using bioinformatics techniques before the recombinant mouse protein was inoculated into Balb/c female mice. IGF-1R positive cell candidates were screened for monoclonal colonies before the most promising candidate (1A2G11) was bulk produced for further experiments.
Cell Culture
Human pancreatic adenocarcinoma cell lines (MIA PaCa-2, BxPC-3, and AsPC-1) were obtained from the American Type Culture Collection (ATCC, Manassas, VA, USA). AsPC-1 and BxPC-3 cells were grown in Roswell Park Memorial Institute (RPMI)-1640 medium with high glucose supplemented with 10% FBS (Hyclone, GE Healthcare Life Sciences, Little Chalfont, UK) at 37 °C in a humidified incubator with 5% CO2. MIA PaCa-2 cells were grown in Dulbecco’s modified Eagle’s medium (DMEM) supplemented with 10% FBS and 2.5% donor horse serum (GemCell, Gemini Bio-Products, West Sacramento, CA, USA). Cells were utilized for in vitro and in vivo experiments once they reached 60–70% confluency.
Determination of Cell Binding by Flow Cytometry
The binding affinity of 1A2G11 was evaluated by flow cytometry studies using MIA PaCa-2, BxPC-3, and AsPc-1 cell lines. Cells were harvested at 70% confluency and suspended in cold phosphate buffered saline (PBS) with 3% bovine serum albumin (BSA) at a concentration of 1 × 10⁶ cells/mL. The cells were incubated with 200 μL of Alexa Fluor 488-labeled 1A2G11 (0.5 μg/mL) on ice for 30 min. Next, the cells were washed 3 times with cold PBS resuspended in 200 μL of ice-cold PBS containing 3% BSA. The binding efficiency was analyzed using a MACSQuant cytometer (Miltenyi Biotech, Bergisch Gladbach, Germany), and mean fluorescence intensities were processed using FlowJo analysis software (Tree Star, Inc., Ashland, OR, USA).
Determination of IGF-1R Expression by Western Blot
IGF-1R expression was determined by Western blotting using standard techniques. Once the pancreatic cancer cell lines had grown to 70% confluency, the cells were washed with ice-cold PBS. Next, the cells were lysed using radioimmunoprecipitation assay (RIPA) buffer (Boston BioProducts, Ashland, MA, USA) supplemented with 1:100 protease inhibitor cocktail (Halt Inhibitor Cocktail, Thermo Fisher Scientific, Carlsbad, CA, USA) for 15 min at 4 °C. Cells were scraped, and the lysis solution was centrifuged at 13,000g for 10 min at 4 °C. The supernatant was removed, and protein concentration was measured using the Pierce Coomassie (Bradford) Protein Assay Kit (Thermo Fisher Scientific, Carlsbad, CA, USA). Next, 20 μg of total protein was loaded into the corresponding wells of a 4–12% Bolt Bis-Tris Plus gel (Thermo Fisher Scientific, Carlsbad, CA, USA) alongside the Chameleon Duo ladder (LI-COR Biosciences, Lincoln, NE, USA). Following electrophoresis at 120 mV for 45 min at 4 °C, proteins were transferred to a nitrocellulose membrane using the iBlot 2 system (ThermoFisher Scientific, Carlsbad, CA, USA). The membrane was blocked with Odyssey Blocking Buffer (PBS) (LI-COR Biosciences, Lincoln, NE, USA) for 12 h at 4 °C. The membrane was placed in the iBind Western Device (Thermo Fisher Scientific, Carlsbad, CA, USA), and the primary and secondary antibody solutions and washes were put in the corresponding chambers. Dilutions of 1:300 and 1:200 of the rabbit-derived polyclonal anti-IGF-1R antibody (Santa Cruz, Dallas, TX, USA), A12G11 antibody, and mouse β-actin (LI-COR Biosciences, Lincoln, NE, USA) were made with the iBind Fluorescent Detection Solution Kit (Thermo Fisher Scientific, Carlsbad, CA, USA) according to the manufacturer’s protocol. Similarly, the secondary antibodies (donkey anti-mouse IRDye 680RD and donkey anti-human 800CW) were diluted at 1:1500 and placed in the corresponding chambers. The membranes were left in the iBind system for 6 h before the membranes were removed for scanning using the LI-COR Odyssey Infrared Imaging System (LI-COR Biosciences, Lincoln, NE, USA).
Human Pancreatic Adenocarcinoma Xenograft Mouse Model
All animal studies were conducted under an IACUC protocol approved by the University of Wisconsin Institutional Animal Care and Use Committee. For implantation, 5 × 10⁶ tumor cells, in a mixture of 1:1 phosphate-buffered saline (PBS) and Matrigel (BD Biosciences, San Jose, CA, USA), were subcutaneously injected into 4-5 week old female athymic nude mice (Envigo, Cambridgeshire, United Kingdom). Tumor diameter was monitored weekly, and mice with tumors between 5 and 9 mm were utilized for in vivo studies.
89Zr-Oxalate Production
Production of 89Zr-oxalate was carried out as previously described.21 Briefly, 89Zr was produced in a biomedical cyclotron (GE PETtrace) via irradiation of natural yttrium foil (250 μm, 99.9%) with 16.4 MeV protons. Next, 2 h irradiations of the target with a 5 mA current yielded 280–320 MBq of 89Zr on the yttrium target. The foil was dissolved in concentrated HCl (Ultrex grade, Mallinckrodt, Dublin 15, Ireland) and loaded into a hydroxamate-functionalized resin, washed with 6 N HCl, and eluted in 1 M oxalic acid.
Chelation and 89Zr Labeling of IGF-1R Antibody
The anti-IGF-1R antibody 1A2G11 (NeoClone, Madison, WI, USA) was conjugated to the chelator p-isothiocyanatobenzyl-desferrioxamine (Df-Bz-NCS; Macrocyclics, Inc., Dallas, TX, USA) using procedures previously reported.22,23 Briefly, ∼3 mg of 1A2G11 in PBS was mixed with Df-Bz-NCS at a molar ratio of 1:3 after the antibody solution was adjusted to pH 8.5–9.0 with 0.1 M Na2CO3. The solution was allowed to react for 2 h at 37 °C. Next, the sample was purified by size exclusion chromatography using PD-10 columns.
For radiolabeling, ∼3 mCi of 89Zr-oxalate was buffered with 0.5 M HEPES solution (pH 7.0) and added to a solution of Df-1A2G11. The radioactive solution was incubated for 1 h at 37 °C with constant shaking. Next, 89Zr-Df-1A2G11 was purified using PD-10 columns with PBS being used as the mobile phase. The radioactive fractions containing 89Zr-Df-1A2G11 were collected and passed through a 0.2 μm syringe filter for in vivo experiments. The same procedure described for 89Zr-Df-1A2G11 was used to produce the 89Zr-labeled nonspecific human IgG (Sigma-Aldrich, St. Louis, MO, USA).
PET Imaging and Biodistribution
For PET imaging, tumor-bearing mice were injected intravenously with ∼200 μCi of 89Zr-Df-1A2G11. PET scans were performed using an Inveon microPET/microCT rodent model scanner (Siemens Medical Solutions USA, Inc.). Mice were subjected to 5–15 min of static PET scans at 12, 24, 48, 72, and 120 h postinjection. List mode scans of 40 million coincidence events were acquired for each mouse. The images were reconstructed using a maximum a posteriori (MAP) algorithm with no attenuation or scatter correction. PET images were reconstructed using a three-dimensional ordered subset expectation maximization (OSEM3D) algorithm. Quantification of PET images was accomplished in an Inveon Research Workplace (Siemens Medical Solution) workstation via region of interest (ROI) analysis with tissue uptake being reported as percentage injected dose per gram of tissue (%ID/g).
Biodistribution studies were carried out to validate the PET data. Immediately after the last imaging time point (120 h postinjection), mice were euthanized. The major organs, tissues, and tumors were collected and weighed before the activity was counted with a WIZARD2 automatic gamma counter (PerkinElmer, Waltham, Massachusetts, USA). The uptake was expressed as %ID/g (mean ± SD).
Fluorescence Immunohistochemistry Using Confocal Microscopy
During biodistribution, tumor samples were collected for histological studies. Frozen tissue slices of 5 μm thickness were fixed with cold acetone for 10 min and air-dried at 20–25 °C for 30 min. After rinsing with PBS and blocking with 10% donkey serum for 30 min at 20–25 °C, the slices were incubated with a commercial IGF-1R antibody (5 μg/mL) or 1A2G11 (5 μg/mL) for 12 h at 4 °C and visualized using the FITC-labeled rabbit anti-mouse secondary antibody. The slides containing tumor sections were also stained for the endothelial marker known as CD31. After washing with PBS, the slides were incubated with rat anti-mouse CD31 antibody (2 μg/mL) for 1 h, followed by Cy3-labeled donkey anti-rat IgG for 30 min at 20–25 °C. All images were taken with a Nikon A1R + Confocal Microscope (Nikon, Inc., Melville, NY, USA), and images were analyzed using the NIS-Elements Ar with Deconvolution software package.
Statistical Analysis
Quantitative data were expressed as mean ± standard deviation (SD). Statistical analyses were performed using a Student t-test or one-way analysis of variance (ANOVA). A confidence interval of 95% was selected with p < 0.05 considered statistically significant.
Results
Cell Binding Affinity of 1A2G11
The binding efficiency of 1A2G11 with cellular IGF-1R was evaluated through flow cytometry studies. Alexa Fluor 488-labeled 1A2G11 was incubated with each cell line for 30 min to promote cell binding. A substantial shift along the x-axis signified increased Alexa Fluor 488 signal and enhanced binding of 1A2G11 to IGF-1R while minimal binding resulted in a small shift and lower signal intensity. When incubated with Alexa Fluor 488-labeled 1A2G11, MIA PaCa-2 cells displayed a strong shift in fluorescence signal (Figure 1). A similar shift was found with BxPC-3 cells, suggesting that Alexa Fluor 488-labeled 1A2G11 displayed high binding to both MIA PaCa-2 and BxPC-3 cells. As shown in Figure 1, BxPC-3 cells exhibited a shift less than that of MIA PaCa-2, suggesting that MIA PaCa-2 may express higher levels of IGF-1R. The AsPC-1 cell line showed minimal fluorescence signal and binding, suggesting that AsPC-1 cells express low levels of IGF-1R. There were no observed differences between the binding of 1A2G11 and Df-1A2G11, suggesting that the presence of the chelator did not alter the binding affinity of the antibody.
Figure 1.

Flow cytometry studies of IGF-1R antibody binding in MIA PaCa-2, BxPC-3, and AsPC-1 cells. Flow cytometry revealed that MIA PaCa-2 cells displayed the highest binding to Alexa Fluor 488-1A2G11 and the chelated form, Alexa Fluor 488-Df-1A2G11. Similarly, BxPC-3 cells were also found to effectively bind both Alexa Fluor 488-1A2G11 and Alexa Fluor 488-Df-1A2G11. AsPC-1 cells, known to express low levels of IGF-1R, displayed low binding to both Alexa Fluor 488-1A2G11 and Alexa Fluor 488-Df-1A2G11.
IGF-1R Expression in Pancreatic Cancer Cell Lines
Western blot studies were employed to determine the relative levels of IGF-1R in each pancreatic cancer cell line. For comparison and confirmation, two distinct anti-IGF-1R antibodies were utilized (Figure 2). First, a Western blot was performed with a rabbit-derived polyclonal IGF-1R antibody (Figure 2A). MIA PaCa-2 cells displayed the band with the strongest intensity at 110 kDa, suggesting the highest expression of MIA PaCa-2. Also, BxPC-3 cells showed a strong band at ∼110 kDa; however, AsPC-1 cells showed a weak band signifying lower levels of IGF-1R expression. When normalized to β-actin, MIA PaCa-2 remained the highest at 1.0, followed by BxPC-3 at 0.8 and AsPC-1 at 0.54. These results were confirmed by a second Western blot that utilized the antibody of interest, 1A2G11 (Figure 2B). Similarly, MIA PaCa-2 and BxPC-3 cells showed higher levels of IGF-1R expression, as signified by intense bands at 110 kDa, whereas AsPC-1 cells displayed the band with the lowest signal at the same molecular weight. When normalized to β-actin, MIA PaCa-2 and BxPC-3 revealed similar ratio values of 1.0 and 0.92, respectively, whereas AsPC-1 was lowest at 0.34.
Figure 2.

Evaluation of IGF-1R expression in MIA PaCa-2, BxPC-3, and AsPC-1 pancreatic cancer cell lines by Western blot analysis. Western blotting was performed using (A) a polyclonal rabbit anti-IGF1R antibody and (B) the antibody of interest 1A2G11. Both Western blots showed similar results, as IGF-1R was determined to be expressed in both MIA PaCa-2 and BxPC-3 cells whereas AsPC-1 cells displayed low expression.
PET Imaging of 89Zr-Df-1A2G11
Serial PET imaging was performed at 12, 24, 48, 72, and 120 h after 89Zr-Df-1A2G11 was injected into MIA PaCa-2, BxPC-3, and AsPC-1 tumor-bearing mice. Representative maximum intensity projections (MIPs) have been provided for each time point (Figure 3). The coronary artery (A), heart (H), liver (L), spleen (S), and tumor (T) are denoted by arrows. The quantitative data obtained from the region-of-interest analysis are shown in Figure 4 with the numerical values provided in Tables S1–S3. The highest accumulation of 89Zr-Df-1A2G11 was found in the MIA PaCa-2-derived tumor model at 12 h postinjection (7.28 ± 1.36%ID/g, n = 4). In addition, this tumor model maintained the highest accumulation throughout the entire study with 7.90 ± 0.88, 8.22 ± 1.09, 8.10 ± 0.76, and 8.24 ± 0.51%ID/g at 24, 48, 72, and 120 h postinjection, respectively (n = 4). Tumor accumulation of 89Zr-Df-1A2G11 in the BxPC-3-derived tumor model initially displayed an accumulation of 5.27 ± 0.17%ID/g at 12 h postinjection with minimal changes in tumor uptake through 120 h postinjection (5.80 ± 0.54%ID/g; n = 4). For the AsPC-1 tumor model, tumor uptake gradually increased from 12 to 120 h postinjection with activity values of 2.77 ± 0.12, 3.67 ± 0.53, 3.93 ± 0.61, 4.03 ± 0.60, and 4.30 ± 0.42%ID/g at 12, 24, 48, 72, and 120 h postinjection (n = 4), respectively.
Figure 3.

PET imaging of IGF-1R expression in three pancreatic cancer tumor-bearing mice. Maximum intensity projection images (MIPs) were acquired at 12, 24, 48, 72, and 120 h after receiving an intravenous injection of 89Zr-Df-1A2G11. MIA PaCa-2 tumors showed the highest accumulation followed by BxPC-3. The lowest tumor accumulation was found in AsPC-1 tumors. Arrows demark those tissues with high tracer accumulation, including the carotid artery (A), heart (H), liver (L), spleen (S), and tumor (T).
Figure 4.

Temporal quantitative analysis of PET data. Time–activity curves of 89Zr-Df-1A2G11 in the (A) tumor, (B) blood, (C) liver, and (D) spleen of MIA PaCa-2, BxPC-3, and AsPC-1-derived tumor models (n = 4). Statistically significant differences (one-way ANOVA, p < 0.05) were determined between MIA PaCa-2 and AsPC-1 (§), MIA PaCa-2 and BxPC-3 (‡), and BxPC-3 and AsPC-1-derived tumors (Φ).
Measurements of activity from the blood, liver, and spleen were also determined from PET imaging. Activity in the blood pool was similar for each model, which was shown to steadily decrease from the initial to final time point (Figure 4B). In addition, the liver showed similar activity levels and trends with 9.46 ± 1.37, 10.7 ± 0.38, and 10.1 ± 0.62%ID/g in MIA PaCa-2, BxPC-3, and AsPC-1-derived tumor models at 120 h postinjection (n = 4), respectively (Figure 4C). Also, activity in the spleen was shown to remain constant throughout the study (Figure 4D). Accumulation of the tracer in the muscle was negligible compared to the uptake of target organs and those organs involved in the excretion of 89Zr-Df-1A2G11 (Tables S1–S3).
For ensuring that binding of 1A2G11 was specific, a nonspecific human IgG (89Zr-Df-IgGnonspecific) was radiolabeled with 89Zr for PET imaging of the MIA PaCa-2-derived subcutaneous tumor model (Figure 5A). As shown in Table S4, the nonspecific antibody displayed low tumor accumulation with values ranging from 3.48 ± 0.65 to 3.63 ± 0.95%ID/g from 12 to 120 h postinjection of 89Zr-Df-IgGnonspecific (n = 4), respectively. In addition, the activity in the blood pool (6.13 ± 0.63%ID/g) was similar to that of 89Zr-Df-1A2G11 in MIA PaCa-2 (7.56 ± 1.04%ID/g), BxPC-3 (6.77 ± 0.17%ID/g), and AsPC-1 (8.03 ± 0.81%ID/g) models at 120 h postinjection (n = 4; Figure 5B and Tables S1–3), confirming the high stability, yet low specificity, of 89Zr-Df-IgGnonspecific for in vivo targeting of IGF-1R-expressing tumors.
Figure 5.

PET imaging of 89Zr-Df-IgGnonspecific as a control in MIA PaCa-2-tumor bearing mice. (A) Comparison of tumor uptake between 89Zr-Df-1A2G11 (n = 4) and the nonspecific antibody (89Zr-Df-IgG; n = 4) in the MIA PaCa-2-derived tumor model. A statistically significant difference in tumor accumulation was found between 89Zr-Df-1A2G11 and 89Zr-Df-IgG at each time point (student’s t test, **p < 0.01). Arrows demark those tissues with high tracer accumulation, including the carotid artery (A), heart (H), liver (L), spleen (S), and tumor (T). (B) PET imaging of 89Zr-Df-IgG, a nonspecific monoclonal antibody, in MiaPaCa-2-derived tumor-bearing mice at 12, 24, 48, 72, and 120 h postinjection (n = 4).
Biodistribution of 89Zr-Df-1A2G11
After mice had been imaged at the last time point at 120 postinjection, biodistribution was performed to confirm the PET ROI data. The biodistribution of 89Zr-Df-1A2G11 was compared between the xenograft-bearing mice (Figure 6 and Table S5). For biodistribution studies, major organs, tissues, and tumors were removed from euthanized mice, and the activity was measured by a gamma counter. The accumulation of 89Zr-Df-1A2G11 was highest in the blood pool (8.5 ± 0.9, 8.6 ± 1.3, and 6.3 ± 0.5%ID/g) and liver (8.0 ± 0.4, 10.1 ± 1.6, and 8.0 ± 2.0%ID/g; n = 4) for MIA PaCa-2, BxPC-3, and AsPC-1-derived tumor-bearing mice, respectively. Uptake of the tracer in tumors expressing moderate to high levels of IGF-1R was higher than uptake in the AsPC-1-derived tumor model that expressed low levels of IGF-1R. MIA PaCa-2, BxPC-3, and AsPC-1-derived tumors displayed a significant difference in uptake with activity values of 7.9 ± 0.9, 4.4 ± 1.0, and 2.0 ± 0.3%ID/g at 120 h postinjection (p < 0.05; n = 4), respectively. Several organs and tissues were found to have low uptake of 89Zr-Df-1A2G11, including muscle, pancreas, stomach, intestine, and brain, with values less than 1.0%ID/g.
Figure 6.
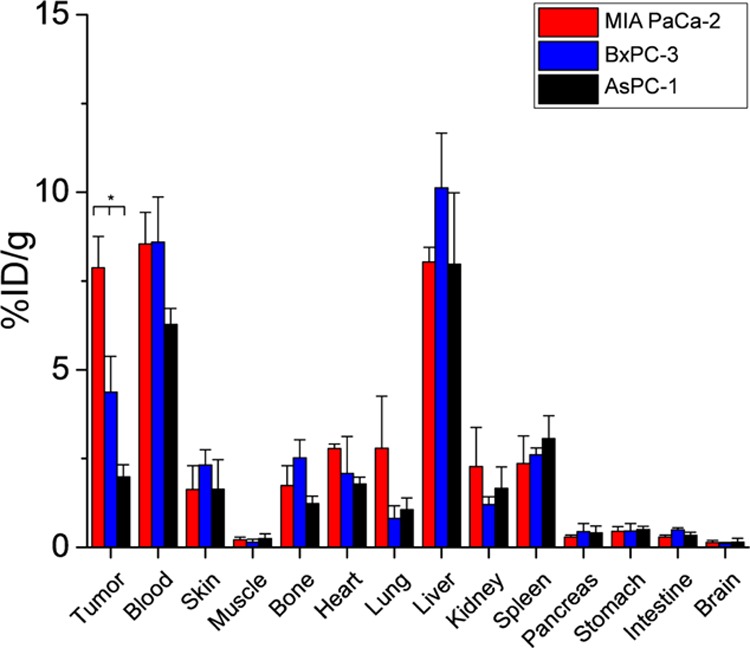
Biodistribution of 89Zr-Df-1A2G11 in MIA PaCa-2, BxPC-3, and AsPC-1-derived tumor-bearing mice at 120 h postinjection (n = 4; one-way ANOVA,*p < 0.05).
The biodistribution of 89Zr-Df-IgGnonspecific in MIA PaCa-2-derived tumor-bearing mice was assessed to validate PET findings (Figure S1 and Table S6). Tumor uptake of 89Zr-Df-IgGnonspecific was found to be 3.01 ± 1.65%ID/g at 120 h postinjection, which is similar to the results from PET analysis. Analogous to the biodistribution results of 89Zr-Df-1A2G11, the liver and spleen displayed the highest accumulation of 14.39 ± 5.21 and 11.09 ± 3.96%ID/g, respectively (n = 4). Lastly, the blood pool was found to contain 7.27 ± 1.07%ID/g at 120 h postinjection (n = 4). Overall, the values obtained from ex vivo biodistribution accurately reflected the in vivo biodistribution of 89Zr-Df-1A2G11 and further corroborated the PET findings.
Histology
Ex vivo immunohistochemistry was performed using 1A2G11/CD31 costaining with fluorescently tagged antibodies (Figure 7). For visualizing the presence of IGF-1R in tissue sections, 1A2G11 and fluorescently labeled secondary antibody were used sequentially. In addition, platelet endothelial cell adhesion molecule-1 (PECAM-1), also known as CD31, was used to determine the spatial location of the vasculature. Lastly, DAPI was used as a counterstain for visualization of cell nuclei. MIA PaCa-2 showed the highest IGF-1R expression (green) followed by BxPC-3. As expected, minimal fluorescent signal was found in AsPC-1 tumor sections. Also, CD31 signal was displayed in each tumor section (red). Lastly, the counterstain DAPI acted as a control and confirmed the presence of cells in the tissue sections (blue). As shown in the merged images, immunohistochemistry further confirmed that IGF-1R expression was predominantly on MIA PaCa-2 and BxPC-3-derived tumors, as previously suggested by flow cytometry and Western blot studies. Similar findings were seen using a commercially available anti-IGF-1R antibody (Figure S2).
Figure 7.

Immunofluorescence staining of IGF-1R and CD31 in MIA PaCa-2, BxPC-3, and AsPC-1-derived tumor sections. Tissue sections were incubated with 1A2G11, followed by FITC-labeled rabbit antimouse secondary antibody (green). The endothelial marker CD31 was visualized with a rat anti-mouse CD31 antibody, followed by Cy3-labeled donkey anti-rat IgG (red). The counterstain 4′,6-diamidino-2-phenylindole (DAPI) was used for visualization of cell nuclei (blue).
Discussion
Overexpression of IGF-1R in pancreatic cancer and most other malignancies makes this target well-suited for molecular imaging purposes. As IGF-1R overexpression has been linked to several adverse outcomes in most cancers, development of novel therapeutic and imaging strategies for detecting IGF-1R-expressing malignancies is critical. Currently, there are several therapeutic antibodies, peptides, and other small molecules in development for the treatment of IGF-1R-expressing malignancies with many constructs in clinical trials.24 As novel therapeutic strategies targeting IGF-1R become clinically available, physicians will need to determine which patients may benefit from IGF-1R therapeutic intervention. Although generally accomplished through invasive biopsies, molecular imaging allows for the noninvasive assessment of IGF-1R expression in tumors using antibody-based imaging agents. In turn, this allows for both patient stratification and the monitoring of therapeutic response.
In this study, 89Zr was employed for its long half-life (78.41 h), which more closely matches the pharmacokinetic properties of antibodies circulating in the bloodstream.25,26 By using this isotope, it is possible to monitor the biodistribution of an antibody-based tracer for several days. Accumulation of 89Zr-Df-1A2G11 was found to be rapid and specific with high accumulation in IGF-1R-expressing tumors only 12 h after injection and minimal uptake in IGF-1R-nonexpressing tumors. Furthermore, the use of a nonspecific antibody confirmed that accumulation was specific and not attributed to other factors, such as the isotope or chelator. Activity in the blood pool and liver gradually decreased in each model from 12 to 120 h postinjection of 89Zr-Df-1A2G11, resulting in decreased background noise and allowing for better delineation of the tumor. This decline in background noise would not have been as prominent with the use of short half-life isotopes like 64Cu (12.70) or 44Sc (3.97 h).27,28
Although 89Zr may hold greater potential for clinical translation, this isotope is currently limited by two factors: First, 89Zr has a strong affinity for phosphate and may accumulate in bones.29 In this study, the accumulation of activity was not quantified in the bones as these data are inherently limited by the partial volume effect.30 Although this initially caused concern for clinical translation, humans undergo significantly slower bone turnover in comparison to rodents; thus, bone uptake is not expected to hinder the use of 89Zr in patients. Second, deferoxamine is the only commercially available chelator available for 89Zr-labeling, which is prone to gradual transchelation in vivo due to the weak binding of 89Zr.31 To address these concerns, researchers are currently developing novel chelators for 89Zr. Improved chelators with higher stability should reduce bone uptake, thus limiting potential bone marrow toxicity in the patient.
Recently, Su et al. reported the use of a Copper-64 (64Cu)-labeled affibody targeting IGF-1R in a glioblastoma model, yet tumor uptake was modest with 5.08 ± 1.07%ID/g at 24 h postinjection.32 Currently, there are two reports of 64Cu-labeled anti-IGF-1R antibodies in the literature, yet both studies were restrained by time due to the short half-life of 64Cu (12.7 h). For comparison, R1507 is a fully humanized recombinant anti-IGF-1R antibody that was radiolabeled with (Indium-111) 111In and 89Zr for molecular imaging of SUM149-derived subcutaneous xenograft tumors. Although effective, accumulation of 89Zr-R1507 was not evaluated in other cell lines expressing varying levels of IGF-1R expression. In this study, accumulation of 89Zr-Df-1A2G11 was shown to be dependent upon IGF-1R expression levels in three pancreatic cancer cell line-derived tumor models. Although 89Zr-Df-1A2G11 was used to image pancreatic cancer in this study, overexpression of IGF-1R in other solid malignancies makes this marker suitable for imaging other cancers. In turn, this allows for enhanced patient stratification and monitoring of therapeutic response to anti-IGF-1R-based therapies.
Conclusions
This study investigated the potential use of 89Zr-labeled anti-IGF-1R antibody for molecular imaging of IGF-1R expression in three pancreatic cancer tumor models. 89Zr-Df-1A2G11 displayed rapid, persistent, and specific uptake in IGF-1R-expressing tumors with minimal uptake in tumors expressing low levels of IGF-1R. As a positive correlation was found between IGF-1R expression levels and accumulation of the tracer in tumors, 89Zr-Df-1A2G11 may be employed to identify patients that may benefit from anti-IGF-1R therapies. Although this study used the tracer for imaging of pancreatic cancer, IGF-1R is upregulated in several solid malignancies; thus, IGF-1R-based imaging agents may serve as versatile imaging agents for a variety of diseases.
Acknowledgments
This work is supported, in part, by the University of Wisconsin–Madison, the National Institutes of Health (NIBIB/NCI 1R01CA169365, P30CA014520, and T32CA009206), the Department of Defense (W81XWH-11-1-0644), and the American Cancer Society (125246-RSG-13-099-01-CCE).
Supporting Information Available
The Supporting Information is available free of charge on the ACS Publications website at DOI: 10.1021/acs.molpharmaceut.6b00132.
Biodistribution values, biodistribution of nonspecific IgG in MIA PaCa-2 tumor-bearing mice, and immunohistochemistry of tumor sections with a commercial antibody (PDF)
Author Contributions
# C.G.E. and A.K. contributed equally to this work
The authors declare the following competing financial interests: E.J.D. works for NeoClone Biotechnologies International. The other authors declare no conflicts of interest.
Supplementary Material
References
- Sangwan V.; Park M. Receptor Tyrosine Kinases: Role in Cancer Progression. Curr. Oncol. 2006, 13, 191–193. [DOI] [PMC free article] [PubMed] [Google Scholar]
- Denduluri S. K.; Idowu O.; Wang Z.; Liao Z.; Yan Z.; Mohammed M. K.; Ye J.; Wei Q.; Wang J.; Zhao L.; Luu H. H. Insulin-Like Growth Factor (Igf) Signaling in Tumorigenesis and the Development of Cancer Drug Resistance. Genes Dis. 2015, 2, 13–25. 10.1016/j.gendis.2014.10.004. [DOI] [PMC free article] [PubMed] [Google Scholar]
- Jenkins C. R.; Shevchuk O. O.; Giambra V.; Lam S. H.; Carboni J. M.; Gottardis M. M.; Holzenberger M.; Pollak M.; Humphries R. K.; Weng A. P. Igf Signaling Contributes to Malignant Transformation of Hematopoietic Progenitors by the Mll-Af9 Oncoprotein. Exp. Hematol. 2012, 40, 715–723. 10.1016/j.exphem.2012.05.003. [DOI] [PubMed] [Google Scholar]
- Weroha S. J.; Haluska P. Igf-1 Receptor Inhibitors in Clinical Trials--Early Lessons. J. Mammary Gland Biol. Neoplasia. 2008, 13, 471–483. 10.1007/s10911-008-9104-6. [DOI] [PMC free article] [PubMed] [Google Scholar]
- Lee A. V.; Yee D. Targeting Igf-1r: At a Crossroads. Oncology (Williston Park, N.Y.) 2011, 25, 535–551. [PMC free article] [PubMed] [Google Scholar]
- King H.; Aleksic T.; Haluska P.; Macaulay V. M. Can We Unlock the Potential of Igf-1r Inhibition in Cancer Therapy?. Cancer Treat. Rev. 2014, 40, 1096–1105. 10.1016/j.ctrv.2014.07.004. [DOI] [PMC free article] [PubMed] [Google Scholar]
- Cappuzzo F.; Tallini G.; Finocchiaro G.; Wilson R. S.; Ligorio C.; Giordano L.; Toschi L.; Incarbone M.; Cavina R.; Terracciano L.; Roncalli M.; Alloisio M.; Varella-Garcia M.; Franklin W. A.; Santoro A. Insulin-Like Growth Factor Receptor 1 (Igf1r) Expression and Survival in Surgically Resected Non-Small-Cell Lung Cancer (Nsclc) Patients. Ann. Oncol. 2010, 21, 562–567. 10.1093/annonc/mdp357. [DOI] [PMC free article] [PubMed] [Google Scholar]
- Zhang Y.; Cai W. Molecular Imaging of Insulin-Like Growth Factor 1 Receptor in Cancer. Am. J. Nucl. Med. Mol. Imaging 2012, 2, 248–259. [PMC free article] [PubMed] [Google Scholar]
- ACS Cancer Facts & Figures. American Cancer Society: Atlanta, GA, 2016. [Google Scholar]
- England C. G.; Hernandez R.; Eddine S. B.; Cai W. Molecular Imaging of Pancreatic Cancer with Antibodies. Mol. Pharmaceutics 2016, 13, 8–24. 10.1021/acs.molpharmaceut.5b00626. [DOI] [PMC free article] [PubMed] [Google Scholar]
- Vincent A.; Herman J.; Schulick R.; Hruban R. H.; Goggins M. Pancreatic Cancer. Lancet 2011, 378, 607–620. 10.1016/S0140-6736(10)62307-0. [DOI] [PMC free article] [PubMed] [Google Scholar]
- Valsecchi M. E.; McDonald M.; Brody J. R.; Hyslop T.; Freydin B.; Yeo C. J.; Solomides C.; Peiper S. C.; Witkiewicz A. K. Epidermal growth factor receptor and insulinlike growth factor 1 receptor expression predict poor survival in pancreatic ductal adenocarcinoma. Cancer 2012, 118, 3484–3493. 10.1002/cncr.26661. [DOI] [PubMed] [Google Scholar]
- Arteaga C. L.; Kitten L. J.; Coronado E. B.; Jacobs S.; Kull F. C. Jr.; Allred D. C.; Osborne C. K. Blockade of the Type I Somatomedin Receptor Inhibits Growth of Human Breast Cancer Cells in Athymic Mice. J. Clin. Invest. 1989, 84, 1418–1423. 10.1172/JCI114315. [DOI] [PMC free article] [PubMed] [Google Scholar]
- Maloney E. K.; McLaughlin J. L.; Dagdigian N. E.; Garrett L. M.; Connors K. M.; Zhou X. M.; Blattler W. A.; Chittenden T.; Singh R. An Anti-Insulin-Like Growth Factor I Receptor Antibody That Is a Potent Inhibitor of Cancer Cell Proliferation. Cancer Res. 2003, 63, 5073–5083. [PubMed] [Google Scholar]
- Kurzrock R.; Patnaik A.; Aisner J.; Warren T.; Leong S.; Benjamin R.; Eckhardt S. G.; Eid J. E.; Greig G.; Habben K.; McCarthy C. D.; Gore L. A Phase I Study of Weekly R1507, a Human Monoclonal Antibody Insulin-Like Growth Factor-I Receptor Antagonist, in Patients with Advanced Solid Tumors. Clin. Cancer Res. 2010, 16, 2458–2465. 10.1158/1078-0432.CCR-09-3220. [DOI] [PubMed] [Google Scholar]
- Tolcher A. W.; Sarantopoulos J.; Patnaik A.; Papadopoulos K.; Lin C. C.; Rodon J.; Murphy B.; Roth B.; McCaffery I.; Gorski K. S.; Kaiser B.; Zhu M.; Deng H.; Friberg G.; Puzanov I.; Phase I. Pharmacokinetic, and Pharmacodynamic Study of Amg 479, a Fully Human Monoclonal Antibody to Insulin-Like Growth Factor Receptor 1. J. Clin. Oncol. 2009, 27, 5800–5807. 10.1200/JCO.2009.23.6745. [DOI] [PubMed] [Google Scholar]
- Pappo A. S.; Patel S. R.; Crowley J.; Reinke D. K.; Kuenkele K. P.; Chawla S. P.; Toner G. C.; Maki R. G.; Meyers P. A.; Chugh R.; Ganjoo K. N.; Schuetze S. M.; Juergens H.; Leahy M. G.; Geoerger B.; Benjamin R. S.; Helman L. J.; Baker L. H. R1507, a Monoclonal Antibody to the Insulin-Like Growth Factor 1 Receptor, in Patients with Recurrent or Refractory Ewing Sarcoma Family of Tumors: Results of a Phase Ii Sarcoma Alliance for Research through Collaboration Study. J. Clin. Oncol. 2011, 29, 4541–4547. 10.1200/JCO.2010.34.0000. [DOI] [PMC free article] [PubMed] [Google Scholar]
- Ramalingam S. S.; Spigel D. R.; Chen D.; Steins M. B.; Engelman J. A.; Schneider C. P.; Novello S.; Eberhardt W. E.; Crino L.; Habben K.; Liu L.; Janne P. A.; Brownstein C. M.; Reck M. Randomized Phase Ii Study of Erlotinib in Combination with Placebo or R1507, a Monoclonal Antibody to Insulin-Like Growth Factor-1 Receptor, for Advanced-Stage Non-Small-Cell Lung Cancer. J. Clin. Oncol. 2011, 29, 4574–4580. 10.1200/JCO.2011.36.6799. [DOI] [PMC free article] [PubMed] [Google Scholar]
- Heskamp S.; van Laarhoven H. W.; Molkenboer-Kuenen J. D.; Franssen G. M.; Versleijen-Jonkers Y. M.; Oyen W. J.; van der Graaf W. T.; Boerman O. C. Immunospect and Immunopet of Igf-1r Expression with the Radiolabeled Antibody R1507 in a Triple-Negative Breast Cancer Model. J. Nucl. Med. 2010, 51, 1565–1572. 10.2967/jnumed.110.075648. [DOI] [PubMed] [Google Scholar]
- Zhang H.; Zeng X.; Li Q.; Gaillard-Kelly M.; Wagner C. R.; Yee D. Fluorescent Tumour Imaging of Type I Igf Receptor in Vivo: Comparison of Antibody-Conjugated Quantum Dots and Small-Molecule Fluorophore. Br. J. Cancer 2009, 101, 71–79. 10.1038/sj.bjc.6605103. [DOI] [PMC free article] [PubMed] [Google Scholar]
- Hong H.; Nayak T. R.; Shi S.; Graves S. A.; Fliss B. C.; Barnhart T. E.; Cai W. Generation and Screening of Monoclonal Antibodies for Immunopet Imaging of Igf1r in Prostate Cancer. Mol. Pharmaceutics 2014, 11, 3624–3630. 10.1021/mp5003637. [DOI] [PMC free article] [PubMed] [Google Scholar]
- Holland J. P.; Sheh Y.; Lewis J. S. Standardized Methods for the Production of High Specific-Activity Zirconium-89. Nucl. Med. Biol. 2009, 36, 729–739. 10.1016/j.nucmedbio.2009.05.007. [DOI] [PMC free article] [PubMed] [Google Scholar]
- Vosjan M. J.; Perk L. R.; Visser G. W.; Budde M.; Jurek P.; Kiefer G. E.; van Dongen G. A. Conjugation and Radiolabeling of Monoclonal Antibodies with Zirconium-89 for Pet Imaging Using the Bifunctional Chelate P-Isothiocyanatobenzyl-Desferrioxamine. Nat. Protoc. 2010, 5, 739–743. 10.1038/nprot.2010.13. [DOI] [PubMed] [Google Scholar]
- Perk L. R.; Vosjan M. J.; Visser G. W.; Budde M.; Jurek P.; Kiefer G. E.; van Dongen G. A. P-Isothiocyanatobenzyl-Desferrioxamine: A New Bifunctional Chelate for Facile Radiolabeling of Monoclonal Antibodies with Zirconium-89 for Immuno-Pet Imaging. Eur. J. Nucl. Med. Mol. Imaging 2010, 37, 250–259. 10.1007/s00259-009-1263-1. [DOI] [PMC free article] [PubMed] [Google Scholar]
- Janssen J. A.; Varewijck A. J. Igf-Ir Targeted Therapy: Past. Front. Endocrinol. (Lausanne, Switz.) 2014, 5, 224. 10.3389/fendo.2014.00224. [DOI] [PMC free article] [PubMed] [Google Scholar]
- Zhang Y.; Hong H.; Cai W. Pet Tracers Based on Zirconium-89. Curr. Radiopharm. 2011, 4, 131–139. 10.2174/1874471011104020131. [DOI] [PMC free article] [PubMed] [Google Scholar]
- Mould D. R.; Green B. Pharmacokinetics and Pharmacodynamics of Monoclonal Antibodies: Concepts and Lessons for Drug Development. BioDrugs 2010, 24, 23–39. 10.2165/11530560-000000000-00000. [DOI] [PubMed] [Google Scholar]
- Roesch F. Scandium-44: Benefits of a Long-Lived Pet Radionuclide Available from the (44)Ti/(44)Sc Generator System. Curr. Radiopharm. 2012, 5, 187–201. 10.2174/1874471011205030187. [DOI] [PubMed] [Google Scholar]
- Anderson C. J.; Ferdani R. Copper-64 Radiopharmaceuticals for Pet Imaging of Cancer: Advances in Preclinical and Clinical Research. Cancer Biother.Radiopharm. 2009, 24, 379–393. 10.1089/cbr.2009.0674. [DOI] [PMC free article] [PubMed] [Google Scholar]
- Abou D. S.; Ku T.; Smith-Jones P. M. In Vivo Biodistribution and Accumulation of 89zr in Mice. Nucl. Med. Biol. 2011, 38, 675–681. 10.1016/j.nucmedbio.2010.12.011. [DOI] [PMC free article] [PubMed] [Google Scholar]
- Soret M.; Bacharach S. L.; Buvat I. Partial-Volume Effect in Pet Tumor Imaging. J. Nucl. Med. 2007, 48, 932–945. 10.2967/jnumed.106.035774. [DOI] [PubMed] [Google Scholar]
- Deri M. A.; Ponnala S.; Zeglis B. M.; Pohl G.; Dannenberg J. J.; Lewis J. S.; Francesconi L. C. Alternative Chelator for (8)(9)Zr Radiopharmaceuticals: Radiolabeling and Evaluation of 3,4,3-(Li-1,2-Hopo). J. Med. Chem. 2014, 57, 4849–4860. 10.1021/jm500389b. [DOI] [PMC free article] [PubMed] [Google Scholar]
- Su X.; Cheng K.; Liu Y.; Hu X.; Meng S.; Cheng Z. Pet Imaging of Insulin-Like Growth Factor Type 1 Receptor Expression with a 64cu-Labeled Affibody Molecule. Amino Acids 2015, 47, 1409–1419. 10.1007/s00726-015-1975-4. [DOI] [PubMed] [Google Scholar]
Associated Data
This section collects any data citations, data availability statements, or supplementary materials included in this article.