

Abstract
Background
In 2004, Ghana began implementation of a National Health Insurance Scheme (NHIS) to minimize out-of-pocket expenditure at the point of use of service. The implementation of the scheme was accompanied by increased access and use of health care services. Evidence suggests most health facilities are faced with management challenges in the delivery of services. The study aimed to assess the effect of the introduction of the NHIS on health service delivery in mission health facilities in Ghana. We conceptualised the effect of NHIS on facilities using service delivery indicators such as outpatient and inpatient turn out, estimation of general service readiness, revenue and expenditure, claims processing and availability of essential medicines. We collected data from 38 mission facilities, grouped into the three ecological zones; southern, middle and northern. Structured questionnaires and exit interviews were used to collect data for the periods 2003 and 2010. The data was analysed in SPSS and MS Excel.
Results
The facilities displayed high readiness to deliver services. There were significant increases in outpatient and inpatient attendance, revenue, expenditure and improved access to medicines. Generally, facilities reported increased readiness to deliver services. However, challenging issues around high rates of non-reimbursement of NHIS claims due to errors in claims processing, lack of feedback regarding errors, and lack of clarity on claims reporting procedures were reported.
Conclusion
The implementation of the NHIS saw improvement and expansion of services resulting in benefits to the facilities as well as constraints. The constraints could be minimized if claims processing is improved at the facility level and delays in reimbursements also reduced.
Keywords: Health insurance, Mission facilities, Service delivery, Ghana
Background
Ghana is among the first countries in sub-Saharan Africa to begin implementation of a National Health Insurance Scheme (NHIS). Until the NHIS was introduced in 2003, the country had over time implemented a number of financing reforms. These reforms - with accompanying exemption policies - included general tax revenues and user fees [1] with the latter dominating the health financing scene from the early 1970s until 2003 when a National Health Insurance law was passed. Subsequently in 2004, Ghana begun implementation of the NHIS as a policy objective to minimize out-of-pocket expenditure at the point of use of service [2], thus reducing the financial barrier to health service utilization. The implementation of the scheme saw the registration of over 45 % of the Ghanaian population into the scheme by 2011 [3].
Since the introduction of the NHIS, studies have focused on assessing client interaction with the scheme as consumers, particularly on utilization and access to services [4–8], equity [9–11], client perceptions of quality of care [12, 13], client moral hazard behaviour among others [14, 15]. There is, however limited evidence on how providers are coping and managing the increased demand for health care services. For example, utilization and access to health services especially among the poor has increased [3] while most health facilities have not had corresponding increases in human and other resources to meet the increased demand. The NHIS requires facilities to provide documentation in processing and submission of claims by health care providers and this places a toll on already limited resources (i.e. time and personnel) in the facilities. Claims processing is an important component in the implementation of the scheme since providers could face losses in revenue should there be any rejections in claims submitted [16]. Again the timing and frequency of claims reimbursements has implications on the overall management of facilities.
Mission facilities are the second largest provider of healthcare in the country. They are identified as the Christian Health Association of Ghana (CHAG) member institutions. This organization is quasi-government primarily owned by 21 Christian religious organisations. CHAG currently has 183 health facilities and training institutions providing care for the most vulnerable and underprivileged population groups in all 10 Regions of Ghana, particularly in the most remote areas. CHAG is autonomous and takes an independent position to advocate and promote improvements in the health sector and to promote the interest of its members and its target beneficiaries. By 2010, 90 of the facilities had received accreditation to provide care for clients of the NHIS. Again, some of these facilities have experimented with health insurance, in the form of community based health insurance schemes prior to the introduction of the NHIS in 2003 [17], giving these facilities some foreknowledge of operations of health insurance. CHAG’s experiences in operating health insurance schemes in some of their facilities within their communities provided information towards implementation of the current health insurance scheme in Ghana [18].
Against this background, this study set out to assess the effect of the introduction of health insurance on service delivery of mission facilities in Ghana. The study‘s value is in the provision of evidence on how providers respond to the challenges that come with implementation of the scheme.
Methods
Study design
A retrospective cross-sectional study was undertaken in November 2012, collecting information from two time periods-2003 and 2010.
Selection of study facilities
The study facilities were selected from the 183 CHAG member institutions operating under various capacities as Specialist centres (3), hospitals (59), clinics (77), primary health centres (15), and health centres (19); training institutions (10) were not included in this study. Our sampling frame was the 90 facilities that had received accreditation by 2010. We selected all the three specialist centres, sampled hospitals, clinics, health centres and PHC centres by probability proportional to size based on the number and type of facility per region. Further, the regions were categorized into the three ecological zones, namely, savannah (northern), forest (middle) and coastal (southern). In total, five facilities in the northern, 17 in the middle and 12 in the southern zones making a total of 34 facilities were selected (Table 1).
Table 1.
Facilities and key health services provided
| Zone | Name of facility | Type of facility | Key health services provided | |
|---|---|---|---|---|
| 1 | Middle | Methodist Faith Healing Hospital, Ankaase | Hospital | Outpatient/inpatient services |
| 2 | Middle | Seventh Day Adventist Hospital, Asamang | Hospital | Outpatient/inpatient services |
| 3 | Middle | Akoma Memorial SDA Hospital, Kumasi | Hospital | Outpatient/inpatient services |
| 4 | Middle | Methodist clinic, Bosomtwi | Clinic | Outpatient services |
| 5 | Middle | Aburaso Methodist Clinic, Atwima Kwakuma | Clinic | Outpatient services |
| 6 | Middle | Church of Christ mission clinic | Clinic | Outpatient services |
| 7 | Middle | Anglican eye clinic | Specialist Centre | Eye/Ophthalmic services |
| 8 | Middle | Benito Menni health centre | Health Centre | Outpatient services |
| 9 | Middle | Sacred heart health centre | Health Centre | Outpatient services |
| 10 | Middle | Holy family Hospital | Hospital | Outpatient/inpatient services |
| 11 | Middle | Presbyterian hospital, Brong Ahafo | Hospital | Outpatient/inpatient services |
| 12 | Middle | St John of God | Specialist Centre | Orthopaedics |
| 13 | Middle | Janie speaks A.M.E Zion | Health Centre | Outpatient services |
| 14 | Middle | Presbyterian Health Centre, Abetifi | Health Centre | Outpatient services |
| 15 | Middle | St. Martin's de Porres Hospital | Hospital | Outpatient/inpatient services |
| 16 | Middle | Abetifi presby health centre | Health Centre | Outpatient services |
| 17 | Middle | Prebyterian clinic | Clinic | Outpatient services |
| 18 | Northern | Baptist Medical Centre, Nalerigu | Hospital | Outpatient/inpatient services |
| 19 | Northern | Catholic PHC, Bole | Primary Health Centre | Outpatient services |
| 20 | Northern | St. Theresa Health Centre, Zorko | Health Centre | Outpatient services |
| 21 | Northern | Martyrs of Uganda Health Centre | Health Centre | Outpatient services |
| 22 | Northern | Presbyterian PHC, Bolgatanga | Primary Health Centre | Outpatient services |
| 23 | Southern | Presbyterian clinic, Assin South | Clinic | Outpatient services |
| 24 | Southern | St. Gregory Catholic clinic | Clinic | Outpatient services |
| 25 | Southern | Manna Mission Hospital, Teshie-Nungua | Hospital | Outpatient/inpatient services |
| 26 | Southern | Emmanuel Eye Centre | Specialist Centre | Eye/Ophthalmic services |
| 27 | Southern | St. Andrew's Clinic and Maternity | Clinic | Outpatient services, antenatal |
| 28 | Southern | Mary Theresa Hospital, Dodi-Papase | Hospital | Outpatient/inpatient services |
| 29 | Southern | The Salvation Army Clinic, Adaklu Sofa | Clinic | Outpatient services |
| 30 | Southern | Matter Ecclesiae, Sokode | Clinic | Outpatient services |
| 31 | Southern | St. Martin De Pores hospital | Hospital | Outpatient/inpatient services |
| 32 | Southern | Holy child Clinic, Sekondi | Clinic | Outpatient services |
| 33 | Southern | Pentecost Clinic | Clinic | Outpatient services |
| 34 | Southern | Holy child Clinic, Ahanta | Clinic | Outpatient services |
Data collection
Annual data were collected for time periods, 2003 and 2010, the former being the immediate year preceding the introduction of health insurance and the latter being five years after the introduction of the scheme (a period long enough to observe any effects on service delivery) but also the first year after introduction for which complete data were available as at the time of data collection. Further, providers would have also gained familiarity with the scheme to make suggestions for improvement.
Data were collected on various aspects of service delivery. Annual reports of facilities were reviewed for information on resources used, financial data and selected service delivery indicators, mainly outpatients and inpatient visits. Data on facility revenue and expenditures were also collected. Data on indicators for service readiness such as basic amenities, basic equipment, standard precautions for prevention of infections, laboratory equipment, and availability of essential medicines were also collected.
Data analysis
We analysed different aspects we considered related to delivery of services by health facilities. First, outpatient attendance for all facilities and inpatient attendance for hospitals only. Second, we estimated facilities’ overall service readiness using a general service readiness (GSR) indicator developed by WHO. This indicator identifies five (5) domains to which facilities can be assessed for readiness to offer services. They include infrastructure, basic supplies, standard precautions, laboratory tests, medicines and commodities. A facility’s readiness to offer service is based on a cumulative score from the five domains and ranges from 0 to 1 with higher values (>0.76) representing readiness to deliver services [19].
Other issues related to service delivery that were analysed were revenue and expenditure, claims submission/reimbursements and availability of essential medicines. We estimated total expenditures and internally generated funds before and after the NHIS. These indicators were analysed using a before-after approach.
For claims, we estimated patterns of claims reimbursements, errors in claims submission and percentage claims not reimbursed after the NHIS. The Ghanaian currency figures were converted to US dollar equivalent using mid-year exchange rate for 2003 and 2010 [20]. Availability of essential medicines was also analysed based on a list of common disease conditions reported at facilities. Data analysis outputs are presented in tables and charts.
Ethical approval and consent
With regard to ethical approval, no formal approval was sought from any Institutional Review Board (IRB) in Ghana for this study. This was because researchers from the School of Public Health (SPH), University of Ghana, were contracted by CHAG to undertake this study. CHAG is the governing body of mission health facilities in Ghana. Management of selected study mission health facilities were directly informed of the study by CHAG given that these facilities were under their control. SPH in conjunction with CHAG designed the study and SPH did the data collection and analyses. Verbal consent were obtained from selected clients at these facilities before interviews.
Results
Outpatient and inpatient visits
The total outpatient and inpatient visits for all facilities before introduction of the NHIS (i.e. 2003) were 1,677,731 and 141,243 respectively, and 2,749,405 outpatient visits and 213,175 inpatient visits after NHIS (i.e. 2010). This represented an increase of 64 % and 51 % respectively over the period. Whereas hospitals in the southern and northern zones recorded increases in outpatient visits of 56 % and 29 % respectively, hospitals in the middle zone recorded 1 % increase after the introduction of the NHIS. With respect to inpatient visits, hospitals in the southern and middle zones recorded increases of 48 % and 63 % respectively whilst hospitals in the northern zone recorded a marginal increase of about 0.1 % (Table 2). The largest increases in outpatient visits were recorded by specialist centres in the middle zone followed by PHCs in the northern zone.
Table 2.
Distribution of outpatient and inpatient attendance in CHAG facilities before and after NHIS
| Ecological zones | Type of facility | Total OPD visits before NHIS | Total OPD visits after NHIS | % increase (after NHIS) | Total inpatient visits before NHIS | Total inpatient visits before NHIS | % increase (after NHIS) |
|---|---|---|---|---|---|---|---|
| Southern | Hospital | 495,035 | 770,667 | 56 | 69,552 | 102,620 | 48 |
| Clinic | 61,056 | 292,183 | 3.79 timesa | - | - | ||
| Health Centre | 4,276 | 18,733 | 3.38 timesa | - | - | ||
| Specialist Centre | 29,568 | 30,960 | 5 | - | - | ||
| Middle | Hospital | 699,082 | 707,089 | 1 | 62,100 | 100,958 | 63 |
| Clinic | 296,229 | 713,165 | 1.41 timesa | - | - | ||
| Health Centre | 15,794 | 58,675 | 2.72 timesa | - | - | ||
| PHC | - | 4,833 | - | - | - | ||
| Specialist Centre | 1,384 | 16,373 | 10.83 timesa | - | - | ||
| Northern | Hospital | 73,506 | 94,828 | 29 | 9,591 | 9,597 | 0.06 |
| Health Centre | - | 25,837 | - | - | - | ||
| PHC | 1,800 | 16,062 | 7.92 timesa | - | - | ||
| Total | Hospital | 1,267,624 | 1,572,584 | 24 | 141,243 | 213,175 | 51 |
| Clinic | 357,285 | 1,005,348 | 1.81 timesa | - | - | - | |
| Health Centre | 20,070 | 103,245 | 4.14 timesa | - | - | - | |
| PHC | 1,800 | 20,895 | 10.61 timesa | - | - | - | |
| Specialist Centre | 30,952 | 47,333 | 53 | - | - | - | |
| Total | 1,677,731 | 2,749,405 | 64 | 141,243 | 213,175 | 51 |
aThe increase was over 100 %
General Service Readiness (GSR)
Figure 1 presents the general services readiness scores (GSR) categorized by type of facility and zone. The figure shows overall improvement in GSR from 2002 to 2010 as follows; in the southern zone reported an increase from 0.69 to 0.76, the middle zone from 0.80 to 0.91 and the northern from 0. To 0.81. Facilities that recorded lowest GSR scores in 2003 were clinics (0.60) in the southern zone, specialist centers (0.62) in the middle zones and PHCs (0.62) in the northern zones. Interestingly these facilities recorded the lowest scores also in 2010.
Fig. 1.
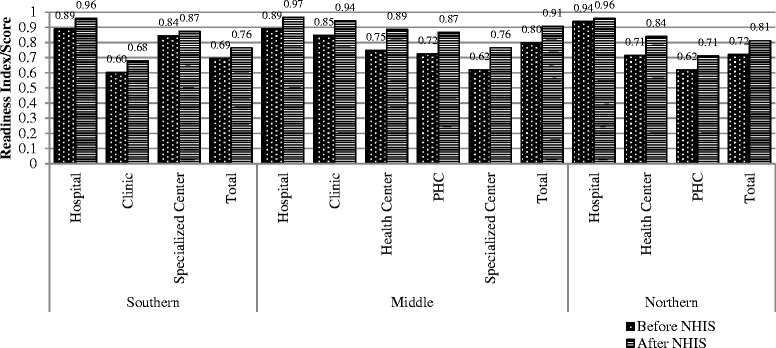
General services readiness scores
Expenditure and internally generated funds
The total annual expenditure for all facilities increased from US$4,748,385.10 before the introduction of NHIS to US$66,867,518.22 after NHIS while internally-generated funds increased from US$4,947,569.97 to US$41,505,083.73 accordingly (Table 3). The largest increases in both expenditure and IGF were recorded by specialist centres, from US$20,825.40 to US$11,383,097.20 and from US$10,708.07 to US$1,139,535.91 respectively.
Table 3.
Expenditure and IGF before and after NHIS (US$)
| Type of facility | Total expenditure before NHIS | Total expenditure after NHIS | Total IGF before NHIS | Total IGF after NHIS |
|---|---|---|---|---|
| Hospital | 4,417,146.27 | 41,022,555.86 | 4,324,357.71 | 34,005,075.07 |
| Clinic | 141,084.94 | 10,413,869.27 | 507,991.82 | 4,973,039.68 |
| Health Centre | 134,412.60 | 3,421,049.38 | 104,512.36 | 773,006.77 |
| PHC | 34,915.89 | 626,946.50 | - | 614,426.30 |
| Specialist Centre | 20,825.40 | 11,383,097.20 | 10,708.07 | 1,139,535.91 |
| Total | 4,748,385.10 | 66,867,518.22 | 4,947,569.97 | 41,505,083.73 |
In addition, expenditure per patient (out-patient services) increased for all types of facilities1 (except PHCs) after the NHIS compared to before the NHIS. Hospital expenditure per patient increased by about four times while those for clinics and health centres were about 15 and 3 times respectively. For in-patient services, cost per patient day equivalent for hospitals was calculated2 to be US$ 1.02 before the NHIS and US$3.67 after the NHIS (Fig. 2).
Fig. 2.
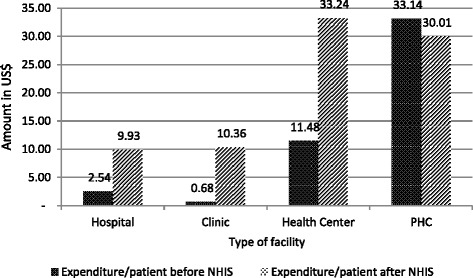
Expenditure per patient before and after NHIS
Claims submission and reimbursement
On average, the value of claims submitted by hospitals in the southern zone to NHIA was US$859,964.76 with reimbursement value of US$ 839,122.44 indicating about 2.4 % of claims submitted not reimbursed. The case of hospitals in the northern zone was no different - about 1 % of the claims submitted was not reimbursed. The percentage of claims submitted by hospitals in the middle zone which was not reimbursed was 13 %, higher than hospitals in southern and northern zones. In addition, within the southern zone, clinics had the highest proportion of claims that were not reimbursed (46 %) whilst specialist centres had the lowest non-reimbursement rate of less than 1 %. A similar trend was recorded for facilities in the middle zone where 48 % of claims submitted by clinics were not reimbursed. In the northern zone, health centres recorded the highest non-reimbursement rate (about 13 %), whilst PHCs recorded the lowest non-reimbursement rate (1 %).
The reimbursement of NHIS claims by the NHIA to facilities takes between 1 to 4 months after submission of claims. More specifically, hospitals in the southern zone and health centres in the middle zone had to wait for between 3 to 4 months to be reimbursed whilst PHCs in the northern zone wait for less than 1 month after claims submission, on average (Table 4, Fig. 3).
Table 4.
Average annual NHIS claims submissions and reimbursements, 2010a
| Ecological Zone | Type of facility | Claims submitted (US$b) | Claims reimbursed (US$) | % claims not reimbursed | Number of facilities |
|---|---|---|---|---|---|
| Southern | Hospital | 859,964.76 | 839,122.44 | 2 | 3 |
| Clinic | 360,472.47 | 193,086.49 | 46 | 8 | |
| Health Centre | 133,442.80 | 122,804.05 | 8 | 1 | |
| Specialist Centre | 68,185.79 | 67,742.28 | 1 | 1 | |
| Middle | Hospital | 960,733.77 | 838,349.19 | 13 | 5 |
| Clinic | 199,697.26 | 103,593.36 | 48 | 4 | |
| Health Centre | 102,319.02 | 97,282.30 | 5 | 6 | |
| Specialist Centre | 487,763.16 | 399,354.13 | 18 | 2 | |
| Northern | Hospital | 218,340.38 | 215,503.77 | 1 | 1 |
| Health Centre | 71,572.64 | 62,609.66 | 13 | 2 | |
| PHC | 29,612.36 | 29,266.98 | 1 | 2 |
aThe table represents facilities for which NHIS claims data were readily available; bUS$ and Ghana Cedi exchange rate was GHC1.4187 to US$1 in 2010
Fig. 3.
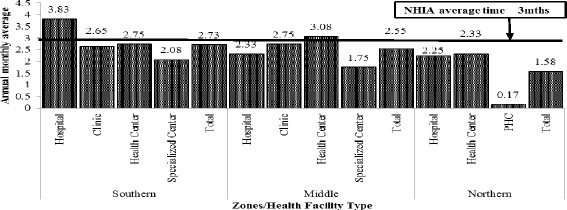
Period between claims submission and reimbursement, 2010
Availability/non-availability of essential medicines
Table 5 presents the non-availability of selected essential medicines in facilities (excluding specialist centres) before and after introduction of the NHIS. The table revealed that there was a general improvement in availability of essential medicines in facilities in all the three ecological zones after the introduction of the NHIS. In the Northern zone however, the percentage of essential medicines not available remained the same for indicators (conditions) such as diabetes, cardiovascular diseases and depression while increasing for conditions related to the central nervous system and ulcers (i.e. from 25 to 50 %).
Table 5.
Non-availability of essential medicines (%)
| Southern zone | Middle zone | Northern zone | |||||
|---|---|---|---|---|---|---|---|
| Indication | Medicine name | Before | After | Before | After | Before | After |
| Malaria | ACTs | 53.80 | 7.70 | 33.30 | 0 | 40.00 | 0 |
| Asthma | Salbutamol | 25.00 | 7.70 | 26.70 | 6.20 | 0 | 20.00 |
| Diabetes | Gilbendamide | 38.50 | 30.80 | 20.00 | 18.80 | 60.00 | 60.00 |
| Cardiovascular disease | Atenolol | 58.30 | 23.10 | 20.00 | 25.00 | 40.00 | 40.00 |
| Depression | Amitriptyline | 58.30 | 38.50 | 33.30 | 50.00 | 60.00 | 60.00 |
| Infectious disease | Ciprofloxacin | 8.30 | 0 | 13.30 | 6.20 | 20.00 | 0 |
| Infectious disease | Co-trimoxazole | 25.00 | 7.70 | 6.00 | 6.20 | 0 | 0 |
| Infectious disease | Amoxiillin | 15.40 | 7.70 | 13.30 | 6.20 | 20.00 | 0 |
| Central nervous system disease | Diazepam | 15.40 | 7.70 | 13.30 | 6.20 | 20.00 | 50.00 |
| Ulcer | Omeprazole | 30.80 | 15.40 | 26.50 | 18.80 | 25.00 | 50.00 |
Discussion
Our study has revealed that on the whole, there were general improvements in service delivery after the introduction of the NHIS. This notwithstanding, the facilities also enumerated significant challenges that need to be addressed to facilitate improvement in the delivery of health services to their catchment populations.
The results of the study show that outpatient visits increased by 64 % and inpatient visits increased by 51 %. These results indicate high service utilization as a result of the introduction of the NHIS. Indeed many studies in Ghana and other developing countries have shown that the implementation of a health insurance scheme (national or community based) results in people seeking for formal care once insured [8, 21, 22]. The Ministry of Health (MOH) in their 2013 annual report explained that the increases in utilization can be attributed to increase in outpatient attendance by the insured [23]. Again, Yawson et al. reported mean out-patient attendance to be between 1.0-2.48 by the insured and 0.39-1.18 by the uninsured [14]. This increase in outpatient attendance could imply increased revenue to facilities, at the same time increased burden on health infrastructure which must see proportionate improvements to cope with the increased workload. Facilities thus need to set aside portions of their revenue to undertake infrastructural expansions so as not to compromise the quality of their outputs i.e. services delivered.
Furthermore, the results show that the general service readiness of all facilities improved after the introduction of the NHIS. It is worth noting that specialist centres in the middle zone, had the largest increase in outpatient visits and recorded the highest improvement in service readiness. This may be attributed to improved infrastructure and other equipment but may also be due to improved efficiency of operations. The effect of service readiness can be interpreted in patient’s perceptions of quality of care and patients’ satisfaction with quality of care after introduction of the health insurance scheme in the country. Studies have shown that generally, quality of care has improved for both the insured and uninsured even though sometimes insured patients have to wait for longer hours to be attended to [24, 25].
The findings also show that facilities’ spending per patient increased after the introduction of the NHIS compared to the period before the NHIS. In economic terms, this denotes inefficiency in spending. Plausible reasons for this include the extra spending that facilities make on NHIS members that is not reimbursed by the NHIA. A notable example – which also came out of the in depth interviews with administrators is the expenditure on documentation. The reimbursements do not cover documentation and facilities may also have made expenditure on other items (e.g. building) which do not necessarily relate directly to the NHIS.
With regard to health expenditure, the results showed that overall, there was a nine-fold increase in expenditure of all facilities and a seven-fold increase in internally-generated funds. If the facilities invested more in infrastructure, the high increases in expenditure could be justified as improved infrastructure produces long term benefits. However, if these increases were as a result of other activities that do not yield better returns, then the situation could be worrying. Facilities need to evaluate their spending patterns to ensure that they do not reflect inefficiencies in management. It is important to note that the large increases in outpatient visits at specialist centres reflects the large increase in IGF, and similarly large increase in expenditure and (possibly) investment in critical infrastructure.
The total claims reimbursed to facilities represented about 59 % of the total expenditure of these facilities in 2010. Thus, revenue generated from NHIS alone did not seem to match facilities’ expenditure in the short-run. Admittedly, facilities have other sources of revenue which may compensate for the shortfalls. Moreover, some of the expenditures were likely to be investment (i.e., capital items which have longer useful lives) that may have long term benefits. The results further revealed high rate of non-reimbursement of NHIS claims, particularly among clinics in the middle and southern zones and low rates of non-reimbursement among PHCs. Among the reasons cited for the high non-reimbursement rates were errors in claims processing, no feedback from NHIA regarding the nature of errors and lack of clarity on reporting procedures. The plausible reasons for the marked differences in non-reimbursement between facility types are that PHCs generally have lower utilization (workload) compared to clinics; thus, more time for appropriate staff to spend on managing claims. This was observed during interaction with accounting and managerial staff. The fairly low rates of non-reimbursement among hospitals – particularly in southern and middle zones – may be attributed to the comparatively higher calibre of staff who are dedicated to managing claims at these higher level facilities. Anecdotal evidence and some studies have reported that these errors results in long delays in claims reimbursements, which this study as reported to be around 3 months [26]. Nonetheless, facility administrators must put in place administrative structures to reduce financial losses due to errors in claims processing.
The availability of essential medicines in the right quality and price are core in service delivery. The study showed that all facilities improved the availability of essential medicines after the introduction of the NHIS compared to the period before the NHIS. Similar studies in Ghana have found that in as much as utilization and availability of medicines have increased, there were low reimbursement rates for medicines which result in providers asking patients to pay supplementary fees. Sometimes, medicine supplies were also intermittent [27, 28]. Thus there is room for further improvements especially in facilities with limited access to medicines, for our study this will be in the northern zones.
A number of issues are important in the interpretation of our results. First we recognise competing interventions at around the time of implementation of the NHIS which include WHO’s universal health coverage agenda, the Millennium Development Goals (MDGs), with target on health and other local policies. These interventions influence health service delivery in one way or the other and thus we cannot associate all outcomes in our results to be effect of the NHIS, though in the case of the MDGs, the implementation of interventions towards meeting the MDGs begun shortly after their adoption and before the introduction of the NHIS in 2004. Thus, it could be argued that the effects of the MDGs may have been the same before and after the introduction of the NHIS. Notwithstanding, the MDGs gathered momentum with time, and it is expected that a lot more was done after 2004. Second, this study collected data from two time points, one before and one after. A time trend analysis for different years before and after would have been more appropriate. However, shortfalls in data availability imposed a limit on what analysis could be done, limiting the study to the two time points.
It is important to note that service delivery is only one of the components of the health system, with the other components being leadership and governance, health workforce, medical products and technologies, health information, and health financing. Thus, given the interconnectedness of the systems building blocks, any effects of the NHIS (i.e. financing) on service delivery would lead affect other building blocks of the health system [29]. For simplicity, however, the current study focuses on service delivery, though it is acknowledged that the effects of financing on service delivery would be observed in access, safety and quality and ultimately in efficiency, responsiveness and equity in health.
Conclusion
In general terms, with the introduction of the NHIS, mission facilities improved and expanded their services to meet the increased utilization. This brought in its wake financial and other materials benefits to the facilities. Nonetheless, errors in claims leading to large non-reimbursements if unchecked could mar the benefits derived from NHIS. We recommend that mission facilities engage with the health insurance authority (NHIA) to provide clear feedback on the nature of the errors and find ways to minimize these errors. The authority should also conduct periodic training of facilities on claims processing. It is recommended that facilities may hire staff specifically to take care of claims processing to ease the burden on health workers to focus on their core duties. Finally given the increased utilization and in order not to sacrifice quality of care, facilities should invest in expanding infrastructure to meet the increased demand.
Abbreviations
CHAG, Christian Health Association of Ghana; GSR, General Service Readiness; IRG, Institutional Review Board; MOH, Ministry of Health; NHIA, National Health Insurance Authority; NHIS, National Health Insurance Scheme; PHC, Primary Health Centers; SPH, School of Public Health; WHO, World Health Organization.
Acknowledgements
The authors will like to acknowledge the Christian Health Association of Ghana (CHAG) for funding the design, field data collection and analysis. We also want to express our gratitude CHAG member institutions across the country for their assistance in both qualitative and quantitative data collection.
Funding
The study was funded by the Christian Health Association of Ghana (CHAG) for data collection, and analysis.
Availability of data and materials
Data will be made available upon request.
Authors’ contributions
GCA, JN and MA contributed to conceptualization, design, analysis, writing and review of the manuscript. CA and GB contributed in conceptualization and review of the manuscript. All authors approved the final version of the manuscript.
Authors’ information
GCA, JN and MA are faculty at the department of Health Policy, Planning and Management (HPPM) of the School of Public Health, University of Ghana. CA and GB, were senior level managers at CHAG head office as at the time of the study. Currently CA is the deputy director, Mental Health Authority in Ghana and GB is the CEO of Korle Bu teaching hospital.
Competing interests
The authors declare that they have no competing interests.
Consent for publication
Not applicable.
Ethics approval and consent to participate
Not applicable.
Footnotes
The figure for specialist facilities was considered as an outlier and was, therefore, dropped from the graph.
Based on the assumption that a hospital stay is equivalent to 3 OPD visits and average length of stay is 4 days, hence hospital stay is weighted as equivalent to 12 OPD visits (Mbananga et al. [30]). This assumption was used to extrapolate inpatient expenditure. Total hospital days were estimated as 4 times total admissions.
References
- 1.Arhinful DK. Department of Medical Anthropology and Sociology. Amsterdam: University of Amsterdam; 2003. The solidarity of self-interest: social and cultural feasibility of rural health insurance in Ghana. [Google Scholar]
- 2.Agyepong IA, Adjei S. Public social policy development and implementation: a case study of the Ghana National Health Insurance Scheme. Health Policy Plan. 2008;23:150–60. doi: 10.1093/heapol/czn002. [DOI] [PubMed] [Google Scholar]
- 3.National Health Insurance Authority . Annual Report of the NHIS for 2010: Growing Healthier and Stronger. Accra: National Health Insurance Authority; 2011. [Google Scholar]
- 4.Owoo N, Lambon-Quayefio M. National health insurance, social influence and antenatal care use in Ghana. Heal Econ Rev. 2013;3(1):19. doi: 10.1186/2191-1991-3-19. [DOI] [PMC free article] [PubMed] [Google Scholar]
- 5.Frimpong JA, et al. The complex association of health insurance and maternal health services in the context of a premium exemption for pregnant women: a case study in Northern Ghana. Health Policy Plan. 2014;29(8):1043–53. doi: 10.1093/heapol/czt086. [DOI] [PubMed] [Google Scholar]
- 6.Kanchebe Derbile E, van der Geest S. Repackaging exemptions under National Health Insurance in Ghana: how can access to care for the poor be improved? Health Policy Plan. 2013;28(6):586–95. doi: 10.1093/heapol/czs098. [DOI] [PubMed] [Google Scholar]
- 7.Dixon J, et al. National Health Insurance Scheme enrolment and antenatal care among women in Ghana: is there any relationship? Trop Med Int Health. 2014;19(1):98–106. doi: 10.1111/tmi.12223. [DOI] [PubMed] [Google Scholar]
- 8.Blanchet NJ, Fink G, Osei-Akoto I. The effect of Ghana's Health Insurance Scheme on health care utilisation. Ghana Med J. 2012;46(2):76–84. [PMC free article] [PubMed] [Google Scholar]
- 9.Jehu-Appiah C, et al. Equity aspects of the National Health Insurance Scheme in Ghana: who is enrolling, who is not and why? Soc Sci Med. 2011;72(2):157–65. doi: 10.1016/j.socscimed.2010.10.025. [DOI] [PubMed] [Google Scholar]
- 10.Odeyemi I, Nixon J. Assessing equity in health care through the national health insurance schemes of Nigeria and Ghana: a review-based comparative analysis. Int J Equity Health. 2013;12(1):1–18. doi: 10.1186/1475-9276-12-9. [DOI] [PMC free article] [PubMed] [Google Scholar]
- 11.Mills A, et al. Equity in financing and use of health care in Ghana, South Africa, and Tanzania: implications for paths to universal coverage. Lancet. 2012;380(9837):p. 126–33. doi: 10.1016/S0140-6736(12)60357-2. [DOI] [PubMed] [Google Scholar]
- 12.Jehu-Appiah C, et al. Household perceptions and their implications for enrolment in the National Health Insurance Scheme in Ghana. Health Policy Plan. 2011;27(3):222–33. doi: 10.1093/heapol/czr032. [DOI] [PubMed] [Google Scholar]
- 13.Dixon J, Tenkorang E, Luginaah I. Ghana’s National Health Insurance Scheme: a national level investigation of members’ perceptions of service provision. BMC International Health and Human Rights. 2013;13(1):1–10. doi: 10.1186/1472-698X-13-35. [DOI] [PMC free article] [PubMed] [Google Scholar]
- 14.Yawson AE, Biritwum RB, Nimo PK. Effect of consumer and provider moral hazard behaviour at a municipal hospital out-patient department on Ghana's National Health Insurance Scheme. Ghana Med J. 2012;46(4):200–10. [PMC free article] [PubMed] [Google Scholar]
- 15.Yilma Z, van Kempen L, de Hoop T. A perverse ‘net’ effect? Health insurance and ex-ante moral hazard in Ghana. Soc Sci Med. 2012;75(1):138–47. doi: 10.1016/j.socscimed.2012.02.035. [DOI] [PubMed] [Google Scholar]
- 16.National Health Insurance Authority . Accreditation Manual: National Health Insurnace Scheme. Accra: National Health Insurance Authority; 2009. [Google Scholar]
- 17.Atim C, Sock M. An External Evaluation of the Nkoranza Community Financing Health Insurance Scheme, Ghana. Bethesda: Abt Associates Inc; 2000. [Google Scholar]
- 18.Seddoh A, Akor SA. Policy initiation and political levers in health policy: lessons from Ghana's health insurance. BMC Public Health. 2012;12(suppl1):S10. doi: 10.1186/1471-2458-12-S1-S10. [DOI] [PMC free article] [PubMed] [Google Scholar]
- 19.World Health Organization . Monitoring the building blocks of health systems: a handbook of indicators and their measurements. Geneva: WHO; 2010. [Google Scholar]
- 20.Bank of Ghana. Dollar-Cedi exchange rate. 2013 March 2013]; Available from: https://www.bog.gov.gh.
- 21.Fenny AP, et al. Treatment-seeking behaviour and social health insurance in africa: the case of Ghana under the National Health Insurance Scheme. Global J Health Sci. 2015;7(1):296–314. doi: 10.5539/gjhs.v7n1p296. [DOI] [PMC free article] [PubMed] [Google Scholar]
- 22.Abrokwah SO, Moser CM, Norton EC. The effect of social health insurance on prenatal care: the case of Ghana. Int J Health Care Finance Econ. 2014;14(4):385–406. doi: 10.1007/s10754-014-9155-8. [DOI] [PubMed] [Google Scholar]
- 23.Ghana Health Service . Annual Report 2013. Accra: GHS; 2012. [Google Scholar]
- 24.Atinga R. Healthcare quality under the National Health Insurance Scheme in Ghana: Perspectives from premium holders. Int J Quality & Reliability Management. 2011;29(2):144–61. doi: 10.1108/02656711211199883. [DOI] [Google Scholar]
- 25.Fenny AP, et al. Patient satisfaction with primary health care – a comparison between the insured and Non-insured under the national health insurance policy in Ghana. Global J Health Sci. 2014;6(4):9–21. doi: 10.5539/gjhs.v6n4p9. [DOI] [PMC free article] [PubMed] [Google Scholar]
- 26.Sodzi-Tettey S, et al. Challenges in provider payment under the Ghana national health insurance Scheme: a case study of claims management in Two districts. Ghana Med J. 2012;46(4):189–99. [PMC free article] [PubMed] [Google Scholar]
- 27.Ashigbie PG, Azameti D, Wirtz VJ. Challenges of medicines management in the public and private sector under Ghana’s National Health Insurance Scheme – a qualitative study. J Pharmaceutical Policy and Practice. 2016;9:6. doi: 10.1186/s40545-016-0055-9. [DOI] [PMC free article] [PubMed] [Google Scholar]
- 28.Atinga R, et al. Migrating from user fees to social health insurance: exploring the prospects and challenges for hospital management. BMC Health Serv Res. 2012;12(1):174. doi: 10.1186/1472-6963-12-174. [DOI] [PMC free article] [PubMed] [Google Scholar]
- 29.World Health Organization . The world health report 2000-Health systems: improving performance. Geneva: World Health Organization; 2000. [Google Scholar]
- 30.Mbananga N, Madale R, Becker P. Evaluation of Hospital Information System in the Northern Province in South Africa-using outcome measures. Pretoria: The Health Systems Trust, Medical Research Council of South Africa; 2002. [Google Scholar]
Associated Data
This section collects any data citations, data availability statements, or supplementary materials included in this article.
Data Availability Statement
Data will be made available upon request.