Abstract
Backgrounds
Down syndrome (DS), caused by triplication of human chromosome 21, is the most common aneuploidies. The main characteristic of DS patients is intellectual disability. MicroRNAs (miRNAs) play important regulatory roles in various biological processes, such as embryonic development, cell differentiation, proliferation and apoptosis. Several miRNAs have shown association with DS. However, the role of miRNAs in DS patients has not been well elaborated.
Methods
In this research, total RNA extracted from fetal hippocampal tissues was used to analyze miRNA and mRNA expression via Affymetrix miRNA 4.0 and PrimeView Human Gene Expression Array, respectively. Then miRNA and gene expression profiles were integrated by correlation analysis to identify dysregulated miRNAs with their predicted target mRNAs. Microarray data were further validated by real-time PCR. Regulation of zeste homolog 2 (EZH2) expression by hsa-miR-138 was determined by luciferase reporter assay.
Results
We analyzed microRNA expression profile in hippocampal tissues from DS fetal using miRNA microarray. Further with the use of mRNA microarray data, we integrate miRNA expression and mRNA expression in hippocampus of trisomy 21 fetus to elucidate the mechanism that underlying DS abnormalities. We characterized the repertoire of specific miRNAs involved in hippocampus in trisomy 21 patients, highlighting hsa-miR-138 and hsa-miR-409, in particular the importance of hsa-miR-138, especially the -5p strand. Furthermore, the expression level of predicted target genes of hsa-miR-138-5p in trisomy 21 fetus, including zeste homolog 2 (EZH2) were further confirmed. In addition, luciferase assay indicated that EZH2 was a direct target of hsa-miR-138 in HEK293T cells.
Conclusion
The function of hsa-miR-138-5p and its target EZH2 was involved in hippocampus in DS patients. Our findings provide a clue to study the underlying molecular mechanisms in DS patients, and its potential contribution in improving understanding of intellectual disability development in DS patients.
Electronic supplementary material
The online version of this article (doi:10.1186/s12929-016-0265-0) contains supplementary material, which is available to authorized users.
Keywords: Down syndrome (DS), Hippocampus, Intellectual disability
Background
Down syndrome (DS), or trisomy 21 [MIM: 190685], is a common chromosomal abnormality. This disease is caused by an extra copy of chromosomal 21 and therefore called trisomy. The incidence of DS is about 1:700 births and the incidence increases with high maternal age [1]. There are various phenotypes in DS population, including craniofacial abnormality, learning disabilities, congenital heart disease, leukemia’s, Alzheimer’s disease and a variety of physical features such as slanted eye, abnormal pattern of fingerprint, large tongue [2, 3]. The main neurological deficiency in DS patients is intellectual disability and early onset of Alzheimer’s disease [4]. So far, several genes have been associated with Alzheimer’s disease in DS patients, such as APP [5], BACE2 [6] and PICALM [7]. However, the role of miRNA in intellectual disability of DS patients is largely unknown. Elucidation of neurological deficiency in DS patients will contribute to better understand of this disease.
MicroRNAs (miRNAs) are small single stranded noncoding RNAs. MiRNAs regulate gene expression post-transcriptionally via binding with complementary targets resulting in inhibition of target mRNA translation [8–10]. Increasing evidence indicates that miRNAs play important roles in a large variety of biological processes such as development, differentiation, proliferation and apoptosis [11]. So far, several miRNAs have been implicated in Down syndrome. For example, hsa-miR-155 contributes to reduce the incidence of hypertension in DS patients [12].
Fetal hippocampus consists of Ammon’s horn, dentate gyrus, entorhinal cortex, parasubiculum, presubiculum, and subicular complex. Hippocampus is involved in spatial learning, short-term memory and long-term memory [13]. Opperman et al. have showed the difference protein expression in fetal human brain between DS and control subjects [14]. However, the function of miRNAs in DS is still largely undefined. The study of miRNA on hippocampus of DS patients will shed light on the mechanism that underlying neurological deficiency in DS patients.
In this study, we tried to establish a comprehensive correlation between the miRNA expression and target gene regulation in hippocampus in Down syndrome by integration of miRNA and mRNA expression data. The results implicated that hsa-miR-138 and its targets enhancer of zeste homolog 2 (EZH2) were involved in DS patients and potentially contributed in neurological deficiency in DS patients.
Methods
Sample preparation
Four fetal brains that were diagnosed as trisomy 21 by amniocentesis analysis were obtained at abortions in the pregnancy of 16–20 weeks. The other three were obtained at spontaneous abortions in the pregnancy of 16–20 weeks and were diagnosed as diploid controls. The hippocampus in fetal were quickly dissected out from the surrounding tissues, and then were frozen in liquid nitrogen.
RNA isolation
Total RNA of fetal hippocampal tissues of DS (n = 4) and diploid controls (n = 3) was extracted respectively using the Trizol reagent (Invitrogen) according to manufacture’s protocol as we published previously [15].
MiRNA microarray analysis
Total RNA of DS (n = 3) and diploid controls (n = 3) was purified by mirVana miRNA Isolation Kit (Ambion). The miRNA expression profiles were generated by using the Affymetrix GeneChip miRNA Array v. 4.0 (Affymetrix). Briefly, the flashTag Biotin RNA Labeling Kit (Affymetrix) was used to label of 1 μg of total RNA, followed by the hybridization overnight according to the manufacturer’s instructions. After washed and stained using the Affymetrix GeneChip Hybridization Wash and Stain Kit, the miRNA chips were then scanned with the Affymetrix GeneChip Scanner 3000 (Affymetrix).
mRNA microarray analysis
Total RNA (0.1 μg) of DS (n = 3) and diploid controls (n = 3) was employed for the expression analysis with PrimeView Human Gene Expression Array (Affymetrix). RNA was labeled by biotin using the GeneChip 3′ IVT labeling kit (Affymetrix). After hybridization overnight, the chips were washed and stained by GeneChip Hybridization, wash, and stain Kit (Affymetrix) according to the manufacturer’s protocols. The hybridized chips were scanned by GeneChip Scanner 3000.
Microarray expression data Analysis
The CEL-files of the raw data were obtained by Affymetrix GeneChip Command Console Software (Affymetrix). SAM (significance analysis of microarray) with the R package was used to identify differentially expressed miRNA and gene probe sets between DS fetal hippocampus and controls. Probe sets were considered as biologically significant if the fold changes (FC) are over 2 or less than 0.05 and a false discovery rate (FDR) < 0.05.
Prediction of target mRNAs of miRNAs
We predicted the target mRNAs of the miRNA using the bioinformatics prediction tool including miRWalk, miRanda, miRDB, RNA, DIANAmT, RNAhybrid, PICTAR4, PICTAR5, PITA, RNA22 and TargetScan. The selection criteria is correlation > 0.99 or correlation < −0.99, and p value < 0.05.
Detection of miRNA expression with real-time PCR
Total RNA of DS (n = 4) and diploid controls (n = 3) was extracted respectively by Trizol reagent, followed by purification by mirVana miRNA Isolation Kit, and then was reversely transcribed into cDNA by M-MLV Reverse Transcriptase (Invitrogen). Real-time PCR was carried out using SYBR Green master mix (Applied Biosystems) according to the manufacturer’s instructions on a 7500 Fast Real-Time PCR system (Applied Biosystems) and analyzed with the SDS analysis software package (version 2.0.1, Applied Biosystems). Samples were analyzed in triplicate and all the PCR primers were purchased from Invitrogen (Table 1). The U6 snRNA was used as the internal standard control.
Table 1.
Primer pairs used for quantitative real-time PCR
| Name | Sequence (5′- 3′) |
|---|---|
| MiRNA Universal Primer | GTGCAGGGTCCGAGGT |
| hsa-miR-138-5p-RT | GTCGTATCCAGTGCAGGGTCCGAGG |
| TATTCGCACTGGATACGACcggcct | |
| hsa-miR-138-5p-AS | GCATAGCTGGTGTTGTGAATCAG |
| hsa-miR-409-5p-RT | GTCGTATCCAGTGCAGGGTCCGAGG |
| TATTCGCACTGGATACGACatgcaa | |
| hsa-miR-409-5p-AS | TCAGGTTACCCGAGCAACTTT |
| hsa-miR-19-3p-RT | GTCGTATCCAGTGCAGGGTCCGAGG |
| TATTCGCACTGGATACGACtcagtt | |
| hsa-miR-19-3p-AS | GCTGTGCAAATCCATTCAA |
| hsa-miR-204-5p-RT | GTCGTATCCAGTGCAGGGTCCGAGG |
| TATTCGCACTGGATACGACaggcat | |
| hsa-miR-204-5p-AS | GCTTCCCTTTGTCATCCT |
| U6 Fw | CTCGCTTCGGCAGCACA |
| U6 Re | AACGCTTCACGAATTTGCGT |
| MAML1 Fw | TCCTCACTTGCTGCAGTGTC |
| MAML1 Re | CTCCCCTGACTCCCGAAAAC |
| NNAT Fw | GGCCGTATCATCAGGTGCTC |
| NNAT Re | TCTACTGGCCCCTCACTGAC |
| SOX11 Fw | TAGCCACTCCAGGTTTGGGA |
| SOX11 Re | CTGTTTCACAGCAATAGGCCG |
| EZH2 Fw | CCATCCAGACTGGCGAAGAG |
| EZH2 Re | AGGCAGCTGTTTCAGAGGAG |
| VEZF1 Fw | GCCTCAACTGACAGAGGAGAAG |
| VEZF1 Re | TCCAAAGTACTCCTTGGCTCC |
| ITGB3BP Fw | ACCAACTTCTGCATCTGCCT |
| ITGB3BP Re | TAGACATGCACCTGCCAACT |
| CBX2 Fw | CAAGTGCCGTCACTGGGAA |
| CBX2 Re | CGTCAGAAGTGCCAGATACCTA |
| EFNB1 Fw | TGTGCACTTTGACCCCAGTT |
| EFNB1 Re | GTGGAGGTGGATGGTGTGAG |
| SMARCC1 Fw | CTGGAATACGGGAACCGAGG |
| SMARCC1 Re | TTGTCAAAAGGCACTGGGGT |
| PCP4 Fw | ATGAGTGAGCGACAAGGTG |
| PCP4 Re | TTCAGGTGGACTAGGAGGG |
| C2CD2 Fw | GAAGACTCCCATCAAGGTG |
| C2CD2 Re | GATCCCTGATATGATAATAGTGC |
| APP Fw | CCGACCGAGGACTGACCACT |
| APP Re | TGACAACACCGCCCACCAT |
| MX1 Fw | GGTCAGTTACCAGGACTACGA |
| MX1 Re | GTTATGCCAGGAAGGTCTATT |
| PDXK Fw | TTGTGCAGGAGCTGAAGCA |
| PDXK Re | GGTTGGGCGTGATAATGTCT |
| AGPAT3 Fw | TCTACGGGAAGAAGTACGAGG |
| AGPAT3 Re | GACAGGAAGTTCAGGAGGGT |
| GAPDH Fw | CATGTACGTTGCTATCCAGGC |
| GAPDH Re | CTCCTTAATGTCACGCACGAT |
RT Reverse transcript primer, AS anti-sense primer, Fw forward primer, Re reverse primer
Detection of mRNA expression with real-time PCR
The real-time PCR to detect mRNA expression was carried out as we published previously [15]. Briefly, the total RNA of DS (n = 4) and diploid controls (n = 3) was respectively transcribed by M-MLV Reverse Transcriptase (Invitrogen), real-time PCR was run in a final reaction volume of 20 μl by SYBR Green master mix (Applied Biosystems) on the Applied Biosystems 7500 Fast Real-Time PCR System. All samples were analyzed in triplicate and all the PCR primers were ordered from Invitrogen (Table 1). GAPDH served as the reference.
Real-time PCR results analysis
Real-time PCR results were calculated using the 2-ΔΔCt method. The ratio of expression in DS hippocampal tissues relative to the control tissues more than 1.0 was considered as obvious increased and less than 1.0 was considered as decreased.
Plasmid construction and Luciferase reporter assay
The 3′UTR of EZH2 was amplified by PCR from genomic DNA of HEK293T cells with the following primers: Forward: 5′ AGGTCTAGACCTCTGAAACAGCTGCCTTA 3′ and Reverse: 5′ CCTGAGCTCGCATTATTGCAAAAATTCAC 3′. The 3′UTR was cloned downstream of the luciferase coding sequence in the pMIR-REPORT Luciferase vector (Promega). The construct was confirmed by sequencing. Hsa-miR-138 mimics and none-target control were purchased from GenePharma. And the sequence are as follows: hsa-miR-138 mimics, Forward: 5′AGCUGGUGUUGUGAAUCAGGCCG 3′and Reverse: 5′GCCUGAUUCACAACACCAGCUUU 3′; none-target control, Forward: 5′ UUCUCCGAACGUGUCACGUTT 3′and Reverse: 5′ ACGUGACACGUUCGGAGAATT 3′.
HEK293T cells were plated in 24-well dishes overnight before transfection. Hsa-miR-138 mimics or none-target control was transfected into HEK293T cells as well as 200 ng of pMIR-REPORT-EZH2 and 20 ng of pRL-renilla by lipofectmine 2000 (Invitrogen). Medium was changed 6 h later. After 48 h, luciferase assay was performed with dual-luciferase reporter assay systems (Promega) according to the manufacturer’s instructions. Measurements were carried out in triplicates and expressed as mean ± SD. Three independent transfection experiments were performed.
Statistics analysis
Statistical analysis was performed using SPSS 13.0 software. The values are presented as mean ± SD. The differences between two groups were calculated by Student’s t-test. P < 0.05 was considered as statistically significant difference.
Results
Differentially expressed miRNAs in DS group versus control group
MiRNA expression profiles were compared between DS group and control group. Of all the miRNAs measured, seventy-two mature miRNAs that were significantly up-regulated with fold changes over than 2, and five down-regulated were identified in DS group versus control group (Additional file 1: Table S1). The hierarchical cluster of all covered mature miRNAs was showed in Fig. 1.
Fig. 1.
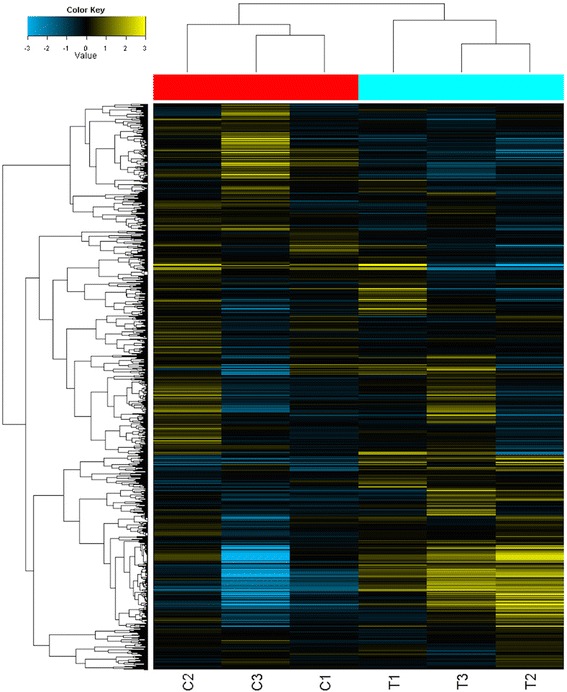
Hierarchical clustering of DS fetal samples and control samples. Hierarchical clustering of all covered human mature miRNAs. Samples are shown in the columns and miRNAs in the rows. The boxes in color indicate the log2 intensities of the miRNAs, with blue indicating low expression and yellow indicating high expression
Differentially expressed mRNAs in DS group versus control group
In order to identify potential targets of the changed miRNAs, the mRNA expression profile of the same hippocampal tissues also was investigated with Affymetrix microarray. The results showed that 1160 mRNA were significantly increased and 994 mRNA were significantly decreased in DS group. And 51 up-regulated mRNA were from chromosome 21 (Table 2). Cluster analysis of top 40 probe sets encoding mRNAs with the highest variation in expression across the 6 samples showed two major clusters (Fig. 2). And cluster analysis of all the differentially expressed mRNA was shown in Additional file 2: Figure S1.
Table 2.
The increased mRNA located on chromosome 21
| Gene symbol | Fold change | P value (%) |
|---|---|---|
| MX1 | 7.3078 | 0.827529807 |
| PCP4 | 7.2605 | 0.899717682 |
| S100B | 6.5814 | 3.469117486 |
| SAMSN1 | 5.4615 | 2.683368388 |
| OLIG1 | 5.408 | 4.532988776 |
| C2CD2 | 4.2167 | 0.146064819 |
| C21orf33 | 4.0585 | 0.146064819 |
| SH3BGR | 3.5808 | 1.597151208 |
| APP | 3.5603 | 3.469117486 |
| TMEM50B | 3.5265 | 0.377152444 |
| AGPAT3 | 3.2927 | 0.961462767 |
| C21orf88 | 3.2137 | 2.088087924 |
| PDXK | 3.0927 | 2.332542808 |
| HLCS | 2.8104 | 1.909735373 |
| BRWD1 | 2.6731 | 2.295354625 |
| OLIG2 | 2.6037 | 4.632689187 |
| SMIM11 | 2.5938 | 0.805146516 |
| WRB | 2.5279 | 1.788040099 |
| NCAM2 | 2.5126 | 2.583461784 |
| PTTG1IP | 2.5087 | 0.146064819 |
| PIGP | 2.399 | 0.408886954 |
| SYNJ1 | 2.3636 | 0.986344775 |
| ERG | 2.2802 | 4.111356376 |
| CXADR | 2.269 | 3.664851129 |
| CBR1 | 2.2509 | 0.986344775 |
| IFNAR1 | 2.1416 | 0.794175289 |
| TIAM1 | 2.1345 | 0.843185443 |
| SUMO3 | 2.1021 | 1.188403617 |
| ADARB1 | 2.0513 | 4.931606353 |
| PSMG1 | 2.0493 | 2.426143122 |
Fig. 2.
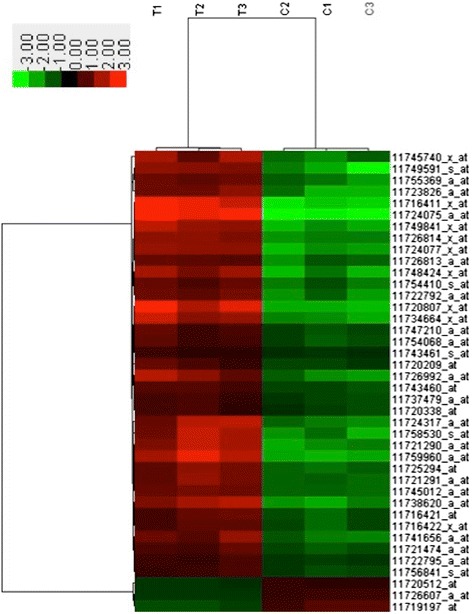
Heatmap of mRNA expression in fetal hippocampus of DS fetal cohorts and control cohorts. Hierarchical clustering of all samples based on the log2 expression values of the top 40 most variable mRNAs. Samples are shown in the columns and mRNAs in the rows. The boxes in color indicate the log2 intensities of the mRNAs, with green indicating low expression and red indicating high expression
The GO-enrichment analysis was used to illustrate the biological functions to the putative target mRNAs. The target genes are predominantly involved in the biological functions including cell cycle, meiosis, gap junction, fructose and mannose metabolism and alanine, aspartate and glutamate metabolism (Table 3).
Table 3.
15 pathways significantly influenced by differentially expressed RNAs
| KEGG pathway | Genes | P value |
|---|---|---|
| Cell cycle | 428 | 9.4362E-09 |
| Cell cycle - yeast | 278 | 1.55857E-08 |
| Gap junction | 304 | 4.49918E-08 |
| Oocyte meiosis | 472 | 2.65787E-06 |
| Progesterone-mediated oocyte maturation | 346 | 4.63607E-05 |
| Long-term depression | 269 | 5.33789E-05 |
| Prion diseases | 134 | 0.000130518 |
| Salivary secretion | 409 | 0.000200115 |
| Melanoma | 249 | 0.000274233 |
| Wnt signaling pathway | 679 | 0.000387352 |
| p53 signaling pathway | 274 | 0.000446442 |
| Fructose and mannose metabolism | 124 | 0.001832756 |
| Meiosis - yeast | 259 | 0.002555986 |
| Bacterial invasion of epithelial cells | 440 | 0.002752716 |
| Alanine, aspartate and glutamate metabolism | 101 | 0.002969861 |
Genes number of genes involved in the KEGG pathway
Correlation between expression levels of significantly differentially expressed miRNAs and their predicted targets mRNAs
In order to identify target mRNAs of one or more of the differentially expressed miRNAs that are potentially related with DS fetal neurological deficiency, we applied two criteria, 1) the target mRNAs should be differentially co-expressed together with the altered miRNAs in DS fetal hippocampal tissues; and 2) the target mRNA should display an inverse expression correlation with the miRNA. Total 995 pairs of significantly altered miRNAs and predicted target mRNAs fulfilled the criteria in DS fetal group versus controls. Functional analysis indicated that the gene list was significantly enriched in regulation of transcription (Fig. 3). The proportion of significantly altered miRNAs that involved in predicted miRNA-target mRNAs pairs was shown in Fig. 4. The top 10 miRNA - target mRNA pairs that have the largest number of predicted results in prediction tools were listed in Table 4. Among them, seven of the top 10 miRNA-target mRNA pairs are related to hsa-miR-138. Cytoscape software suggested that hsa-miR-138 has the largest number of mRNA neighbors. This miRNA was chosen to validate microarray results by real time-PCR, along with its predicted target mRNAs: MAML1, NNAT, VEZF1, ITGB3BP, SOX11, EZH2 and CBX2. Of all miRNA-mRNA pairs, we also selected hsa-miR-409-5p, which played roles in cell proliferation and apoptosis [16], along with its predicted target genes, SMARCC1 and EFNB1, and another two miRNAs, hsa-miR-19-3p and hsa-miR-204-5p to validate the microarray results.
Fig. 3.
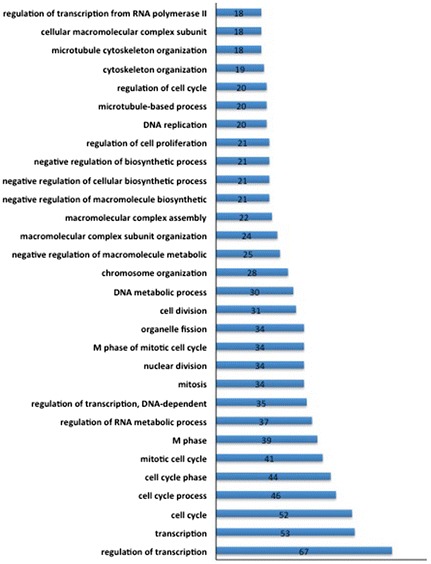
Enrichment of biological processes in term of Gene Ontology categories with predicted miRNA-mRNA pairs. A number of biological processes were enrichment with predicted miRNA-mRNA pairs. The number of genes in each GO category is indicated within the plot
Fig. 4.
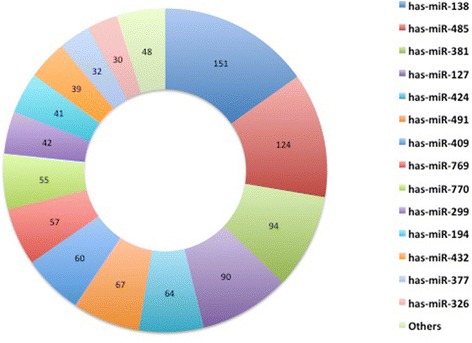
The proportion of miRNAs that involved in predicted miRNA-mRNA pairs. The number of predicted miRNA-mRNA pairs of each miRNA was indicated within the plot. Hsa-miR-138 had the maximum predicted target mRNAs among all the pairs
Table 4.
Top 10 most significantly correlated miRNA-mRNA pairs
| MiRNAs | Predicated target | Correlation | P. value | SUM |
|---|---|---|---|---|
| hsa-miR-138 | EZH2 | −1 | 0.002777778 | 9 |
| hsa-miR-138 | DVL2 | −1 | 0.002777778 | 7 |
| hsa-miR-485-3p | TRIM24 | −1 | 0.002777778 | 7 |
| hsa-miR-138 | ARRDC3 | −1 | 0.002777778 | 7 |
| hsa-miR-138 | DVL2 | −1 | 0.002777778 | 7 |
| hsa-miR-138 | NNAT | −1 | 0.002777778 | 7 |
| hsa-miR-138 | VEZF1 | −1 | 0.002777778 | 7 |
| hsa-miR-770-5p | BTG1 | −1 | 0.002777778 | 7 |
| hsa-miR-138 | NNAT | −1 | 0.002777778 | 7 |
| hsa-miR-770-5p | BTG1 | −1 | 0.002777778 | 7 |
SUM The total of predicated miRNA-mRNA pairs in ten different prediction tools
Validation of the microarray expression data by real-time PCR
Based on the correlation analysis of miRNA and mRNA expression, the significance levels of miRNA and mRNA microarray data and previous literature, four miRNAs and 15 mRNAs, including MAML1, NNAT, VEZF1, ITGB3BP, SOX11, EZH2, EFNB1, CBX2, SMARCC1, PCP4, C2CD2, APP, MX1, PDXK and AGPAT3 were chosen to confirm their altered expression in DS fetal compared to controls by real-time PCR. Consistent with the microarray data, real-time PCR confirmed that hsa-miR-138 and hsa-miR-409-5p were significantly increased, hsa-miR-19-3p and hsa-miR-204-5p were decreased in DS fetal hippocampal tissues compared with controls. Relative expression levels of the selected miRNAs are depicted in Fig. 5. In line with our microarray data, expression of MAML1, NNAT, VEZF1, ITGB3BP, SOX11, EZH2, EFNB1, CBX2, SMARCC1 was significantly decreased in DS fetal compared to controls (Fig. 6). The expression of MX1, APP, AGPAT3 and PDXK that located on chromosome 21 were increased in DS group vs. control group (Fig. 7), thereby confirming results of previous studies published elsewhere [17]. Consistent with the microarray data, PCP4 and C2CD2, were also increased in DS group (Fig. 7).
Fig. 5.
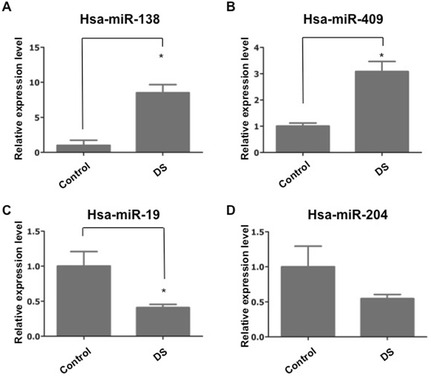
miRNA expression level was examined by real-time PCR. The expression of hsa-miR-138 (a), hsa-miR-409 (b), hsa-miR-19 (c) and hsa-miR-204 (d) were tested in fetal hippocampus tissues of DS and control group. The expression of hsa-miR-138 and hsa-miR-409 were obviously increased in DS group compared to control group. The expression of hsa-miR-19 and hsa-miR-204 were reduced in DS group compared to control group. The expression of hsa-miR-138, hsa-miR-409 and hsa-miR-19 showed significant difference between two groups. The miRNAs expression was normalized to U6 expression. The asterisks indicate the statistically significant difference
Fig. 6.
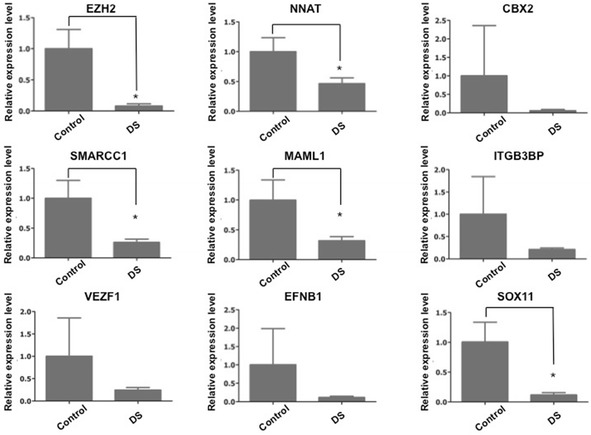
The predicted targets of hsa-miR-138 and hsa-miR-409 were reduced examined by real-time PCR. The selected mRNA level was tested in fetal hippocampus tissues of DS and control group. All the selected mRNA was reduced in DS group compared to control group. The mRNAs expression was normalized to GAPDH. The expression of EZH2, NNAT, SMARCC1, MAML1 and SOX11 showed significant difference between two groups. The asterisks indicate the statistically significant difference
Fig. 7.
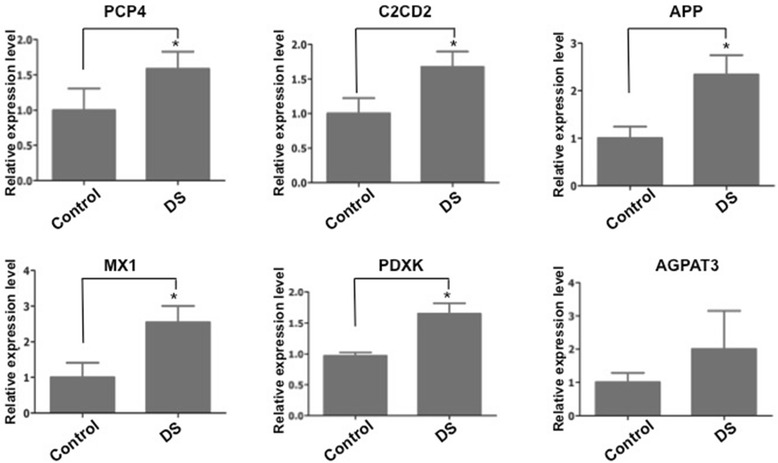
mRNA expression level was examined by real-time PCR. The selected mRNA located on chromosome 21, including MX1, APP, AGPAT3 and PDXK, were increased in DS group compared to control group. The mRNAs expression was normalized to GAPDH. PCP4 and C2CD2 were also increased in DS group. The expression of MX1, APP, PDXK, PCP4 and C2CD2 showed significant difference between two groups. The asterisks indicate the statistically significant difference
EZH2 is a direct target of hsa-miR-138
EZH2 had a pupative hsa-miR-138 binding site with its 3′UTR. To test whether EZH2 was a direct target of hsa-miR-138, a construct of 3′UTR of EZH2 fused downstream of the firefly luciferase gene was generated. pMIR-REPORT-EZH2 3′ UTR was transfected with hsa-miR-138 mimics or none-target control together into HEK293T cells. The results showed that hsa-miR-138 overexpression reduced the EZH2 3′UTR luciferase reporter activity compared to none-target control transfected group (Fig. 8a). In addition, real-time PCR analysis showed that hsa-miR-138 overexpression significantly decreased EZH2 mRNA level in HEK293T cells (Fig. 8b). These results indicated that EZH2 was a direct target of hsa-miR-138 in HEK293T cells.
Fig. 8.
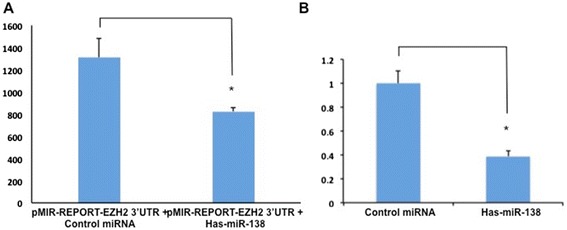
Hsa-miR-138 downregulated EZH2 by interacting with its 3′UTR. a The pMIR-REPORT-EZH2 3′ UTR was cotransfected into HEK293T cells with hsa-miR-138 mimics or none-target control. b the expression of EZH2 mRNA was tested by real-time PCR. GAPDH was served as an internal control
Discussion
Down syndrome is one of the most common chromosomal abnormalities among live born infants. The major neurological deficits that afflict DS individuals are intellectual disability and the early onset of Alzheimer’s disease [4]. Numerous abnormalities in the DS nervous system have been reported. In nervous system, the onset of Alzheimer’s disease has been intensively studied, while the mechanisms of intellectual disability in DS patients have not been well elucidated. The goal of our study was to establish a comprehensive picture of miRNA-mRNA network that could cause neurological deficiency especially intellectual disability in fetal Down syndrome. To our best knowledge, this study is the first whole-genome miRNA and mRNA expression microarray profiling in hippocampal tissues of human fetal Down syndrome, will therefore provide a clue to study the mechanisms of neurological deficiency occurred in DS patients.
MicroRNAs are known to regulate the expression of genes post-transcriptionally. They are involved in a wide range of biological processes, such as proliferation, apoptosis, tumor development, stress response etc. In our study, the differentially expressed miRNAs in hippocampus of DS fetal suggested an association with DS neurological problems. Based on the amplified developmental instability hypothesis [18] of DS that a number of trisomic genes result in a genetic imbalance, we assumed that these differentially expressed miRNAs participated in the complicated genetic imbalance in DS patients. Correlation analysis between miRNA and the predicted target mRNA expression levels showed that hsa-miR-138 were involved most frequently in significantly inversely correlated miRNA-target mRNA pairs. The hsa-miR-138 has been previously demonstrated to have essential roles in tumor suppression. It was down-regulated in various cancers [19, 20]. In this research, we found that hsa-miR-138 is up-regulated in hippocampus from DS fetal. The function of hsa-miR-138 in cell proliferation and cell apoptosis may affect the normal development of hippocampus. In our study, the expression of hsa-miR-155 and let-7c that from chromosome 21 also were increased in DS group. But there was no significant difference between two groups, which is probably due to the small sample size and sample variability.
The EZH2 protein is the catalytic core protein in the Polycomb group (PcG) repressive complex 2 (PRC2), which are involved in epigenetic regulation of gene expression. EZH2 plays important roles in the progress of cell fate decision, cell cycle regulation, senescence, cell differentiation and cancer. EZH2, has highly conserved putative hsa-miR-138 binding site within its 3′UTR, has been proved as one of directly targets of hsa-miR-138 [21]. The functional role of EZH2 has already been studied extensively. In animal model, it was shown that EZH2, which formed a PcG complex with EED (embryonic ectoderm development), could induce an ectopic neural axis in neural induction [22]. The mutation of EZH2 were related to primary central nervous system lymphoma [23]. Moreover, muted EZH2 led to Weaver Syndrome that had intellectual disability as one of its common features [24]. In this research, EZH2 is downregulated in hippocampal tissues in DS versus control samples, which implied that EZH2 also play roles in neurological deficiency of DS especially in intellectual disability.
Amyloid beta/A4 precursor protein (APP) has been shown essential roles in Alzheimer’s disease (AD) [25, 26] and in autism [27]. In this research, APP was up-regulated that implied its potential role in Down Syndrome.
In this research, we focused on the miRNA and its predicted mRNA in hippocampus of DS. There are some limitations to our study. Firstly, we used a relatively small sample size. Microarray analysis was performed using the RNA extracted from three samples in each group, and the validation experiments were performed using four samples in DS group and three samples in control group. However, significant differences could be identified in gene expression. Secondly, correlation analysis suggested a highly significant negative correlation between expression levels of hsa-miR-138 and its potential target mRNAs of interest. We need to further determine whether these mRNAs are targeted by endogenous miRNAs in hippocampus. Nevertheless, our data provide a clue regarding hsa-miR-138 and its targets EZH2 are associated with neurological deficiency in DS. Further analysis of our microarray data will help us to understand the mechanism of neurological deficiency in DS patients.
Conclusion
This research represents an integrated analysis of miRNA and mRNA expression in hippocampus of DS fetal. We identified a number of differentially expressed miRNA and its predicted mRNA, including hsa-miR-138 and its target EZH2. It is presumed that hsa-miR-138 and EZH2 could be involved in neurological deficiency of DS patients. It will help better understand intellectual disability development in DS. While the mechanisms as to how hsa-miR-138 targets EZH to play roles in DS needs to be further studied.
Abbreviations
DS, down syndrome; EED, embryonic ectoderm development; EZH2, zeste homolog 2; MiRNAs, miRNAs; PcG, Polycomb group; PRC2, Polycomb group repressive complex 2
Acknowledgements
We wish to thank all the members in our lab for their discussions on this project. This work is supported by grants from Natural Science Foundation of China 81170581 (SXL) and 81450018 (SXL), and a grant of Science and Technology Development Program of Henan Science and Technology Department 1224 (SXL).
Authors’ contributions
SXL designed and funded the project. WLS, ZZL, HDW, DW, HZ, HX, YC and QFH conducted the experiments and analyzed the data. WLS wrote the manuscript. All authors read and approved the final manuscript.
Competing interests
The authors declare that they have no competing interests.
Ethics approval and consent to participate
Ethical approval was obtained from the Ethics Committee of Henan Provincial People’s Hospital, China. All pregnant women involved in this study agreed to the research plan and signed the written consent document to store the samples and to use medical outcome data for the purpose of the study.
Additional files
List of differentially expressed miRNA in DS group versus control group by microarray assay. Red indicates increased expression of miRNA and green indicates decreased expression of miRNA in DS group versus control group. (XLSX 102 kb)
Heatmap of mRNA expression in fetal hippocampus of DS fetal cohorts and control cohorts. Hierarchical clustering of all samples based on the log2 expression values of all differentially expressed mRNAs. Samples are shown in the columns and mRNAs in the rows. The boxes in color indicate the log2 intensities of the mRNAs, with green indicating low expression and red indicating high expression. (JPG 455 kb)
References
- 1.Carothers AD, Hecht CA, Hook EB. International variation in reported livebirth prevalence rates of Down syndrome, adjusted for maternal age. J Med Genet. 1999;36(5):386–93. [PMC free article] [PubMed] [Google Scholar]
- 2.Sinet PM, Theophile D, Rahmani Z, Chettouh Z, Blouin JL, Prieur M, et al. Mapping of the Down syndrome phenotype on chromosome 21 at the molecular level. Biomed Pharmacother. 1994;48(5–6):247–52. doi: 10.1016/0753-3322(94)90140-6. [DOI] [PubMed] [Google Scholar]
- 3.Gardiner KJ. Molecular basis of pharmacotherapies for cognition in Down syndrome. Trends Pharmacol Sci. 2010;31(2):66–73. doi: 10.1016/j.tips.2009.10.010. [DOI] [PMC free article] [PubMed] [Google Scholar]
- 4.Wisniewski KE, Dalton AJ, McLachlan C, Wen GY, Wisniewski HM. Alzheimer’s disease in Down’s syndrome: clinicopathologic studies. Neurology. 1985;35(7):957–61. doi: 10.1212/WNL.35.7.957. [DOI] [PubMed] [Google Scholar]
- 5.Jones EL, Ballard CG, Prasher VP, Arno M, Tyrer S, Moore B, et al. An Intron 7 Polymorphism in APP Affects the Age of Onset of Dementia in Down Syndrome. Int J Alzheimers Dis. 2010;2011:929102. doi: 10.4061/2011/929102. [DOI] [PMC free article] [PubMed] [Google Scholar]
- 6.Myllykangas L, Wavrant-De Vrieze F, Polvikoski T, Notkola IL, Sulkava R, Niinisto L, et al. Chromosome 21 BACE2 haplotype associates with Alzheimer’s disease: a two-stage study. J Neurol Sci. 2005;236(1–2):17–24. doi: 10.1016/j.jns.2005.04.008. [DOI] [PubMed] [Google Scholar]
- 7.Jones EL, Mok K, Hanney M, Harold D, Sims R, Williams J, et al. Evidence that PICALM affects age at onset of Alzheimer’s dementia in Down syndrome. Neurobiol Aging. 2013;34(10):2441. doi: 10.1016/j.neurobiolaging.2013.03.018. [DOI] [PMC free article] [PubMed] [Google Scholar]
- 8.Ambros V. The functions of animal microRNAs. Nature. 2004;431(7006):350–5. doi: 10.1038/nature02871. [DOI] [PubMed] [Google Scholar]
- 9.Bartel DP. MicroRNAs: genomics, biogenesis, mechanism, and function. Cell. 2004;116(2):281–97. doi: 10.1016/S0092-8674(04)00045-5. [DOI] [PubMed] [Google Scholar]
- 10.He L, Hannon GJ. MicroRNAs: small RNAs with a big role in gene regulation. Nat Rev Genet. 2004;5(7):522–31. doi: 10.1038/nrg1379. [DOI] [PubMed] [Google Scholar]
- 11.Lewis BP, Burge CB, Bartel DP. Conserved seed pairing, often flanked by adenosines, indicates that thousands of human genes are microRNA targets. Cell. 2005;120(1):15–20. doi: 10.1016/j.cell.2004.12.035. [DOI] [PubMed] [Google Scholar]
- 12.Sethupathy P, Borel C, Gagnebin M, Grant GR, Deutsch S, Elton TS, et al. Human microRNA-155 on chromosome 21 differentially interacts with its polymorphic target in the AGTR1 3′ untranslated region: a mechanism for functional single-nucleotide polymorphisms related to phenotypes. Am J Hum Genet. 2007;81(2):405–13. doi: 10.1086/519979. [DOI] [PMC free article] [PubMed] [Google Scholar]
- 13.Hayashi K, Kubo K, Kitazawa A, Nakajima K. Cellular dynamics of neuronal migration in the hippocampus. Front Neurosci. 2015;9:135. doi: 10.3389/fnins.2015.00135. [DOI] [PMC free article] [PubMed] [Google Scholar]
- 14.Oppermann M, Cols N, Nyman T, Helin J, Saarinen J, Byman I, et al. Identification of foetal brain proteins by two-dimensional gel electrophoresis and mass spectrometry comparison of samples from individuals with or without chromosome 21 trisomy. Eur J Biochem. 2000;267(15):4713–9. doi: 10.1046/j.1432-1327.2000.01524.x. [DOI] [PubMed] [Google Scholar]
- 15.Shi W, Xu G, Wang C, Sperber SM, Chen Y, Zhou Q, et al. Heat shock 70-kDa protein 5 (Hspa5) is essential for pronephros formation by mediating retinoic acid signaling. J Biol Chem. 2015;290(1):577–89. doi: 10.1074/jbc.M114.591628. [DOI] [PMC free article] [PubMed] [Google Scholar]
- 16.Li C, Nie H, Wang M, Su L, Li J, Yu B, et al. MicroRNA-409-3p regulates cell proliferation and apoptosis by targeting PHF10 in gastric cancer. Cancer Lett. 2012;320(2):189–97. doi: 10.1016/j.canlet.2012.02.030. [DOI] [PubMed] [Google Scholar]
- 17.Kahlem P, Sultan M, Herwig R, Steinfath M, Balzereit D, Eppens B, et al. Transcript level alterations reflect gene dosage effects across multiple tissues in a mouse model of down syndrome. Genome Res. 2004;14(7):1258–67. doi: 10.1101/gr.1951304. [DOI] [PMC free article] [PubMed] [Google Scholar]
- 18.Antonarakis SE, Lyle R, Dermitzakis ET, Reymond A, Deutsch S. Chromosome 21 and down syndrome: from genomics to pathophysiology. Nat Rev Genet. 2004;5(10):725–38. doi: 10.1038/nrg1448. [DOI] [PubMed] [Google Scholar]
- 19.Liang J, Zhang Y, Jiang G, Liu Z, Xiang W, Chen X, et al. MiR-138 induces renal carcinoma cell senescence by targeting EZH2 and is downregulated in human clear cell renal cell carcinoma. Oncol Res. 2013;21(2):83–91. doi: 10.3727/096504013X13775486749218. [DOI] [PubMed] [Google Scholar]
- 20.Qiu S, Huang D, Yin D, Li F, Li X, Kung HF, et al. Suppression of tumorigenicity by microRNA-138 through inhibition of EZH2-CDK4/6-pRb-E2F1 signal loop in glioblastoma multiforme. Biochim Biophys Acta. 2013;1832(10):1697–707. doi: 10.1016/j.bbadis.2013.05.015. [DOI] [PubMed] [Google Scholar]
- 21.Zhang H, Zhang H, Zhao M, Lv Z, Zhang X, Qin X, et al. MiR-138 inhibits tumor growth through repression of EZH2 in non-small cell lung cancer. Cell Physiol Biochem. 2013;31(1):56–65. doi: 10.1159/000343349. [DOI] [PubMed] [Google Scholar]
- 22.Satijn DP, Hamer KM, den Blaauwen J, Otte AP. The polycomb group protein EED interacts with YY1, and both proteins induce neural tissue in Xenopus embryos. Mol Cell Biol. 2001;21(4):1360–9. doi: 10.1128/MCB.21.4.1360-1369.2001. [DOI] [PMC free article] [PubMed] [Google Scholar]
- 23.Pellissery S, Richter J, Haake A, Montesinos-Rongen M, Deckert M, Siebert R. Somatic mutations altering Tyr641 of EZH2 are rare in primary central nervous system lymphoma. Leuk. Lymphoma. 2010;51(11):2135–6. doi: 10.3109/10428194.2010.510897. [DOI] [PubMed] [Google Scholar]
- 24.Gibson WT, Hood RL, Zhan SH, Bulman DE, Fejes AP, Moore R, et al. Mutations in EZH2 cause Weaver syndrome. Am J Hum Genet. 2012;90(1):110–8. doi: 10.1016/j.ajhg.2011.11.018. [DOI] [PMC free article] [PubMed] [Google Scholar]
- 25.Tagawa K, Maruyama K, Ishiura S. Amyloid beta/A4 precursor protein (APP) processing in lysosomes. Ann N Y Acad Sci. 1992;674:129–37. doi: 10.1111/j.1749-6632.1992.tb27482.x. [DOI] [PubMed] [Google Scholar]
- 26.Small DH, Nurcombe V, Clarris H, Beyreuther K, Masters CL. The role of extracellular matrix in the processing of the amyloid protein precursor of Alzheimer’s disease. Ann N Y Acad Sci. 1993;695:169–74. doi: 10.1111/j.1749-6632.1993.tb23047.x. [DOI] [PubMed] [Google Scholar]
- 27.Fatemi SH, Folsom TD, Kneeland RE, Yousefi MK, Liesch SB, Thuras PD. Impairment of fragile X mental retardation protein-metabotropic glutamate receptor 5 signaling and its downstream cognates ras-related C3 botulinum toxin substrate 1, amyloid beta A4 precursor protein, striatal-enriched protein tyrosine phosphatase, and homer 1, in autism: a postmortem study in cerebellar vermis and superior frontal cortex. Mol Autism. 2013;4(1):21. doi: 10.1186/2040-2392-4-21. [DOI] [PMC free article] [PubMed] [Google Scholar]


