

Abstract
Objective:
To evaluate the combined blood expression of neuromuscular and inflammatory biomarkers as predictors of disease progression and prognosis in amyotrophic lateral sclerosis (ALS).
Methods:
Logistic regression adjusted for markers of the systemic inflammatory state and principal component analysis were carried out on plasma levels of creatine kinase (CK), ferritin, and 11 cytokines measured in 95 patients with ALS and 88 healthy controls. Levels of circulating biomarkers were used to study survival by Cox regression analysis and correlated with disease progression and neurofilament light chain (NfL) levels available from a previous study. Cytokines expression was also tested in blood samples longitudinally collected for up to 4 years from 59 patients with ALS.
Results:
Significantly higher levels of CK, ferritin, tumor necrosis factor (TNF)–α, and interleukin (IL)–1β, IL-2, IL-8, IL-12p70, IL-4, IL-5, IL-10, and IL-13 and lower levels of interferon (IFN)–γ were found in plasma samples from patients with ALS compared to controls. IL-6, TNF-α, and IFN-γ were the most highly regulated markers when all explanatory variables were jointly analyzed. High ferritin and IL-2 levels were predictors of poor survival. IL-5 levels were positively correlated with CK, as was TNF-α with NfL. IL-6 was strongly associated with CRP levels and was the only marker showing increasing expression towards end-stage disease in the longitudinal analysis.
Conclusions:
Neuromuscular pathology in ALS involves the systemic regulation of inflammatory markers mostly active on T-cell immune responses. Disease stratification based on the prognostic value of circulating inflammatory markers could improve clinical trials design in ALS.
Clinical heterogeneity in amyotrophic lateral sclerosis (ALS), a fatal neurodegenerative disorder, encompasses motor and cognitive symptoms and a variable prognostic outlook. The long diagnostic latency in most ALS cases narrows the therapeutic window for disease modification. Early diagnosis and the ability to predict outcomes in ALS would address the unsatisfactory outcome of most clinical trials with the design of more cost-effective studies.1 Current biomarkers-based monitoring tools in ALS are not always suitable for research and routine clinical practice.
The pathologic process in ALS develops in distant anatomical regions either simultaneously or as a sequential process.2 Early ALS pathology is sensed by the innate immune system, with the activation of microglia, T-cells, dendritic, and antigen-presenting cells in corticospinal tracts and in the motor cortex3 and the release of inflammatory markers such as cytokines, C-reactive protein (CRP), and ferritin.4–6
Circulating inflammatory markers and immune cells express the body's inflammatory state, which depends on comorbidities and environmental stressors. The immunologic fingerprint of ALS at a systemic level may not be easily distinguishable, considering the reported strong association of ALS with autoimmune comorbidities such as rheumatoid arthritis.7 Nevertheless, ALS-specific systemic inflammatory signals have already been reported,4–6,8 including a reduced frequency of regulatory T cells (Treg) in blood from individuals with a faster disease progression.9
By adjusting for potential contributors to systemic inflammation,4 we tested to what extent the expression of circulating markers of inflammation and of neuromuscular pathology changes in ALS with reference to control individuals; we have used the same approach for the prognostic stratification of ALS and to test the systemic immune response to disease progression.
METHODS
Standard protocol approvals, registrations, and patient consents.
Ethical approval was obtained from the East London and the City Research Ethics Committee 1 (09/H0703/27). All participants provided written consent (or gave verbal permission for a carer to sign on their behalf).
Participants, sampling, and data collection.
The study included 95 patients with ALS and 88 neurologically healthy controls recruited between 2009 and 2015. Diagnosis of ALS by experienced ALS neurologists (A.M., R.H., R.O., K.S., P.F., N.S., M.F.) was based on consensus criteria.10 Those with a family history of ALS or frontotemporal dementia (FTD), or known to carry a genetic mutation linked to ALS or FTD, were excluded to minimize any potential bias. Neurologically healthy controls were typically spouses and friends of patients.
Serial plasma samples and clinical information were obtained, on average, every 2–4 months from 59 of the 95 patients with ALS, over a maximum follow-up period of 48 months. No selection criteria were applied to patients with ALS sampled longitudinally, other than their willingness to donate further samples. Symptoms onset was defined as first patient-reported weakness or speech impairment. Progression rate was calculated at baseline (PRB) as 48 minus the ALS Functional Rating Scale–Revised (ALSFRS-R) score, divided by the disease duration from symptom onset in months. A PRB of 0.5 was used as cutoff to define slowly progressing (<0.5) and fast progressing ALS (≥0.5). Progression between 2 consecutive visits was assessed using the change in ALSFRS-R score (ΔALSFRS-R) with and without the time interval (ΔALSFRS-R/duration between 2 visits in months).11
Data including demographics, medical history, and treatment were collected at each visit. The presence of hypertension, hyperlipidemia, diabetes, cancer, and cardiac and cerebrovascular accidents as well as prothrombotic states were systematically evaluated at each visit. QRISK2, a cerebrovascular disease risk score, was included in the statistical analyses.12
Sample analysis.
Cytokines.
Plasma samples were processed and aliquoted within 1 hour from collection and frozen at −80°C, following standard consensus procedures.13 A validated multiplex electrochemiluminescence immunoassay was used for the analysis of interferon (IFN)–γ, tumor necrosis factor (TNF)–α, interleukin (IL)–6, IL-1β, IL-2, IL-8, IL-12p70, IL-4, IL-5, IL-10, and IL-13 from patients with ALS and controls in duplicate (Meso Scale Discovery, Rockville, MD). Readouts in the multiplex assay with poor intra-assay coefficient of variation (>20%) were excluded from further analyses.
CRP, creatine kinase (CK), and ferritin.
CRP, ferritin, and CK were measured only at baseline and following the guidelines from the International Federation of Clinical Chemistry. CRP and CK were tested using an immunoturbidimetric assay on a Roche/Cobas (Indianapolis, IN) 702 module. CRP readouts below the laboratory dynamic range were given the lower limit value of 2 mg/L. Ferritin was tested on a Roche/Cobas e602 module, using the Roche ferritin electrochemiluminescence immunoassay.
Statistical analysis.
Continuous variables were summarized using median (interquartile range [IQR]) and their distribution tested using Mann-Whitney U test. Distribution of categorical data was tested using the Fisher exact test.
Baseline analysis of the case-control study included (1) univariate comparison using the Mann-Whitney U test, (2) principal component analysis (PCA) to test combined cytokine effects (log2 transformed data were analyzed using TIGR MeV, TM4, version 4.9), and (3) multivariate logistic regression analysis. Tertiles of distribution of continuous variables calculated on the whole sample14 were introduced in logistic regression models (table e-1 at Neurology.org/nn). Cytokine data with undetectable levels were assigned the midpoint between zero and the limit of detection (LOD; provided by the manufacturer).15 When more than 33% of the samples had measurements below the LOD, all undetectable samples were included in the lowest tertile, while the median of the remaining samples defined the second cutoff point. Logistic regressions included a basic model adjusted for age and sex, a multivariate model adjusted for comorbidities,7,16 and a mutually adjusted model where all the inflammatory markers associated with the outcome with p < 0.2 were simultaneously included (either in a basic or in a multivariate model). Comorbidities included in multivariate models are arthritis, autoimmune pathology, hypertension, diabetes, hyperlipidemia, the use of statin, cardiovascular disease (CVD) risk, and CRP as proxy for general inflammation. This latter mutually adjusted analysis was undertaken excluding subjects with missing data and using redefined tertile ranges (table e-1). Logistic regression was also applied to compare progression rate groups among ALS cases at baseline; tertile ranges were redefined within these ALS cases only (table e-1).
Survival analysis was conducted using Cox regression with tertiles recalculated from ALS cases only. The basic and multivariate statistical models (defined as above) were used to test to what extent each plasma marker predicted survival individually. Basic and multivariate mutually adjusted models were also run.
Correlation between continuous variables was assessed using the Spearman coefficient (ρ), which measures the strength of a monotonic relationship between paired data and varies between −1 (perfect monotonic negative correlation) and 1 (perfect monotonic positive correlation). We examined the association between plasma cytokines and disease progression/stage as well as biological markers of (1) muscle homeostasis (CK), (2) neuroaxonal damage (neurofilament light chain [NfL]; baseline data from 66 out of 95 of the patients with ALS were available from a previous study17), and (3) other inflammatory markers (ferritin and CRP).
Data collected from the 59 patients with ALS serially sampled were used for the longitudinal analysis of the 11-cytokines panel. A Kruskal-Wallis test was used to compare expression data obtained at baseline (V1) and at follow-up visits (V2–V6). Intervisit progression (e.g., V1 and V2, V2, and V3), as described in a previous study,11 was defined as (1) the change of ALSFRS-R score between visits (ΔALSFRS-R) and (2) the slope of ALSFRS-R (ΔALSFRS-R/time between 2 visits in months). The cytokine levels at early visit (in each visit pair) were correlated with the intervisit progression calculated from the same visit pair (Spearman). Intervisit progression for CRP, CK, and ferritin was calculated only between V1 and V2.
Statistical analysis was performed using SPSS (version 22; IBM, Armonk, NY) and GraphPad Prism Software (GraphPad Software, La Jolla, CA; version 6). Unless otherwise specified, a p value less than 0.05 was considered statistically significant.
RESULTS
Case-control analysis.
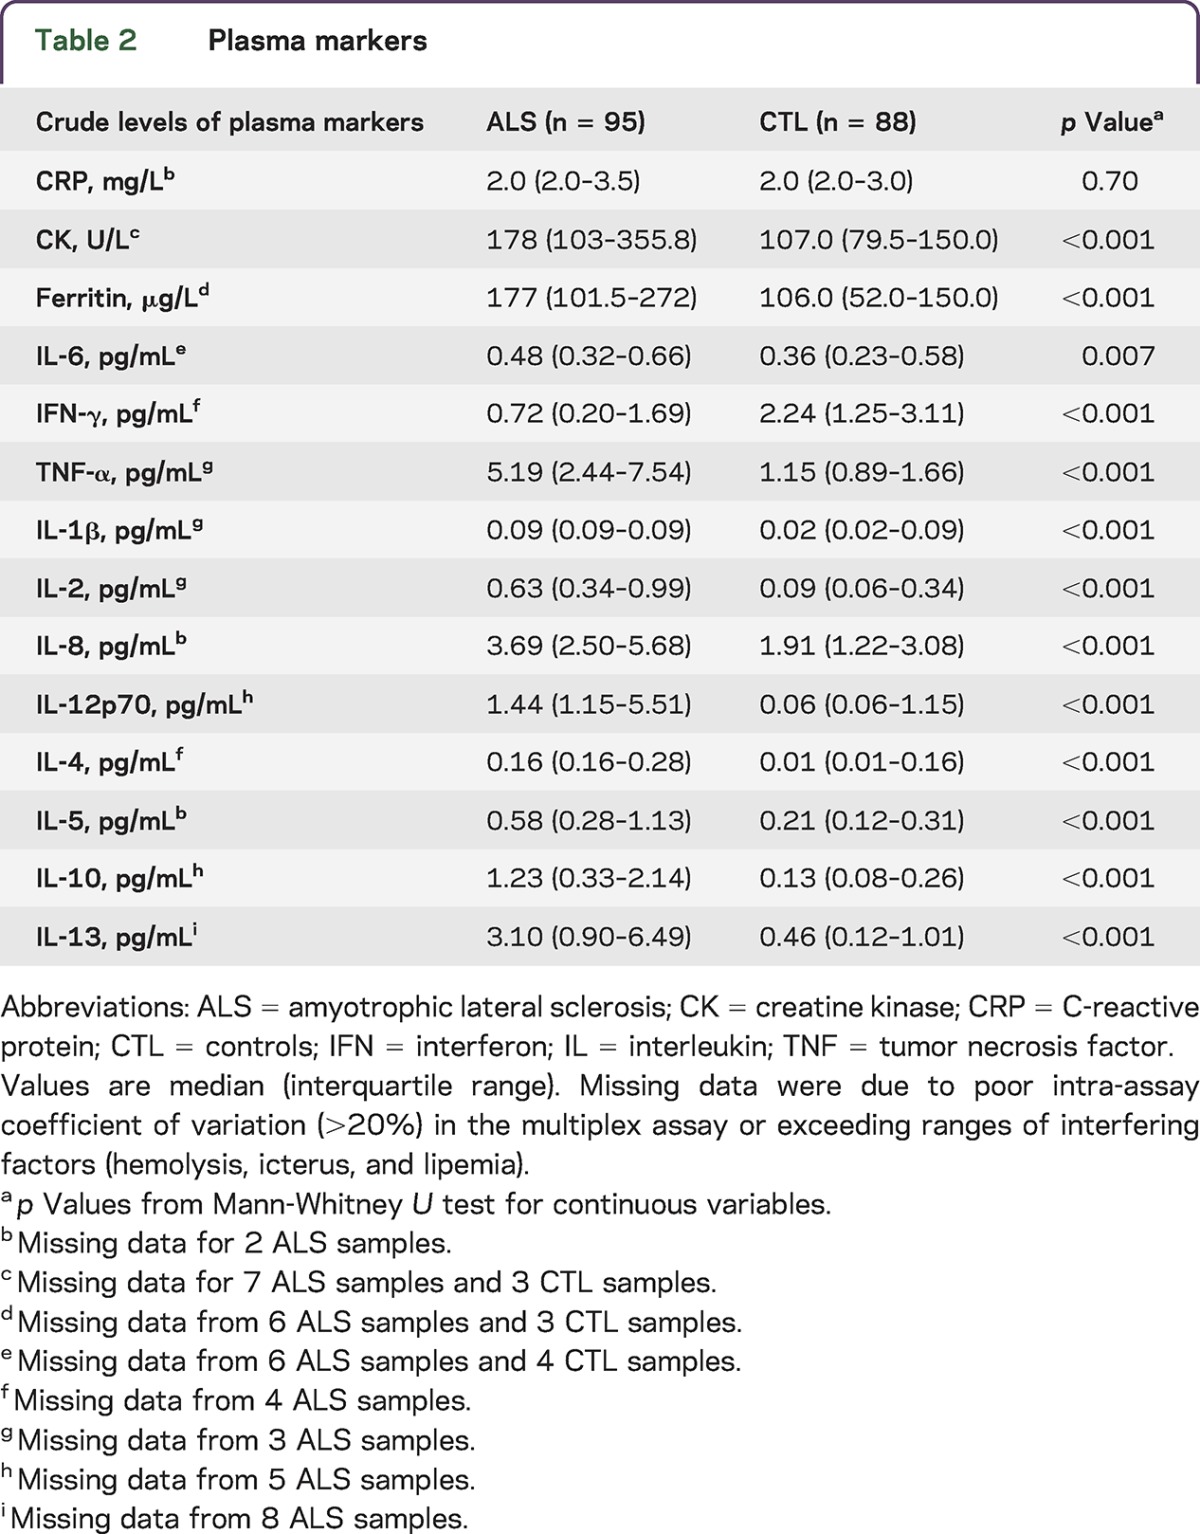
Medical history, demographic data, and levels of the plasma markers are presented in tables 1 and 2. Patients with ALS were older and predominantly male compared to controls; hyperlipidemia was more prevalent in controls. Patients with ALS had a higher CVD risk.
Table 1.
Demographic and clinical characteristics
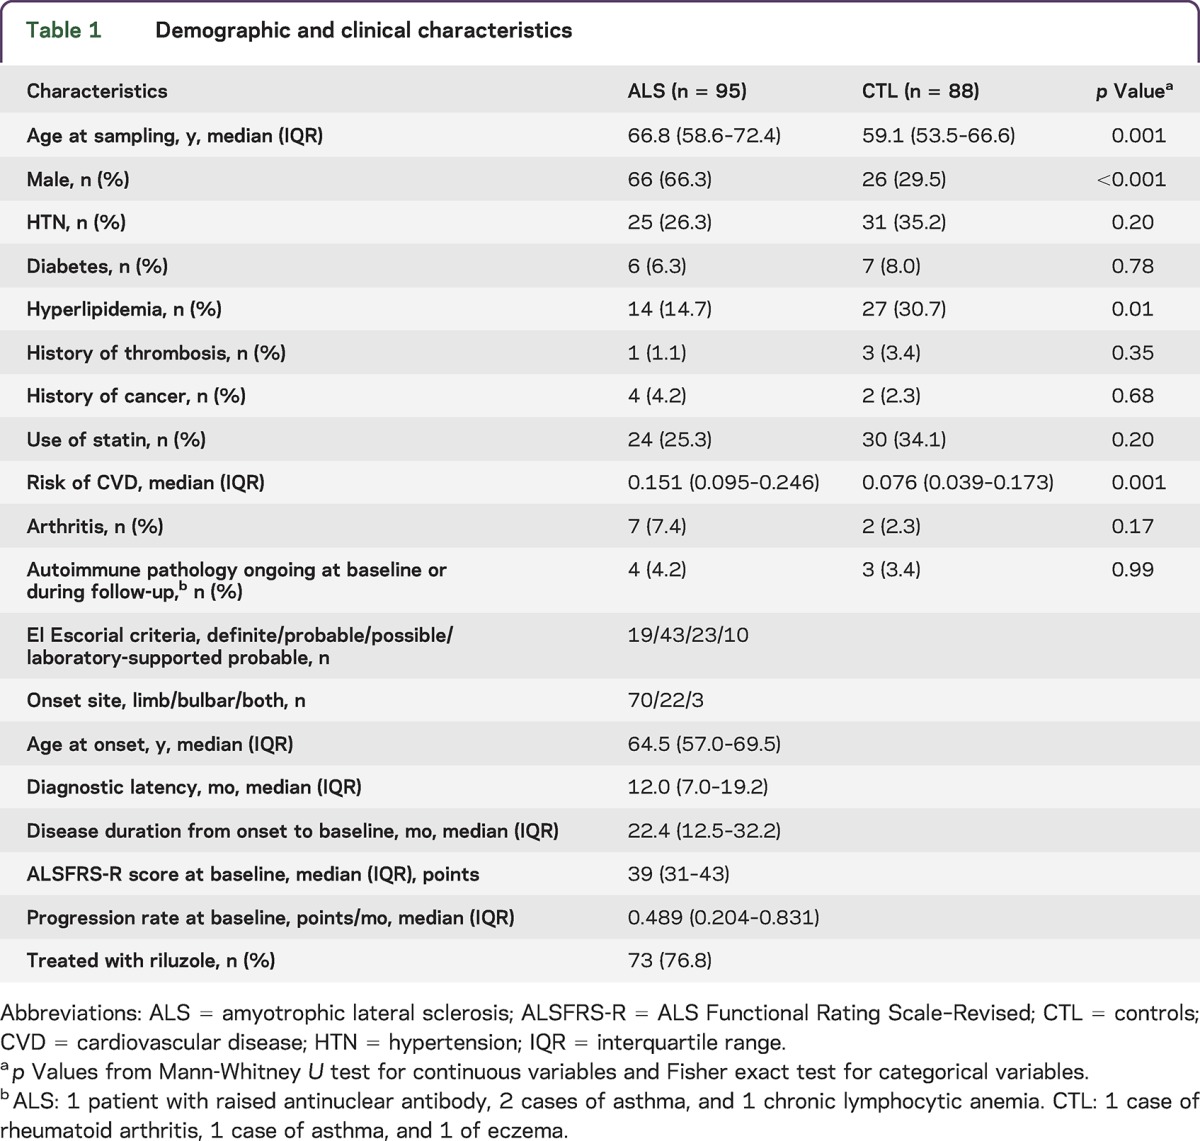
Table 2.
Plasma markers
PCA showed a good separation between ALS and control groups with regard to cytokine expression profiles (component 1: 46.2%; component 2: 25.7%; figure 1A). A better separation was obtained when the data were grouped by sex, particularly in the female group (component 1: 58.3%; figure 1, B and C). There was no meaningful separation between ALS subgroups when categorized according to site of disease onset, progression rate at baseline, and disease stages.
Figure 1. Principal component analysis (PCA) of patients with amyotrophic lateral sclerosis (ALS) vs controls.

PCA analysis shows a good separation between ALS and controls of the expression levels of the 11 cytokines under investigation, more significant when sex-specific groups are considered. (A) ALS (green squares) and controls (yellow squares), (B) male only ALS (green squares) and controls (yellow squares), and (C) female only ALS (green squares) and controls (yellow squares).
Regression analysis.
Logistic regression analysis.
Results for each individual plasma marker are summarized in table e-2A. CK, ferritin, TNF-α, IL-1β, IL-2, IL-8, IL-12p70, IL-4, IL-5, IL-10, and IL-13 were all found to be significantly increased, while IFN-γ was significantly decreased in plasma from patients with ALS compared with controls in both basic and multivariate models. IL-6 showed a similar pattern of increase in the basic model, which was not maintained after adjustment for comorbidities, treatments, and CRP levels.
Mutually adjusted multivariate regression analysis identified only IFN-γ, IL-6, TNF-α, IL-4, and IL-13 as significantly different between ALS cases and controls (table e-2B). Point estimates and relative 95% confidence intervals (CIs) from the mutually adjusted multivariate logistic regression analysis are shown in figure 2A. IFN-γ levels were significantly lower among ALS cases compared to controls (odds ratio [OR] 0.09, 95% CI 0.01–0.62, p = 0.02), while IL-6 (OR 18.55, 95% CI 1.37–251.95, p = 0.03), TNF-α (OR 35.78, 95% CI 1.86–689.20, p = 0.02), IL-4 (OR 90.90, 95% CI 1.25–6,603.62, p = 0.04), and IL-13 (OR 20.69, 95% CI 0.65–656.10, p = 0.086) were higher in ALS cases compared to controls. There were no significant differences in patients with ALS subgrouped using progression rate at baseline (cutoff at 0.5).
Figure 2. Odds ratios (ORs) from the multivariate logistic regression analysis and hazard ratios (HRs) from the Cox regression analysis.

(A) OR (filled circle) and relative 95% confidence interval (CI) (whiskers) of plasma markers in amyotrophic lateral sclerosis (ALS) and controls from mutually adjusted multivariate logistic regression models; dashed line represents null hypothesis (no difference between ALS and controls). (B) HR (filled circles) and relative 95% CI (whiskers) of plasma markers estimating risk of death among patients with ALS from mutually adjusted multivariate Cox regression analysis. The dashed line represents null hypothesis (no association with survival). p < 0.5, 0.5 < p < 0.1, and p > 0.1 are shown in blue, mulberry, and black, respectively. CRP = C-reactive protein; CVD = cardiovascular disease; IFN = interferon; IL = interleukin; TNF = tumor necrosis factor.
Cox regression analysis in patients with ALS.
Examined individually, higher levels of ferritin were found to be associated with poorer survival in ALS in both basic and multivariate models (multivariate hazard ratio [HR] 1.71, 95% CI 1.20–2.44, p = 0.003) (table e-2C). Higher IL-2 levels in ALS were associated with poorer survival only in the multivariate model (HR 1.43, 95% CI 1.04–1.98, p = 0.03).
Four markers, including ferritin, IL-2, IL-1β, and TNF-α, were further tested in the mutually adjusted multivariate Cox regression analysis and the results are summarized in figure 2B and table e-2D. Higher IL-2 (HR 1.77, 95% CI 1.10–2.84, p = 0.02) and ferritin (HR 1.38, 95% CI 0.95–1.99, p = 0.09) levels were associated with a shorter survival, while high levels of IL-1β (HR 0.52, 95% CI 0.32–0.85, p = 0.009) and the presence of diabetes (HR 0.09, 95% CI 0.02–0.49, p = 0.005) were associated with a longer survival.
Correlation analysis.
We examined the correlation between inflammatory markers and neuromuscular markers as well as ALS disease stages/progression to obtain insights into potential mechanisms underlying ALS pathology and its tissue origin. Patients with higher CK (used as a marker of muscular involvement) levels were found to have higher IL-5 (Spearman ρ: 0.217, p = 0.045), while those with higher NfL levels (as a neuronal marker) also had higher TNF-α levels (ρ: 0.264, p = 0.033). Patients with higher CRP levels (used as a proxy for general and aspecific inflammatory response) also had higher IL-6 levels (ρ: 0.518, p < 0.0001). Conversely, ferritin was found not to be correlated with any of the other markers under investigation. Patients with higher progression rate at baseline had borderline higher ferritin levels (ρ: 0.186, p = 0.081) and lower CK levels (ρ: −0.203, p = 0.058). Patients with ALS at earlier disease stage (with higher ALSFRS-R score) were reported to have higher CK levels (ρ: 0.401, p = 0.0001) and lower CRP (ρ: −0.273, p = 0.008), TNF-α (ρ: −0.269, p = 0.009), and IL-6 (ρ: −0.217, p = 0.001) levels.
Longitudinal analysis.
Plasma cytokine levels obtained from 59 patients with ALS at baseline (V1) and on their follow-up visits (V2–6) are shown in a box-and-whisker plot (figure e-1). All individual cytokines had comparable median levels of expression in all 6 visits, with the exception of IL-6, which showed a small but significant (p = 0.008, Kruskal-Wallis test) increase at V6 (median [IQR] levels: 0.81 [0.56, 1.03], n = 21) compared to V1 (0.44 [0.30, 0.66], n = 58; adjusted for multiple comparison, p = 0.002). The median ALSFRS-R scores (IQR) at V1 and V6 were 39 (34.5, 43.0) and at 32.5 (21.5, 36.0), respectively. Data from the baseline measurements in all ALS cases under investigation (n = 95) and in controls (n = 88) are also provided in figure e-1 as references.
Figure 3 displays the scatterplots of longitudinal IL-6 levels in plasma from patients with ALS subgrouped according to progression rate at baseline, sex, site of onset, ALSFRS-R score, and the use of riluzole. A mild but significant increase of IL-6 plasma levels towards the end of follow-up (V6) is demonstrated in slow progressors, male, limb onset, less functional impairment at V1, and ALS cases treated with riluzole. In the longitudinal cohort, patients treated with riluzole and those not on treatment (n = 42/17) had comparable features such as age at onset, sex, age/progression rate/ALSFRS-R score at baseline, disease duration between onset and diagnosis, and disease duration between diagnosis and baseline.
Figure 3. Longitudinal expression levels of interleukin (IL)–6 for patients with amyotrophic lateral sclerosis (ALS).

The scatterplots show IL-6 plasma levels (black dots) obtained at each follow-up time point from the 59 patients with ALS included in the longitudinal cohort. Median and quartile ranges at each visit are presented with red bars. Patients were subgrouped according to (A.a, A.b) progression rate calculated at baseline (with a cutoff value of 0.5); (B.a, B.b) sex; (C.a, C.b) site of disease onset; (D.a, D.b) ALS Functional Rating Scale–Revised (ALSFRS-R) score at V1 (cutoff value of 40); and (E.a, E.b) whether they were on riluzole or not. *p Value for Kruskal-Wallis test examining difference between all visits; **p value adjusted for multiple comparison between V1 and V6; ***p value adjusted for multiple comparison between V2 (D only) and V6.
We examined the correlation between cytokines and the progression of disease in patients with ALS during the follow-up period (intervisit progression: ΔALSFRS-R and the slope of ALSFRS-R); no meaningful associations were found between the intervisit progression and the plasma cytokine levels at the earlier visit in 212 consecutive visit pairs obtained from our longitudinal cohort of 59 patients with ALS. No association was observed between CRP, CK, and ferritin and the V1–V2 intervisit progression.
DISCUSSION
The results of our study show a dichotomy in the pattern of cytokine regulation in blood from patients with ALS, with a broad but not uniform upregulation of TNF-α, IL-1β, IL-2, IL-8, IL-12p70, IL-4, IL-5, IL-10, and IL-13, in line with previous studies,18,19 and the downregulation of IFN-γ. When the combined effects of all markers are accounted for, IL-6, TNF-α, and IFN-γ emerge as strong and coherent disease signals, as already shown in a range of other pathologic conditions.20
All cytokines under investigation in this study show stable levels of expression throughout the follow-up period, except for IL-6, which undergoes a late-stage upregulation. This preliminary observation needs to be further validated, considering that IL-6 has recently been established as a therapeutic target in ALS and a phase II clinical trial is planned.21 The strong proinflammatory effect of TNF-α has previously been associated with late-stage ALS, when neuroinflammation is most detrimental to motor neurons.20 Strong evidence supports TNF-α-induced oxidative damage to actin, resulting in the collapse of growth cones and neurite retraction.22 In line with these observations, the positive correlation between TNF-α and plasma NfL observed in this study supports a role for TNF-α in neuroaxonal destruction, with downstream NfL release in biological fluids. Our finding of a significant reduction of IFN-γ compared to controls after adjustment for comorbidities and treatments is intriguing and in contrast with previous data from smaller case-control studies showing elevated IFN-γ levels in postmortem spinal cord, CSF, and serum from patients with ALS.18,23 Our observation may be explained by the relocation of IFN-γ-secreting Th1 cells into the CNS24 or by the upregulation of IFN-γ receptor in the CNS in response to the high levels of TNF-α and IL-1.25,26
Of the activated inflammatory markers in our study, IL-6, IL-8, TNF-α, IL-10, IL-4, and IL-13 can be produced physiologically by contracting muscle fibers and can be overexpressed during strength training.27 It is possible that hyperexcitable muscles prone to fasciculation and atrophy in ALS may also cause overexpression of these markers. In rodent models of ALS, neuromuscular junction destruction and distal axonopathy precede motor neuron loss28; the early accumulation of macrophages expressing CD11b and CD68 in axons29 and of other immunologic factors originating from the muscle may play an active role in motor neuron degeneration by inhibition of neurite outgrowth.
IL-6 promotes glucose uptake and fatty acid oxidation–induced lipolysis and regulates muscle–adipose tissue crosstalk.30 The systemic immune response we observe in ALS may be linked to the state of hypermetabolism and of lipid dysregulation now widely recognized in ALS.31 Hence, the observed late IL-6 regulation may reflect the increasing metabolic imbalance associated with the disease process in ALS. We also report how the expression of CK, a known marker for muscular damage, and of IL-5, which is central to B-cell immunity and eosinophil activation, change synergistically. IL-5 and other cytokines driving the more benign form of inflammation defined as Th2 have not been reported to change in plasma expression after exercise.27 Since high CK plasma levels are also associated with better neurologic function (higher ALSFRS-R score) and slower progression rate in our patients with ALS, the correlation between CK and IL-5 expression may be indicative of neurorestorative mechanisms rather than being a measure of neuromuscular dysfunction. The speculative nature of these observations will need further studies to improve our understanding of the pathologic processes linked to ALS.
Our panel of inflammatory markers and NfL have both been reported as differentially regulated in blood from patients with ALS and to have a prognostic value with regard to the rate of disease progression. However, the reported changes of circulating inflammatory markers throughout the disease course may be a more representative measure of the disease burden in a neuromuscular disorder like ALS, which engenders destruction of motor areas in the CNS and muscle functional derangement by denervation. Neurofilaments release in biological fluids relates only to neuroaxonal damage and not to the wider neuromuscular pathology observed in ALS. Hence, NfL and the reported inflammatory markers should be considered as complementary signals within an improved panel of disease biomarkers for ALS.
Among the activated markers in our study, IL-2 and ferritin are risk factors for survival. IL-2 has not been directly linked to ALS as a biomarker, nor has it been found to have a direct pathogenic role in the disease. IL-2 may modulate the disease process by induction of Treg or by activation of natural killer (NK) cells known to be cytotoxic for a wide range of neurons. The reported increase of NK and CD8+ T cells in the blood of patients with ALS supports not only the important contribution of the innate immune system in the development of ALS, but also a potential role for IL-2.9,32 The interplay among IL-2, Treg, NK, and cytotoxic T cells is at the center of intense research into potential immunomodulatory therapeutic strategies in ALS.
Our data on ferritin upregulation in blood, its prognostic significance, and positive correlation with PRB in patients with ALS supports previous findings,5,33 even though a protective effect was reported in a small sample–sized predictive model.34 Ferritin is able to sequester iron and reduce the amount of iron available for reactive oxygen species, thus acting as a defense mechanism against oxidative stress.35 It has been shown that TNF-α and IL-1α can regulate ferritin transcriptionally,36 while TNF-α, IL-1β, and IL-6 exert the same function post-transcriptionally.37,38 These observations corroborate the marked systemic upregulation of these cytokines and the prognostic effect of ferritin observed in our study. With regard to changes that may be associated with a better prognostic outlook, we have also observed a protective effect of diabetes for the survival of our patients with ALS (figure 2B), which is in line with a recent population study from Danish cohorts.39
It has previously been shown that CSF hosts relevant components of ALS immunoreactivity,19 including the regulation of the proinflammatory and neutrophil activator IL-8 linked to shorter disease duration and of the monocyte chemoattractant protein-1 (MCP-1) associated with prolonged survival.34 CSF is unanimously considered the most reliable source of biological signals of neurodegeneration for its anatomical contiguity to affected nervous tissues; it is naturally enriched of by-products of neuronal destruction or remodeling. Recently, combined CSF and plasma inflammatory markers have been proposed as an orthogonal biomarker to model prognosis in ALS, including plasma IFN-γ-induced protein 10, IL-5, and L-ferritin, as well as CSF IL-8, MCP-1, and IFN-γ plasma/CSF ratio.34 However, immunologic signals and other tissue-specific signals arising from the neuromuscular pathology seen in ALS may be underrepresented in CSF. Lumbar punctures are also impractical when serial CSF sampling is needed for longitudinal biomarker studies, particularly in patients with advanced ALS. Peripheral blood represents a complex but more accessible alternative to CSF for long-term immune monitoring of ALS40 and the most appropriate matrix to measure systemic changes linked to the development of neurodegeneration.
The composite inflammatory response we report in this article, with the variable regulation of TNF-α, IL-6, and IFN-γ, the rising levels of IL-6 with disease progression, and the prognostic values of IL-2/ferritin with regard to survival is an additional tool for better comprehensive disease stratification in ALS. This preliminary observation requires further validation in larger and independent ALS cohorts. A better understanding of the regulation of circulating immunologic factors in patients with ALS has several advantages and could be used (1) to increase the diagnostic potency of existing panels of neurochemical biomarkers, (2) for the prognostic stratification of the disease, and (3) to assess treatment response in clinical trials, particularly if immunomodulatory strategies are involved. The adjustment for factors involved in the systemic inflammatory response in our analyses adds to the specificity of the ALS immune response. The proinflammatory or neuroprotective effect of cytokines is likely to depend on the disease stage and the biological microenvironment they are embedded in. Only the combined monitoring of the expression of these immunologic markers and of other clinical and biological measures of disease progression and of treatment response can establish inflammatory markers as useful disease monitoring tools in ALS.
Supplementary Material
ACKNOWLEDGMENT
The authors thank the participants of nontherapeutic clinical research; and Dr. Elisa Maggioli and Dr. Egle Solito (Centre for Translational Medicine and Therapeutics, William Harvey Research Institute, Barts and The London School of Medicine and Dentistry, Queen Mary University of London, UK) for their help in part of the experiments.
GLOSSARY
- ALS
amyotrophic lateral sclerosis
- ALSFRS-R
ALS Functional Rating Scale–Revised
- CI
confidence interval
- CK
creatine kinase
- CRP
C-reactive protein
- CVD
cardiovascular disease
- FTD
frontotemporal dementia
- HR
hazard ratio
- IFN
interferon
- IL
interleukin
- IQR
interquartile range
- LOD
limit of detection
- MCP-1
monocyte chemoattractant protein–1
- NfL
neurofilament light chain
- NK
natural killer
- OR
odds ratio
- PCA
principal component analysis
- PRB
progression rate calculated at baseline
- TNF
tumor necrosis factor
- Treg
regulatory T cells
Footnotes
Funding information and disclosures are provided at the end of the article. Go to Neurology.org/nn for full disclosure forms. The Article Processing charge was paid by Research Councils of United Kingdom.
Supplemental data at Neurology.org/nn
AUTHOR CONTRIBUTIONS
C.L. undertook the laboratory work, data analysis, and interpretation and wrote the first draft of the paper. K.A. and F.O. undertook the laboratory work and helped in the data analysis. E.L. contributed to the data analysis. T.T. contributed to the data interpretation and reviewed and amended the manuscript. R.O., M.F., K.S., R.H., N.S., and P.F. contributed to patient enrolment and data collection and revised the manuscript for content. L.G. and J.K. contributed to the conceptualization and design of the study and data interpretation and reviewed and amended the manuscript. N.P. and V.G. advised on the statistical analysis and participated in the interpretation of data, helping in the review and amendment of the manuscript. A.M. developed the conceptualization and design of the study, performed most of the patient enrollment, and helped in data collection, interpretation of the data, and writing and amending versions of the manuscript. A.M. has full access to all of the data in the study and takes responsibility for the integrity of the data and the accuracy of the data analysis. All authors reviewed the drafts and approved the final version of this manuscript.
STUDY FUNDING
This project was funded by The Motor Neurone Disease Association (Malaspina/Apr13/6097) and Barts and The London Charities (468/1714). A.M. is funded by the Medical Research Council (MR/M015882/1). L.G. is the Graham Watts Senior Research Fellow, funded by The Brain Research Trust, the European Community's Seventh Framework Programme (FP7/2007–2013), and NIHR University College London Hospitals Biomedical Research Centre. M.F. is funded by NIHR portfolio study. J.K. is funded by an ECTRIMS Research Fellowship Programme and by the Research Funds of the University of Basel, Switzerland. E.L. is funded by Wellcome Trust Pathfinder Award (103208).
DISCLOSURE
C. Lu, K. Allen, and F. Oei report no disclosures. E. Leoni is employed by Proteome Sciences plc. J. Kuhle's institution received speaker honoraria/travel funding from Swiss MS Society, Biogen, Novartis, Roche, Genzyme, and Merck Serono, and he received research support from Bayer AG, Genzyme, Novartis, Roche, Swiss National Research Foundation, ECTRIMS, University of Basel, and Swiss MS Society. T. Tree is on the editorial board for Clinical and Experimental Immunology and received research support from Athersys, Diabetes UK, and Juvenile Diabetes Research Foundation. P. Fratta received research support from UK Medical Research Council and Motor Neurone Disease Association and UCLH NIHR Biomedical Research Centre. N. Sharma received research support from MRC Core Unit. K. Sidle received research support from Leasing Foundation. R. Howard reports no disclosures. R. Orrell is the chair of the data and safety monitoring committee for Orion Foundation; received travel funding from European Academy of Neurology, Motor Neurone Disease Association, Alnylam Pharmaceuticals, and ISIS Pharmaceuticals; served on the editorial board for Muscle Nerve, Neuromuscular Disorders, and Cochrane Neuromuscular Disease Group; and received travel funding from GSK, Motor Neurone Disease Association, Alnylam Pharmaceuticals, and ISIS Pharmaceuticals. M. Fish is a consultant neurologist for Taunton and Somerset NHS Trust UK. L. Greensmith reports no disclosures. N. Pearce received research support from Health Research Council of New Zealand and Colt Foundation. V. Gallo served as editor for Conference Papers in Medicine, World Journal of Neurology, Dataset Papers in Medicine, World Journal of Meta-Analysis, Clinical Epidemiology Reviews, International Journal of Neurology Research, and Spine SNN; and received research support from Second University of Naples. A. Malaspina reports no disclosures. Go to Neurology.org/nn for full disclosure forms.
REFERENCES
- 1.Bruijn L, Cudkowicz M. Opportunities for improving therapy development in ALS. Amyotroph Lateral Scler Frontotemporal Degener 2014;15:169–173. [DOI] [PubMed] [Google Scholar]
- 2.Peters OM, Ghasemi M, Brown RH Jr. Emerging mechanisms of molecular pathology in ALS. J Clin Invest 2015;125:1767–1779. [DOI] [PMC free article] [PubMed] [Google Scholar]
- 3.Sta M, Sylva-Steenland RM, Casula M, et al. Innate and adaptive immunity in amyotrophic lateral sclerosis: evidence of complement activation. Neurobiol Dis 2011;42:211–220. [DOI] [PubMed] [Google Scholar]
- 4.Keizman D, Rogowski O, Berliner S, et al. Low-grade systemic inflammation in patients with amyotrophic lateral sclerosis. Acta Neurol Scand 2009;119:383–389. [DOI] [PubMed] [Google Scholar]
- 5.Nadjar Y, Gordon P, Corcia P, et al. Elevated serum ferritin is associated with reduced survival in amyotrophic lateral sclerosis. PLoS One 2012;7:e45034. [DOI] [PMC free article] [PubMed] [Google Scholar]
- 6.Poloni M, Facchetti D, Mai R, et al. Circulating levels of tumour necrosis factor-alpha and its soluble receptors are increased in the blood of patients with amyotrophic lateral sclerosis. Neurosci Lett 2000;287:211–214. [DOI] [PubMed] [Google Scholar]
- 7.Turner MR, Goldacre R, Ramagopalan S, Talbot K, Goldacre MJ. Autoimmune disease preceding amyotrophic lateral sclerosis: an epidemiologic study. Neurology 2013;81:1222–1225. [DOI] [PMC free article] [PubMed] [Google Scholar]
- 8.Berjaoui S, Povedano M, Garcia-Esparcia P, Carmona M, Aso E, Ferrer I. Complex inflammation mRNA-related response in ALS is region dependent. Neural Plast 2015;2015:573784. [DOI] [PMC free article] [PubMed] [Google Scholar]
- 9.Henkel JS, Beers DR, Wen S, et al. Regulatory T-lymphocytes mediate amyotrophic lateral sclerosis progression and survival. EMBO Mol Med 2013;5:64–79. [DOI] [PMC free article] [PubMed] [Google Scholar]
- 10.Brooks BR, Miller RG, Swash M, Munsat TL. El Escorial revisited: revised criteria for the diagnosis of amyotrophic lateral sclerosis. Amyotroph Lateral Scler Other Motor Neuron Disord 2000;1:293–299. [DOI] [PubMed] [Google Scholar]
- 11.Lu CH, Petzold A, Topping J, et al. Plasma neurofilament heavy chain levels and disease progression in amyotrophic lateral sclerosis: insights from a longitudinal study. J Neurol Neurosurg Psychiatry 2015;86:565–573. [DOI] [PMC free article] [PubMed] [Google Scholar]
- 12.Hippisley-Cox J, Coupland C, Vinogradova Y, et al. Predicting cardiovascular risk in England and Wales: prospective derivation and validation of QRISK2. BMJ 2008;336:1475–1482. [DOI] [PMC free article] [PubMed] [Google Scholar]
- 13.Teunissen CE, Petzold A, Bennett JL, et al. A consensus protocol for the standardization of cerebrospinal fluid collection and biobanking. Neurology 2009;73:1914–1922. [DOI] [PMC free article] [PubMed] [Google Scholar]
- 14.Gu Y, Shore RE, Arslan AA, et al. Circulating cytokines and risk of B-cell non-Hodgkin lymphoma: a prospective study. Cancer Causes Control 2010;21:1323–1333. [DOI] [PMC free article] [PubMed] [Google Scholar]
- 15.Helsel DR. Less than obvious: statistical treatment of data below the detection limit. Environ Sci Technol 1990;24:1766–1774. [Google Scholar]
- 16.Shi GP, Bot I, Kovanen PT. Mast cells in human and experimental cardiometabolic diseases. Nat Rev Cardiol 2015;12:643–658. [DOI] [PubMed] [Google Scholar]
- 17.Lu CH, Macdonald-Wallis C, Gray E, et al. Neurofilament light chain: a prognostic biomarker in amyotrophic lateral sclerosis. Neurology 2015;84:2247–2257. [DOI] [PMC free article] [PubMed] [Google Scholar]
- 18.Babu GN, Kumar A, Chandra R, Puri SK, Kalita J, Misra UK. Elevated inflammatory markers in a group of amyotrophic lateral sclerosis patients from northern India. Neurochem Res 2008;33:1145–1149. [DOI] [PubMed] [Google Scholar]
- 19.Tateishi T, Yamasaki R, Tanaka M, et al. CSF chemokine alterations related to the clinical course of amyotrophic lateral sclerosis. J Neuroimmunol 2010;222:76–81. [DOI] [PubMed] [Google Scholar]
- 20.Hooten KG, Beers DR, Zhao W, Appel SH. Protective and toxic neuroinflammation in amyotrophic lateral sclerosis. Neurotherapeutics 2015;12:364–375. [DOI] [PMC free article] [PubMed] [Google Scholar]
- 21.NCT02469896: a trial of tocilizumab in ALS subjects (TCZALS-001). 2015. Available at: https://clinicaltrials.gov/ct2/show/NCT02469896. Accessed May 8, 2016.
- 22.Kuhn TB. Oxygen radicals elicit paralysis and collapse of spinal cord neuron growth cones upon exposure to proinflammatory cytokines. Biomed Res Int 2014;2014:191767. [DOI] [PMC free article] [PubMed] [Google Scholar]
- 23.Hensley K, Fedynyshyn J, Ferrell S, et al. Message and protein-level elevation of tumor necrosis factor alpha (TNF alpha) and TNF alpha-modulating cytokines in spinal cords of the G93A-SOD1 mouse model for amyotrophic lateral sclerosis. Neurobiol Dis 2003;14:74–80. [DOI] [PubMed] [Google Scholar]
- 24.Aebischer J, Moumen A, Sazdovitch V, Seilhean D, Meininger V, Raoul C. Elevated levels of IFNgamma and LIGHT in the spinal cord of patients with sporadic amyotrophic lateral sclerosis. Eur J Neurol 2012;19:752–759, e745–756. [DOI] [PubMed] [Google Scholar]
- 25.Krakauer T, Oppenheim JJ. IL-1 and tumor necrosis factor-alpha each up-regulate both the expression of IFN-gamma receptors and enhance IFN-gamma-induced HLA-DR expression on human monocytes and a human monocytic cell line (THP-1). J Immunol 1993;150:1205–1211. [PubMed] [Google Scholar]
- 26.Shirey KA, Jung JY, Maeder GS, Carlin JM. Upregulation of IFN-gamma receptor expression by proinflammatory cytokines influences IDO activation in epithelial cells. J Interferon Cytokine Res 2006;26:53–62. [DOI] [PMC free article] [PubMed] [Google Scholar]
- 27.Peake JM, Della Gatta P, Suzuki K, Nieman DC. Cytokine expression and secretion by skeletal muscle cells: regulatory mechanisms and exercise effects. Exerc Immunol Rev 2015;21:8–25. [PubMed] [Google Scholar]
- 28.Dupuis L, Loeffler JP. Neuromuscular junction destruction during amyotrophic lateral sclerosis: insights from transgenic models. Curr Opin Pharmacol 2009;9:341–346. [DOI] [PubMed] [Google Scholar]
- 29.Graber DJ, Hickey WF, Harris BT. Progressive changes in microglia and macrophages in spinal cord and peripheral nerve in the transgenic rat model of amyotrophic lateral sclerosis. J Neuroinflammation 2010;7:8. [DOI] [PMC free article] [PubMed] [Google Scholar]
- 30.Trujillo ME, Sullivan S, Harten I, Schneider SH, Greenberg AS, Fried SK. Interleukin-6 regulates human adipose tissue lipid metabolism and leptin production in vitro. J Clin Endocrinol Metab 2004;89:5577–5582. [DOI] [PubMed] [Google Scholar]
- 31.Dupuis L, Pradat PF, Ludolph AC, Loeffler JP. Energy metabolism in amyotrophic lateral sclerosis. Lancet Neurol 2011;10:75–82. [DOI] [PubMed] [Google Scholar]
- 32.Rentzos M, Evangelopoulos E, Sereti E, et al. Alterations of T cell subsets in ALS: a systemic immune activation? Acta Neurol Scand 2012;125:260–264. [DOI] [PubMed] [Google Scholar]
- 33.Patin F, Corcia P, Madji Hounoum B, et al. Biological follow-up in amyotrophic lateral sclerosis: decrease in creatinine levels and increase in ferritin levels predict poor prognosis. Eur J Neurol 2015;22:1385–1390. [DOI] [PubMed] [Google Scholar]
- 34.Su XW, Simmons Z, Mitchell RM, Kong L, Stephens HE, Connor JR. Biomarker-based predictive models for prognosis in amyotrophic lateral sclerosis. JAMA Neurol 2013;70:1505–1511. [DOI] [PubMed] [Google Scholar]
- 35.Torti FM, Torti SV. Regulation of ferritin genes and protein. Blood 2002;99:3505–3516. [DOI] [PubMed] [Google Scholar]
- 36.Wei Y, Miller SC, Tsuji Y, Torti SV, Torti FM. Interleukin 1 induces ferritin heavy chain in human muscle cells. Biochem Biophys Res Commun 1990;169:289–296. [DOI] [PubMed] [Google Scholar]
- 37.Hirayama M, Kohgo Y, Kondo H, et al. Regulation of iron metabolism in HepG2 cells: a possible role for cytokines in the hepatic deposition of iron. Hepatology 1993;18:874–880. [DOI] [PubMed] [Google Scholar]
- 38.Rogers JT, Bridges KR, Durmowicz GP, Glass J, Auron PE, Munro HN. Translational control during the acute phase response. Ferritin synthesis in response to interleukin-1. J Biol Chem 1990;265:14572–14578. [PubMed] [Google Scholar]
- 39.Kioumourtzoglou MA, Rotem RS, Seals RM, Gredal O, Hansen J, Weisskopf MG. Diabetes Mellitus, Obesity, and diagnosis of amyotrophic lateral sclerosis: a population-based study. JAMA Neurol 2015;72:905–911. [DOI] [PMC free article] [PubMed] [Google Scholar]
- 40.Turner MR, Bowser R, Bruijn L, et al. Mechanisms, models and biomarkers in amyotrophic lateral sclerosis. Amyotroph Lateral Scler Frontotemporal Degener 2013;14(suppl 1):19–32. [DOI] [PMC free article] [PubMed] [Google Scholar]
Associated Data
This section collects any data citations, data availability statements, or supplementary materials included in this article.