Abstract
We describe the rationale and implementation of a method for analyzing in-room positron emission tomography (PET) data to verify the proton beam range. The method is based on analyzing distal PET surfaces after passive scattering proton beam delivery. Typically in vivo range verification is done by comparing measured and predicted PET distribution for a single activity level at a selected activity line along the beam passage. In the method presented here, we suggest using a middle point method based on dual PET activity levels to minimize the uncertainty due to local variations in the PET activity. Furthermore, we introduce 2-dimensional (2D) PET activity level surfaces based on 3-dimensional maps of the PET activities along the beam passage. This allows determining not only average range differences but also range difference distributions as well as root mean square deviations (RMSDs) for a more comprehensive range analysis. The method is demonstrated using data from 8 patients who were scanned with an in-room PET scanner. For each of the 8 patients, the average range difference was less than 5 mm and the RMSD was 4 to 11 mm between the measured and simulated PET activity level surfaces for single-field treatments. An ongoing protocol at our institution allows the use of a single field for patients being imaged for the PET range verification study at 1 fraction during their treatment course. Visualizing the range difference distributions using the PET surfaces offers a convenient visual verification of range uncertainties in 2D. Using the distal activity level surfaces of simulated and measured PET distributions at the middle of 25% and 50% activity level is a robust method for in vivo range verification.
Keywords: proton therapy, in-room PET, in vivo range, distal PET surface, Monte Carlo simulation
Introduction
One of the main advantages of proton therapy over conventional photon therapy is the finite range of proton beams. However, this can only be fully exploited if range uncertainties in vivo can be accurately quantified and minimized.1,2 For in vivo range verification, Bennett et al suggested measuring the positron emitters generated by the proton-induced nuclear interactions along the proton beam passage,3 and various groups have shown the potential of positron emission tomography (PET).4-17 Shakirin et al classified PET scanners and discussed their characteristics with 3 concepts, that is, in-beam PET, in-room PET, and off-line PET.4 Compared to in-beam and in-room PET, off-line PET located outside of a treatment room suffers from the delay when measuring the short half-life of positron emitters, particularly for 15O (T1/2 = 2.037 minutes) dominant in soft tissues, and loses activity through biological decay. In-beam PET systems with a full-ring detection would have clear advantages.5,6 However, currently in-room PET systems have a limited size applicable only to head and neck cases.6-9
Accurately determining the elemental tissue compositions is essential for precisely predicting the proton range in vivo.10,11 Furthermore, the physical processes responsible for the proton dose distribution are mainly electromagnetic, while positron emitter distributions are related to nuclear interactions. Consequently, in vivo range verification relies on comparing measured and simulated PET distributions.6-9
Parodi et al showed the comparison of measured and Monte Carlo (MC)-simulated PET activity lines (ie, 1-dimensional [1D]) selected near the center of the beam passage.9 However, the results depend on the location of the selected 1D activity lines. The comparison of 2-dimensional (2D) activity lines covering the whole beam passage should be more robust for quantitative evaluation of in vivo range uncertainties. In addition, visualizing 2D range differences in the beam's eye view could be valuable for adaptive treatment planning.
Recognizing the limitation of 1D analysis and a planar-type detection system, we recently analyzed 8 patients from an in-room PET study using full-ring detectors.7 We used a 2D range verification method based on an automatic determination of distal PET distribution surfaces. In this article, we describe this method in detail and demonstrate its robustness for range verification.
Materials and Methods
In-Room PET Measurement
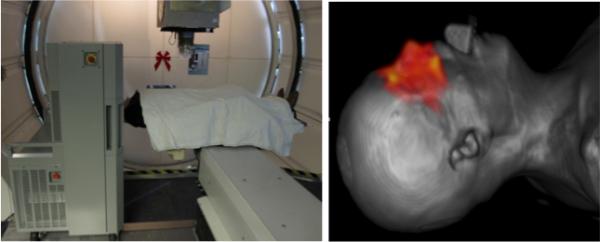
The in-room PET scanner used in this study is a mobile scanner on wheels. It can be positioned next to treatment bed and allows starting the scan within about 2 minutes after beam delivery by repositioning the patient bed and moving the patient's head into the scanner bore as shown in Figure 1. An in-room PET scanner is capable of measuring not only 11C (T1/2 = 20.39 minutes) but also 15O (T1/2 = 2.037 minutes) dominant in soft tissues.
Figure 1.

In-room PET on wheels positioned next to the proton beam gantry (left) and a patient computed tomography (CT) image coregistered with a reconstructed PET distribution illustrated as red color wash (right).
After a 20-minute PET scan in list mode, the data were reconstructed with a 3-dimensional (3D) ordered subset expectation maximization algorithm. Subsequently, the PET images were coregistered on the treatment planning computed tomography (CT) images with attenuation correction. The spatial resolution and sensitivity of the in-room PET are 2.8 to 5.3 mm and 18.8 cps/kBq, respectively. The performance of the scanner has been assessed through phantom and patient studies.6 Eight patients treated with only 1 field on the day of the scan date were enrolled in an ongoing institutional review board–approved protocol. Details about the patient population can be found elsewhere.7
Monte Carlo Simulation
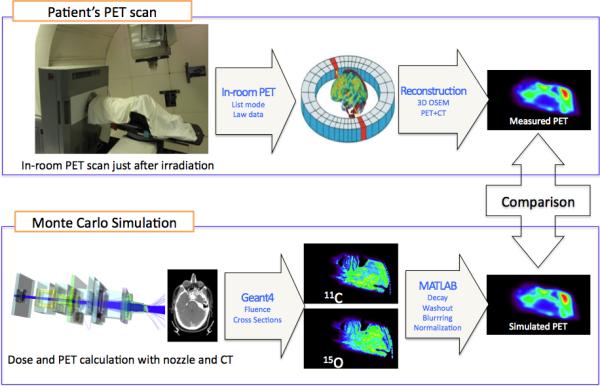
To simulate the PET activity prediction, the Geant4 Monte Carlo toolkit18 was employed. Primary protons (4 × 10⁷) at the entrance of the beam nozzle were tracked through the treatment head and stored in a phase space at treatment head exit. To increase the statistical resolution, these phase space files were subsequently used 4 times for the dose and PET activity simulations. The proton beam delivery in double scattering mode was simulated with the patient geometry obtained from the treatment planning CT.1,2 In each CT voxel, (1) incidences of the major positron emitters (11C, 13N, 15O, 30P, and 38K) were predicted with the corresponding cross-sections of each element and the energy fluence of the proton beam, (2) all PET activities were summed and normalized by considering the prescription dose of each patient, and (3) the maps of PET activities were determined by considering the physical and biological decays according to the patient-specific beam delivery and scan times. For the comparison with the measured PET distribution, the simulated PET distribution was blurred assuming that the PET scanner has a spatial resolution of a Gaussian with 7 mm full width at half maximum.17 The uncertainty in predicting the in vivo range was assessed by comparing the measured and simulated PET distribution as illustrated in Figure 2.
Figure 2.

The process of the in-room positron emission tomography (PET) measurement with image reconstruction (upper) and the Monte Carlo simulation (lower).
Distal PET Surface Analysis
Using MATLAB (MathWorks, Inc, Natick, Massachusetts), the acquired 3D PET images from the PET scanner were manually coregistered on the treatment planning CT by matching the PET and CT markers on the patient mask. Next, the measured and simulation PET images were registered into the same grid for comparison because the measured PET images have 128 × 128 × 128 voxels of 2 mm cubic due to the fixed field of view in the scanner, while the simulated PET images are scored on regular or irregular grids according to the patient CT.
In proton therapy based on passive scattering, proton beams pass through the patient-specific compensator to deliver a conformal dose distribution to the tumor shape-dependent target volume. Proton have different ranges according to the position in the field. Thus, when verifying the delivered range based on a comparison of measured and calculated PET distributions, it is not sufficient to limit the analysis to selected field positions. Consequently, we applied a method to verify the range in vivo based on 2D surfaces. Such a surface is defined by those voxels representing a particular PET signal strength in the distal falloff relative to the maximum. At each activity voxel line along the beam passage, a voxel in the distal falloff of the PET distribution was selected based on a defined percentage value (reference point) of the maximum activity. Next, 2D distal PET activity surfaces were acquired in the beam's eye view by combining these voxels. The measured PET activities outside of the primary radiation field path were disregarded. To quantitatively evaluate the difference between delivered and expected range, the average range difference and root mean square deviation (RMSD) between the simulated and measured PET surfaces were assessed on a voxel-by-voxel basis as follows:
| (1) |
where Xmeas,i and Xmc,i are the reference ranges in ith ranges at the voxel line i of the simulated and measured PET images, respectively.
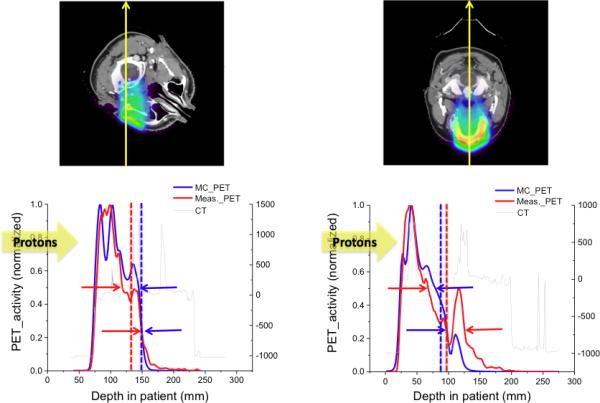
The reference point has previously been defined as 20% or 50% location of the maximum PET activity along the beam passage.7 However, range differences turn out to be very sensitive to the definition of the reference point. We therefore suggest that the reference point should be defined as the middle point which is the average depth of 25% and 50% location of the maximum PET activity. The location of 25% of maximum activity was selected due to the background activities, which are up to 20% of the maximum activity with the in-room PET scanner. Such background activities are observed in Figure 3. It is also observed that mostly PET distribution shows relatively gradual variation from 50% to maximum activity, although the PET distribution depends on the anatomy in the beam passage.
Figure 3.

The lower figures show the 1-dimensional (1D) positron emission tomography (PET) activity distributions based on the Monte Carlo (MC) simulations (blue) and the measurements (red) along the yellow arrow in the upper figures. The upper and lower arrows in the lower figures indicate the reference points defined as the location of the 50% and the 25% value of the maximum activity, respectively. Blue and red broken lines indicate the reference points determined by using the middle point method.
Results and Discussion
The clinical results for the 8 patients treated with passive scattering proton therapy have been reported previously.7 We found that the PET activity distributions predicted by the MC simulations and the measurements show overall good agreement. Figure 4 shows the measured and simulated PET surfaces with their difference maps in the beam's eye view for one of the patients. The difference maps show that the range differences were less than 3 mm for the majority of the analyzed PET surface, while significant differences of up to 15 mm were observed not only in the penumbra region but also around the convex region of the distribution. The RMSD and average range difference were 4.9 and 1.5 mm, respectively, for this case.
Figure 4.
PET surfaces obtained from measurement (left) and simulation (middle) as assessed with the middle point method with their range difference map (right).
Visualizing 3D distal dose difference maps could be valuable for adaptive treatment planning. The patient could be treated as planned for one fraction, and then the measured PET distribution obtained just after the beam delivery would be compared with the simulated PET distribution. If the region of interest, for example, close to critical organs, shows significant range difference, replanning or range adjustment could be considered.
Figure 3 illustrates the sensitivity of the obtained range difference on the chosen reference point. For the case shown on the left, the reference point defined as the location of 50% of the maximum activity indicates a 27-mm difference between the simulated and measured PET falloff, while choosing the 25% point of the maximum activity results in a difference of less than 1 mm. For the case shown on the right, the range differences were 28 mm using the 25% point and 10 mm using the 50% point. The middle point method, defining the reference point as the middle of 25% and 50% location of the maximum activity, turns out to be more robust and leads to smaller variations.
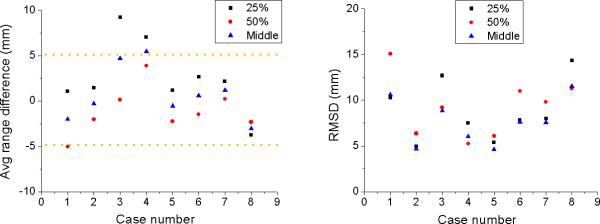
Although in vivo PET images have the potential to detect differences between planned and delivered proton beam range, the method has limitations due to uncertainties in cross-sections for MC simulations, patient positioning, anatomical change, and biological washout. Furthermore, patient CT data do not allow to model patient-specific elemental composition for a precise calculation of the PET activity using MC simulations.11 The application of multiple fields per fraction would impact the accurate analysis in determining the distal dose edge. Our results based on the middle point method in combination with distal PET surfaces must still be validated. The clinical trials for 8 patients show on average less than 5 mm range difference and 4 to 11 mm of RMSD as shown in Figure 5. The method presented here does work equally well in scanned beams if single-field uniform dose is prescribed.
Figure 5.
Average range difference (left) and root mean square deviation (right) according to the 25%, 50%, and middle point method for 8 patients after irradiation with a single field.
Conclusion
For PET-based in vivo proton beam range verification, we suggest analyzing the PET surface resembling the distal shape of the target volume and using a reference point as an average of the 25% and 50% activity. Moreover, visualizing the range difference via 2D maps based on the PET surfaces analysis presents a way of illustrating range differences relative to the position of critical organs. For PET range verification, a single-field delivery on the day of the scan is recommended because in multiple fields, lateral and distal regions of the PET activities overlap.
Acknowledgments
Funding
The author(s) disclosed receipt of the following financial support for the research, authorship, and/or publication of this article: This work was supported by NIH grants P01CA21239, R21CA153455, and R21EB12823.
Abbreviations
- FWHM
full width at half maximum
- IRB
Institutional Review Board
- OSEM
ordered subset expectation maximization
- PET
positron emission tomography
- RMSD
root-mean-square deviations
Footnotes
Declaration of Conflicting Interests
The author(s) declared no potential conflicts of interest with respect to the research, authorship, and/or publication of this article.
References
- 1.Paganetti H. Range uncertainties in proton therapy and the role of Monte Carlo simulations. Phys Med Biol. 2012;57(11):R99–R117. doi: 10.1088/0031-9155/57/11/R99. doi:10.1088/0031-9155/57/11/R99. [DOI] [PMC free article] [PubMed] [Google Scholar]
- 2.Paganetti H, Jiang H, Parodi K, Slopsema R, Engelsman M. Clinical implementation of full Monte Carlo dose calculation in proton beam therapy. Phys Med Biol. 2008;53(17):4825–4853. doi: 10.1088/0031-9155/53/17/023. doi: 10.1088/0031-9155/53/17/023. [DOI] [PubMed] [Google Scholar]
- 3.Bennett GW, Archambeau JO, Archambeau BE, Meltzer JI, Win-gate CL. Visualization and transport of positron emission from proton activation in vivo. Science. 1978;200(4346):1151–1153. doi: 10.1126/science.200.4346.1151. [DOI] [PubMed] [Google Scholar]
- 4.Shakirin G, Braess H, Fiedler F, et al. Implementation and work-flow for PET monitoring of therapeutic ion irradiation: a comparison of in-beam, in-room, and off-line techniques. Phys Med Biol. 2011;56(5):1281–1298. doi: 10.1088/0031-9155/56/5/004. doi:10.1088/0031-9155/56/5/004. [DOI] [PubMed] [Google Scholar]
- 5.Surti S, Zou W, Daube-Witherspoon ME, McDonough J, Karp JS. Design study of an in situ PET scanner for use in proton beam therapy. Phys Med Biol. 2011;56(9):2667–2685. doi: 10.1088/0031-9155/56/9/002. doi:10.1088/0031-9155/56/9/002. [DOI] [PMC free article] [PubMed] [Google Scholar]
- 6.Zhu X, Espana S, Daartz J, et al. Monitoring proton radiation therapy with in-room PET imaging. Phys Med Biol. 2011;56(13):4041–4057. doi: 10.1088/0031-9155/56/13/019. doi:10.1088/0031-9155/56/13/019. [DOI] [PMC free article] [PubMed] [Google Scholar]
- 7.Min CH, Zhu X, Winey BA, et al. Clinical application of in-room PET for in vivo treatment monitoring in proton radiotherapy. Int J Radiat Oncol Biol Phys. 2013;86(1):183–189. doi: 10.1016/j.ijrobp.2012.12.010. doi:10.1016/j.ijrobp.2012.12.010. [DOI] [PMC free article] [PubMed] [Google Scholar]
- 8.Knopf A, Parodi K, Paganetti H, Cascio E, Bonab A, Bortfeld T. Quantitative assessment of the physical potential of proton beam range verification with PET/CT. Phys Med Biol. 2008;53(15):4137–4151. doi: 10.1088/0031-9155/53/15/009. doi:10.1088/0031-9155/53/15/009. [DOI] [PubMed] [Google Scholar]
- 9.Parodi K, Paganetti H, Shih HA, et al. Patient study of in vivo verification of beam delivery and range, using positron emission tomography and computed tomography imaging after proton therapy. Int J Radiat Oncol Biol Phys. 2007;68(3):920–934. doi: 10.1016/j.ijrobp.2007.01.063. doi: 10.1016/j.ijrobp.2007.01.063. [DOI] [PMC free article] [PubMed] [Google Scholar]
- 10.Nishio T, Sato T, Kitamura H, Murakami K, Ogino T. Distributions of β+ decayed nuclei generated in the CH2 and H2O targets by the target nuclear fragment reaction using therapeutic MONO and SOBP proton beam. Med Phys. 2005;32(4):1070–1082. doi: 10.1118/1.1879692. doi: 10.1118/1.1879692. [DOI] [PubMed] [Google Scholar]
- 11.Cho J, Ibbott G, Gillin M, et al. Determination of elemental tissue composition following proton treatment using positron emission tomography. Phys Med Biol. 2013;58(11):3815–3835. doi: 10.1088/0031-9155/58/11/3815. doi:10.1088/0031-9155/58/11/3815. [DOI] [PMC free article] [PubMed] [Google Scholar]
- 12.Paans AMJ, Schippers JM. Proton therapy in combination with PET as monitor: a feasibility study. IEEE Trans Nucl Sci. 1993;40(4):1041–1044. [Google Scholar]
- 13.Oelfke U, Lam GKY, Atkins MS. Proton dose monitoring with PET: quantitative studies in Lucite. Phys Med Biol. 1996;41(1):177–196. doi: 10.1088/0031-9155/41/1/013. [DOI] [PubMed] [Google Scholar]
- 14.Litzenberg DW, Roberts DA, Lee MY, et al. On-line monitoring of radiotherapy beams: experimental results with proton beams. Med Phys. 1999;26(6):992–1006. doi: 10.1118/1.598491. doi:10.1118/1.598491. [DOI] [PubMed] [Google Scholar]
- 15.Crespo P, Shakirin G, Enghardt W. On the detector arrangement for in-beam PET for hadron therapy monitoring. Phys Med Biol. 2006;51(9):2143–2163. doi: 10.1088/0031-9155/51/9/002. doi:10.1088/0031-9155/51/9/002. [DOI] [PubMed] [Google Scholar]
- 16.Enghardt W, Crespo P, Fiedler F, et al. Charged hadron tumour therapy monitoring by means of PET. Nucl Instrum Methods Phys Res. 2004;525(1):284–288. doi:10.1016/j.nima.2004.03.128. [Google Scholar]
- 17.Enghardt W, Parodi K, Crespo P, Fiedler F, Pawelke J, Pönisch F. Dose quantification from in-beam positron emission tomography. Radiother Oncol. 2004;73(suppl 2):S96–S98. doi: 10.1016/s0167-8140(04)80024-0. doi:10.1016/S0167-8140(04)80024-0. [DOI] [PubMed] [Google Scholar]
- 18.Agostinelli S, Allison J, Amako K, et al. Geant4—a simulation toolkit. Nucl Instrum Methods Phys Res A. 2003;506(3):250–303. doi:10.1016/S0168-9002(03)01368-8. [Google Scholar]


