Abstract
Human pluripotent stem cells hold potential for regenerative medicine, but available cell types have significant limitations. Although embryonic stem cells (ES cells) from in vitro fertilized embryos (IVF ES cells) represent the ‘gold standard’, they are allogeneic to patients. Autologous induced pluripotent stem cells (iPS cells) are prone to epigenetic and transcriptional aberrations. To determine whether such abnormalities are intrinsic to somatic cell reprogramming or secondary to the reprogramming method, genetically matched sets of human IVF ES cells, iPS cells and nuclear transfer ES cells (NT ES cells) derived by somatic cell nuclear transfer (SCNT) were subjected to genome-wide analyses. Both NT ES cells and iPS cells derived from the same somatic cells contained comparable numbers of de novo copy number variations. In contrast, DNA methylation and transcriptome profiles of NT ES cells corresponded closely to those of IVF ES cells, whereas iPS cells differed and retained residual DNA methylation patterns typical of parental somatic cells. Thus, human somatic cells can be faithfully reprogrammed to pluripotency by SCNT and are therefore ideal for cell replacement therapies.
The derivation of human ES cells from in vitro fertilized embryos1 is relevant for cell-based therapies, and while iPS cell technology2,3 overcomes allogenicity issues, a high frequency of genetic and epigenetic abnormalities have been observed, including subchromosomal duplications and deletions detected as copy number variations (CNVs)4,5, protein-coding mutations6 and defects in DNA methylation and gene expression at regions subject to imprinting and X-chromosome inactivation7–10. Although it is not yet understood whether these aberrant epigenetic marks reflect errors arising during reprogramming or incomplete reversion to pluripotency, they could impact the accuracy of in vitro disease modelling or, more importantly, the utility of iPS cells for regenerative medicine. With the availability of somatic cell nuclear transfer as an alternative approach to somatic cell reprogramming11, we explored the mechanisms underlying transcription factor- and SCNT-based reprogramming.
Genetically matched cell lines
In addition to four NT ES cell lines derived from fetal human dermal fibroblasts (HDFs), designated NT1–NT4 (ref. 11), we generated seven iPS cell lines from the same HDFs using retroviral vectors12 (two lines, named iPS-R1 and iPS-R2) and Sendai-virus-based vectors13 (five lines, named iPS-S1, iPS-S2, iPS-S3, iPS-S4 and iPS-S5). Two IVF ES cell lines (human ES Oregon (hESO)-7 and hESO-8) were derived following IVF of oocytes from the same egg donor used for SCNT11. All cell lines maintained typical morphology, expressed pluripotency markers, formed teratomas and retained diploid karyotypes with no detectable numerical or structural chromosomal abnormalities.
Short tandem repeat (STR) genotyping verified that all NT ES cell and iPS cell lines were genetically matched to each other and to HDFs. The one exception to this was iPS-R1, which had a homozygous D3S1768 locus on chromosome 3 (Supplementary Table 1), whereas all other lines were heterozygous at this locus.
SNP genotyping also confirmed that all NT ES cell and iPS cell lines were essentially identical to each other and to the HDFs in terms of their nuclear genomes (>99.96% similarity, Supplementary Table 2). Oocyte and sperm donors showed first-degree genetic relationships to IVF ES cells.
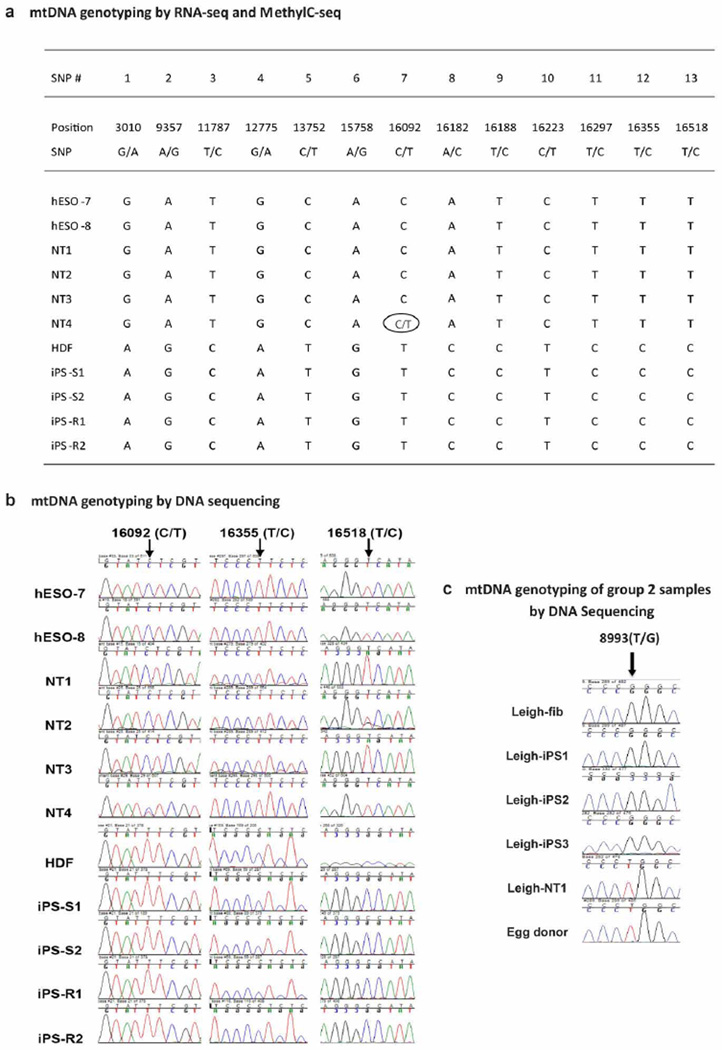
Using whole methylome and transcriptome sequencing, the mitochondrial DNA (mtDNA) in NT ES cells matched those of the IVF ES cells, whereas the iPS cell and HDF sequences differed from those of the IVF ES cells at 13 nucleotide positions (Extended Data Fig. 1a, b). Consistent with previous measurements, we detected a small amount of HDF mtDNA carryover (1–4.9%) in some NT ES cells (Supplementary Table 3).
Subchromosomal aberrations
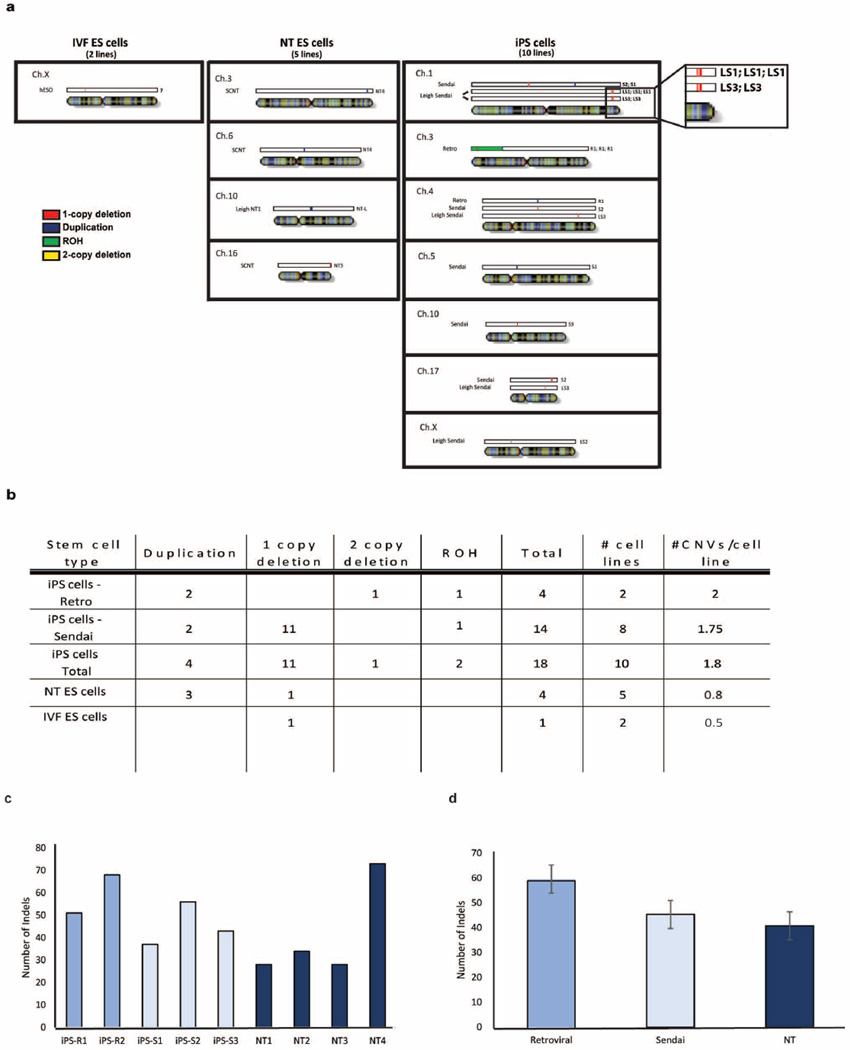
High-throughput SNP genotyping identified ten de novo CNVs in early-passage iPS cells and three in NT ES cells (Extended Data Fig. 2a). NT3 carried a one-copy deletion on chromosome 16, and NT4 had two duplications on chromosomes 3 and 6. Among the iPS cells, iPS-S1 harboured two duplications on chromosomes 1 and 5; iPS-S2 had three one-copy deletions on chromosomes 1, 4 and 17; iPS-S3 carried a single one-copy deletion on chromosome 10; iPS-R1 displayed two duplications on chromosomes 3 and 4, one large run of homozygosity (ROH) encompassing most of the short arm of chromosome 3 and one two-copy deletion within the ROH. This ROH was consistent with STR analysis (Supplementary Table 1). A single one-copy deletion on the X chromosome was identified in human hESO-7. All CNVs were validated using quantitative PCR (qPCR) analysis (Extended Data Table 1).
CNV analysis was extended to a second matched set, consisting of NT ES cell (Leigh-NT1) and iPS cell lines (Leigh-iPS1, Leigh-iPS2 and Leigh-iPS3) derived from a patient with Leigh syndrome11. G-banding did not reveal any numerical or chromosomal abnormalities and STR genotyping corroborated that all lines were from the Leigh patient (Leigh-fib, Supplementary Table 1). Leigh-NT1 carried oocyte mtDNA while all Leigh iPS cells inherited patient mtDNA including the homoplasmic m.8993T>G mutation14 (Extended Data Fig. 1c). Nine de novo CNVs were identified in this data set, including multiple CNVs in Leigh-iPS1 and Leigh-iPS3 and one each in Leigh-iPS2 and Leigh-NT1 (Extended Data Fig. 2a and Extended Data Table 1).
In summary, iPS cells, NT ES cells and IVF ES cells carried an average of 1.8, 0.8 and 0.5 CNVs per line, respectively (Extended Data Fig. 2b), with no statistically significant differences among cell types. InDel analysis using RNA sequencing (RNA-seq) also showed a trend towards fewer mutations in NT ES cells compared with iPS cells, but the differences among cell types were again not statistically significant (P > 0.05, Extended Data Fig. 2c, d). Thus, it seems that the mutagenic and selective pressures for both reprogramming approaches are not statistically different, but this conclusion is limited by the small numbers of cell lines analysed.
Global DNA methylation
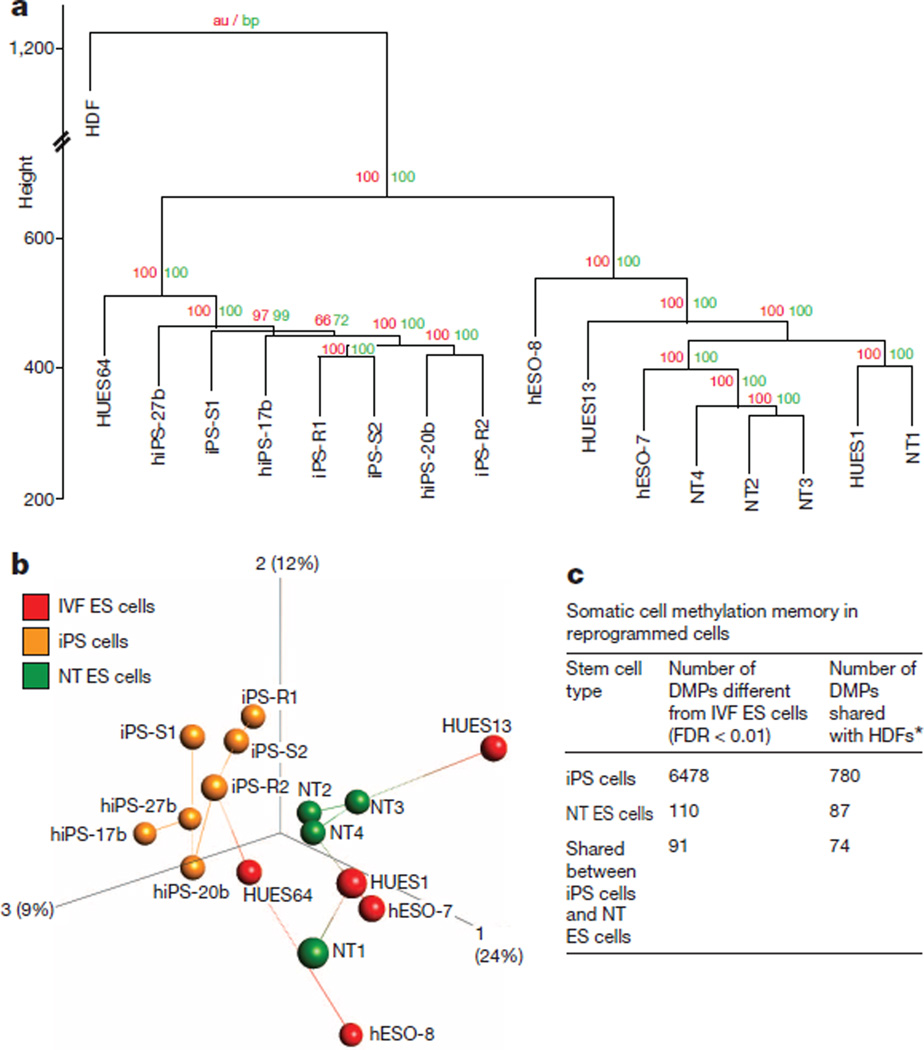
DNA methylation is an important epigenetic mechanism contributing to cell identity, and significant differences have been reported between iPS cells and IVF ES cells7,15. Therefore, we examined genome-wide DNA methylation of our cell lines and compared them to publicly available samples using the Infinium HumanMethylation450 BeadChip. Unsupervised hierarchical clustering16 and bootstrap resampling identified two well defined clusters, one containing all iPS cell lines and one IVF ES cell line from a previous study (HUES64 (ref. 17)), and another with all NT ES cell lines and four IVF ES cell lines (Fig. 1a, b). Intra-group variability was assessed using the coefficient of variation for each stem cell type and was found to be similar to previously reported cell lines17 (iPS cells = 0.71, NT ES cells = 0.73, IVF ES cells = 0.74; iPS cells17 = 0.73 and IVF ES cells17 = 0.72).
Figure 1. Global methylation status.
a, Unsupervised hierarchical clustering of all filtered and normalized methylation probes in five IVF ES cell lines, seven iPS cell lines, and four NT ES cell lines, and in parental HDFs. Red and green values above each edge represent AU (approximately unbiased) and BP (bootstrap probability) P values (%) calculated using bootstrap resampling16. b, Principal component analysis of IVF ES cells (red balls), iPS cells (orange balls), and NT ES cells (green balls) with nearest-neighbour analysis. The percentages in parentheses represent the variance explained by the respective axes. c, Total number of differentially methylated probes (DMPs) observed between matched iPS cells, NT ES cells and IVF ES cells (n = 11, Kruskal–Wallis test, FDR < 0.01). The number of DMPs shared with parental HDFs was used as a measure of the degree of somatic cell memory. *|Average β HDF – average β IVF-ES cells| > 0.3 and |average β iPS cells – average β IVF-ES cells| > 0.3.
Comprehensive group-wise analysis revealed 6,478 differentially methylated probes (DMPs) between iPS cells and IVF ES cells (false discovery rate (FDR) < 0.01; Fig. 1c). Using the same criteria, 110 DMPs were found in NT ES cells, suggesting that NT ES cells are remarkably similar to IVF ES cells. We then asked if the DMPs could be attributed to residual epigenetic memory inherited from HDFs. Of the 6,478 DMPs in iPS cells, 780 displayed a substantial difference in DNA methylation in the same direction between iPS cells and IVF ES cells and between HDFs and IVF ES cells (average β-difference > |0.3|, where β is the ratio of intensities between methylated alleles and the sum of unmethylated and methylated alleles). Of the 110 DMPs in NT ES cells, 87 were substantially different both between NT ES cells and IVF ES cells and between HDFs and IVF ES cells (Fig. 1c). Functional enrichment analysis of probes that were highly methylated in iPS cells and HDFs compared to IVF ES cells indicated association with sequence-specific DNA binding transcription factor activity (2.02-fold enrichment, FDR < 0.0001). No significant annotation terms were found for hypermethylated probes shared by NT ES cells and HDFs. However, probes that were hypomethylated in iPS cells, NT ES cells and HDFs were enriched for loci associated with the major histocompatibility complex (MHC) class II protein complex (72-fold enrichment, FDR < 0.001).
We conclude that methylation profiles of NT ES cells are more similar to IVF ES cells than to iPS cells. Both cell types carry residual HDF epigenetic memory, but iPS cells retain eightfold more of such sites. Interestingly, nearly 80% of DMPs in NT ES cells, but only 12% in iPS cells, could be related to somatic memory, suggesting that the majority of methylation abnormalities in iPS cells result from reprogramming errors.
DNA methylation at imprinted and XCI regions
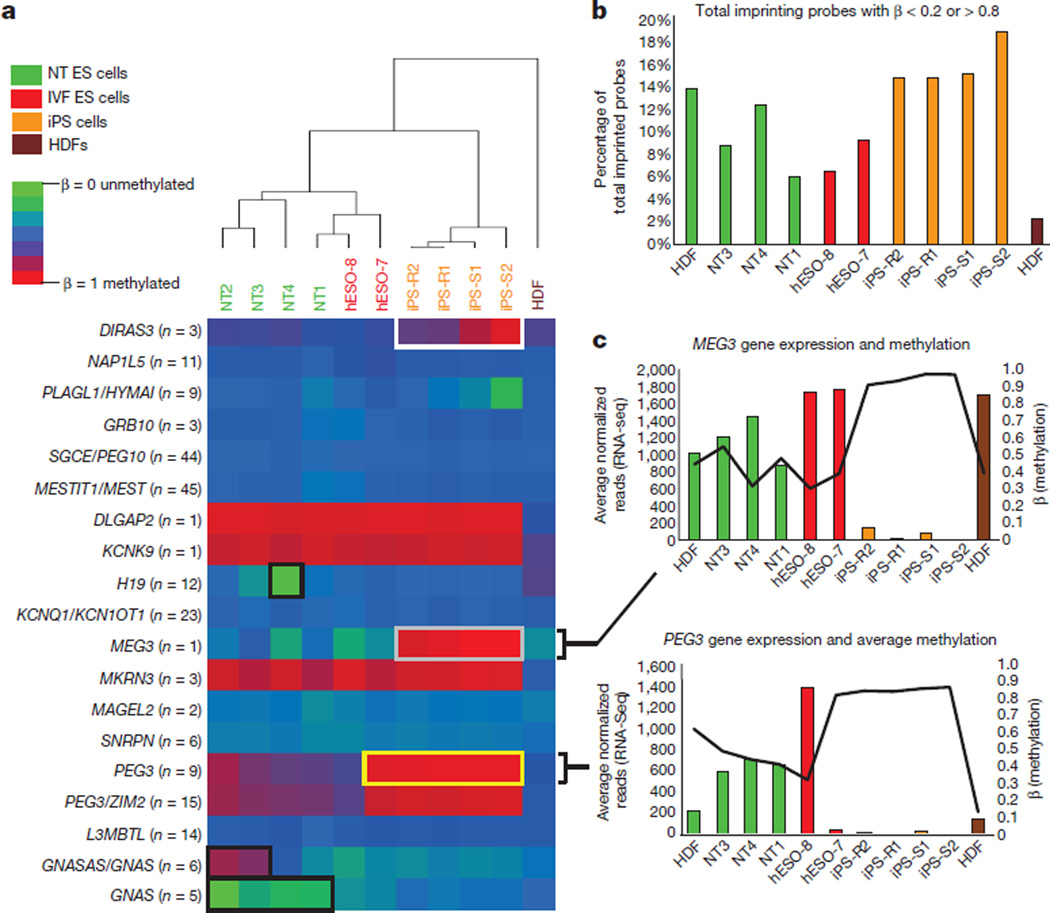
Aberrant methylationat imprinted loci has been observed in iPS cells7,18,19. We interrogated previously identified imprinted regions7,20,21 (Fig. 2a) considering CpGs with a β = 0.2–0.8 on the DNA methylation microarray as partially methylated, >0.8 aberrantly hypermethylated, and <0.2 hypomethylated. Our cell line variances within these imprinted regions were comparable to other independently generated cells17 (our lines, coefficient of variation = 0.27–0.36; coefficient of variation17 = 0.28–0.4). Based on unsupervised hierarchical clustering within imprinted regions, NT ES cell lines grouped closely with IVF ES cells and displayed fewer aberrantly methylated probes compared to iPS cells (Fig. 2a, b).
Figure 2. Methylation at imprinted regions.
a, Heat map of previously identified imprinted regions. For each gene, an average β-value (the ratio of intensities between methylated alleles and the sum of methylated and unmethylated alleles) for all DNA methylation probes assigned to a specific gene is shown and the number of included probes is indicated next to the gene. White box, hypermethylation at DIRAS3 locus, no change in gene expression; black boxes, DNA methylation changes at H19, GNASAS or GNAS, and GNAS loci (no change in gene expression); grey box, hypermethylation at the MEG3 locus (reduced gene expression); yellow box, hypermethylation at the PEG3 locus (reduced gene expression). b, Bar graph showing percentage of total imprinted probes that had a β < 0.2 or > 0.8. c, Bar and line graphs showing the normalized RNA-seq read count (bars, averaged between replicates) and the DNA methylation β-values (black line) for MEG3 and PEG3. Solidus symbols indicate genes with overlapping genomic regions.
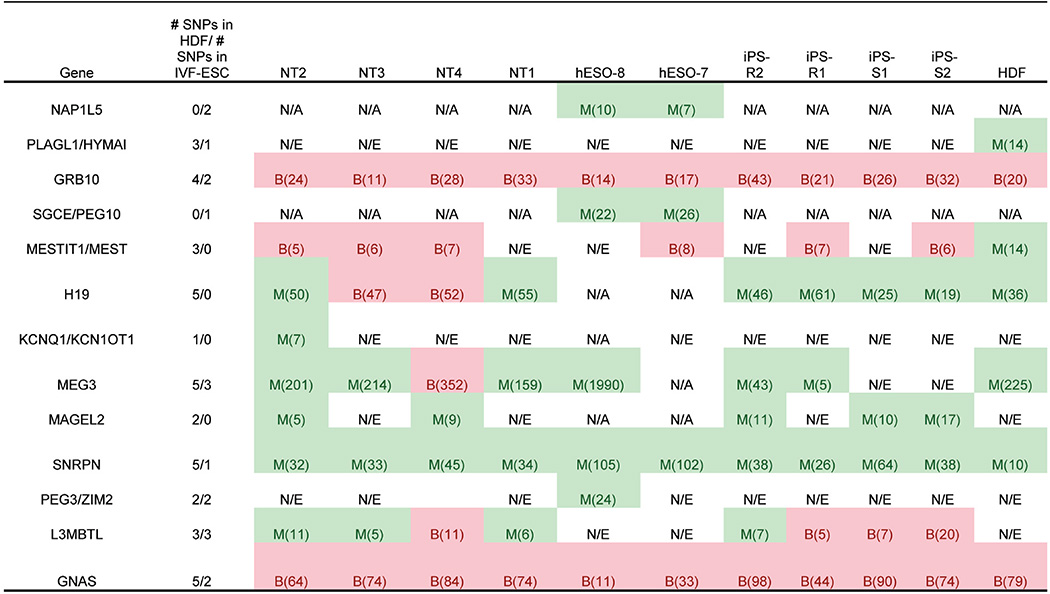
In terms of aberrant DNA methylation at imprinted regions, all NT ES cells displayed hypomethylation atGNAS(also known as GNAS complex locus); NT2 and NT3 were hypermethylated at probes located in the genomic region of GNASAS (also known as GNAS antisense RNA1) and GNAS overlap; and NT4 was hypomethylated at H19 (also known as imprinted maternally expressed transcript (non-protein coding)) (Fig. 2a), which corresponded with bi-allelic expression of this gene (Extended Data Table 2). All iPS cells and the hESO-7 cell line were hypermethylated at PEG3 (also known as paternally expressed 3) (Fig. 2a), while only the iPS cells displayed hypermethylation at MEG3 (also known as maternally expressed 3 (non-protein coding)) (Fig. 2a). These genes displayed reduced expression of corresponding transcripts (Fig. 2c; MEG3 adjusted P < 0.001, average fold change, 19.8; PEG3 adjusted P < 0.005, average fold change, 128.9). The DIRAS3 (also known as DIRAS family, GTP-binding RAS-like 3) locus was hypermethylated in all iPS cells, but a corresponding change in gene expression was not seen (Fig. 2a).
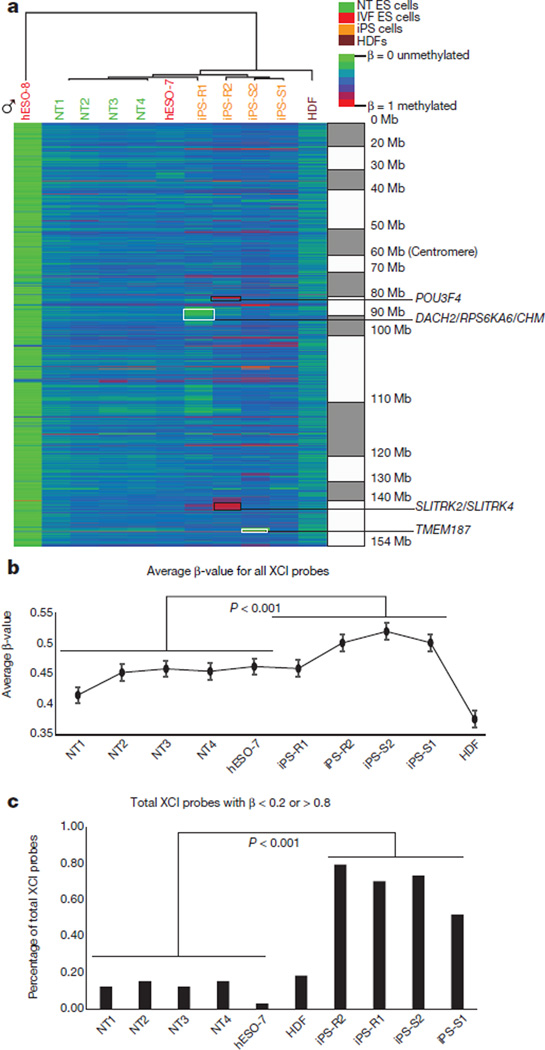
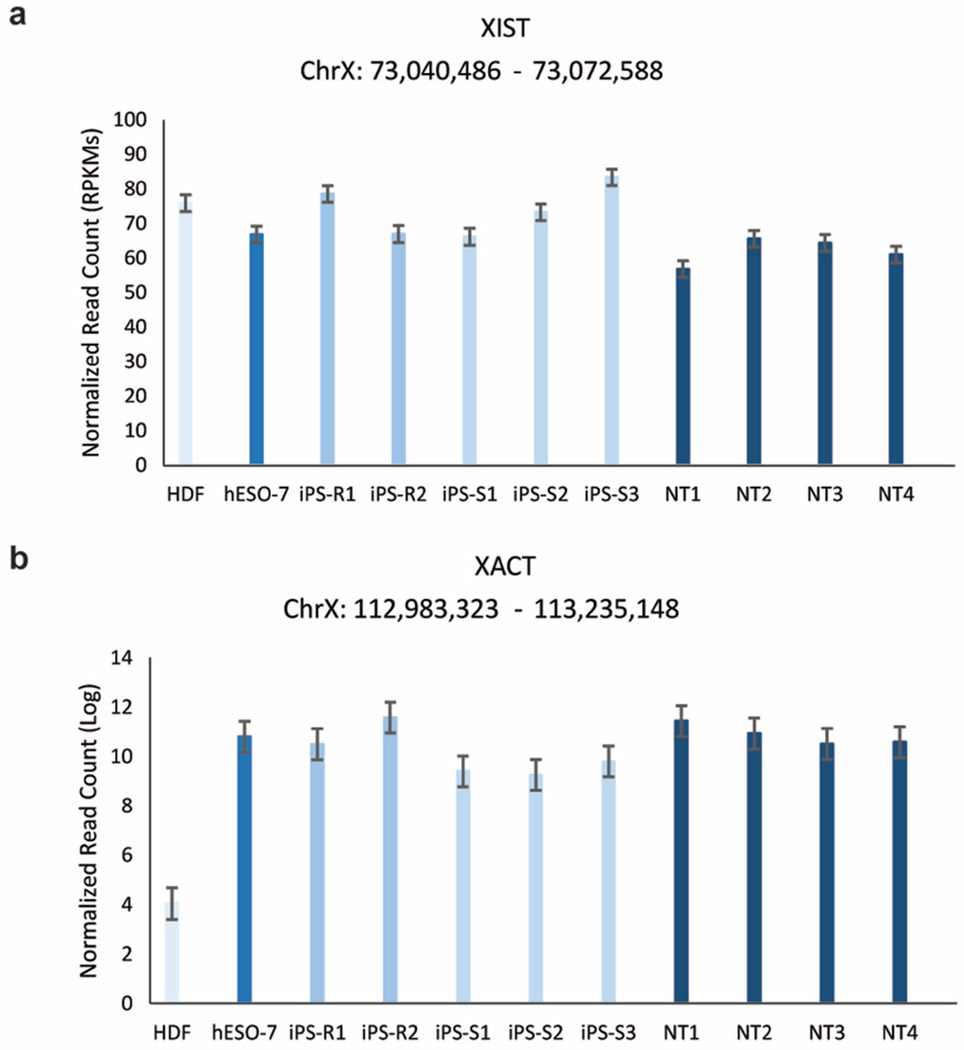
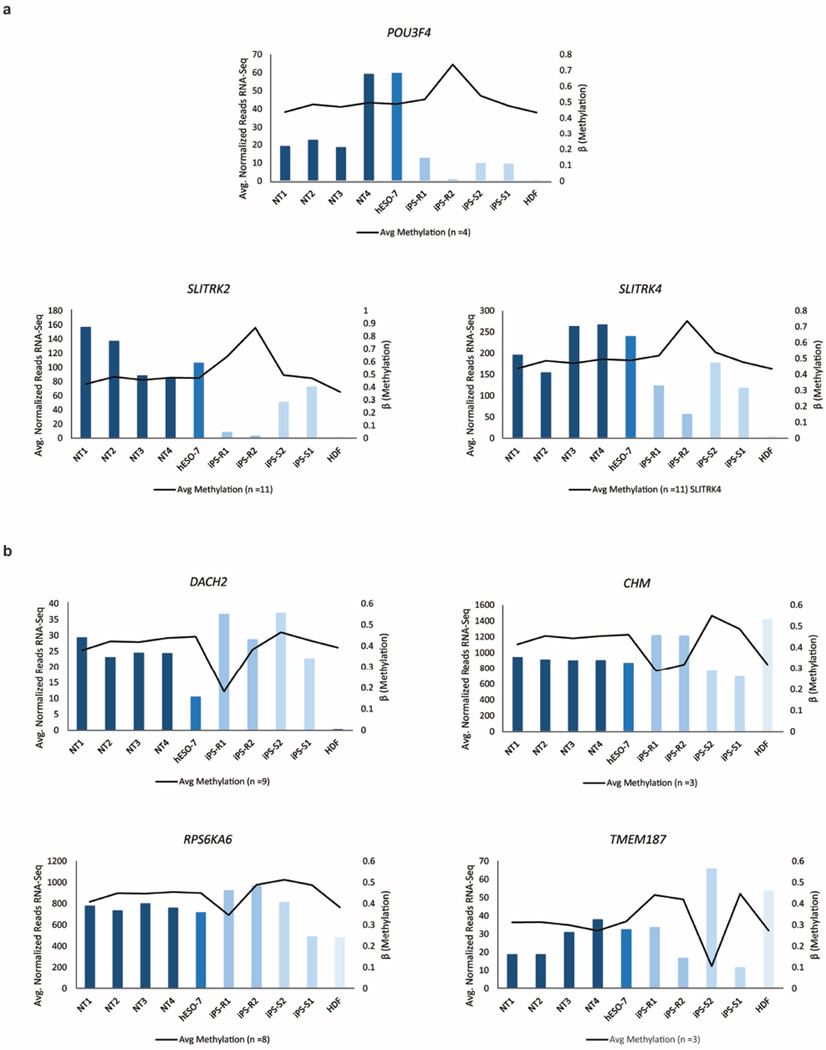
X-chromosome inactivation (XCI) can be detected by allele-specific expression and coating of the X chromosome by the long noncoding RNAs XIST (also known as X inactive specific transcript (non-protein coding)) and XACT22,23. Based on RNA-seq, all female cells in our dataset expressed similar levels of XIST, but only pluripotent cells expressed XACT (Extended Data Fig. 3a, b). hESO-8 (male) was unmethylated at previously annotated XCI loci7, whereas all female lines were predominantly partially methylated (β = 0.2–0.8; Fig. 3a). NT ES cells and IVF ES cells demonstrated higher DNA methylation levels at XCI loci compared to HDFs. However, methylation levels in iPS cells were significantly higher than in NT ES cells and female hESO-7 (Fig. 3b, P<0.001), with substantial variation among lines. With aberrant methylation defined as β < 0.2 or >0.8, NT ES cells and hESO-7 had fourfold fewer aberrations than iPS cells (Fig. 3c, P < 0.001). POU3F4 (also known as POU class 3 homeobox 4), SLITRK2 (also known as SLIT and NTRK-like family, member 2) and SLITRK4 (also known as SLIT and NTRK-like family, member 4) hypermethylation in iPS-R2 correlated with lower gene expression while hypomethylation of DACH2 (also known as Dachshund homologue 2), RPS6KA6 (also known as ribosomal S6 kinase 4) and CHM (also known as choroideremia rab escort protein 1) in iPS-R1 and TMEM187 (also known as transmembrane protein 187) in iPS-S2 correlated with increased gene expression (Fig. 3a and Extended Data Fig. 4a, b).
Figure 3. Methylation at X-chromosome inactivation sites.
a, Heat map displaying β-values of previously identified XCI probes on the DNA methylation array in NT ES cells, IVF ES cells, iPS cells and HDFs. The genes highlighted with black boxes showed both aberrant hypermethylation and corresponding changes in gene expression. The hypomethylated genes highlighted in white boxes were associated with corresponding changes in gene expression. b, Line graph showing an average β-value for all XCI probes for each cell line (two-sided t-test, P < 0.001, error bars s.e.m.). c, The percentage of total XCI probes with β < 0.2 or > 0.8 (two-sided t-test, P < 0.001).
Autosomal non-imprinted loci
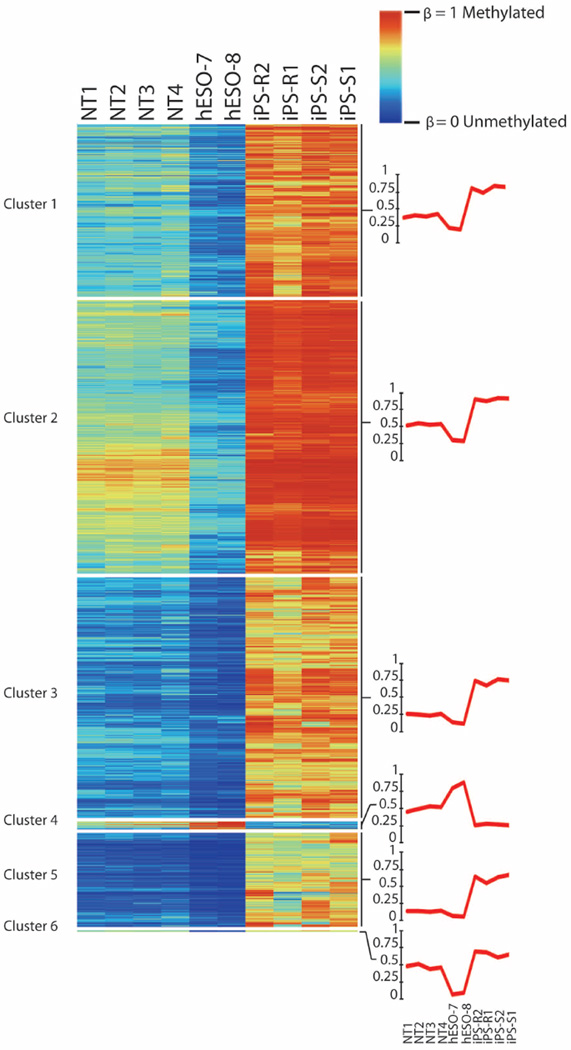
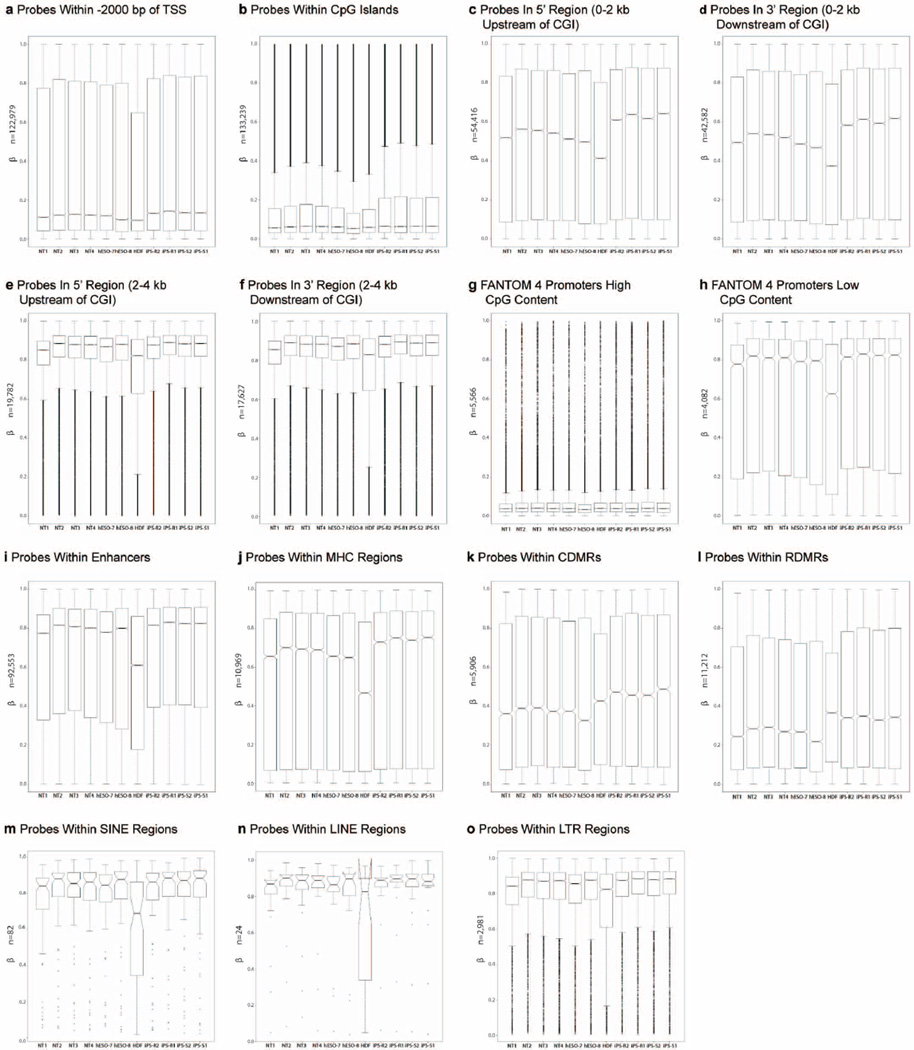
Differential DNA methylation analysis of autosomal non-imprinted sites revealed 1,621 DMPs between our groups (Kruskal–Wallis test, P < 0.01, Δβ > 0.5). We grouped these probes into six major clusters using an unsupervised self-organizing map algorithm24 (Extended Data Fig. 5). All six clusters were analysed for cis-regulatory functional enrichments using GREAT25, but only cluster 3 showed significant enrichments for categories associated with morphogenesis and neural development (Supplementary Table 4). iPS cells displayed higher DNA methylation levels compared to NT ES cells and IVF ES cells for most clusters, with the exception of cluster 4, in which the highest DNA methylation was seen in the IVF ES cells. NT ES cells displayed intermediate DNA methylation, but overall were closer to IVF ES cells. We examined several different probe subsets, and noted higher methylation levels in iPS cells compared to IVF ES cells, as reported previously26,27 (Extended Data Fig. 6a–o).
Whole-genome bisulphite sequencing
To gain a more detailed picture of the underlying methylation differences in our cells, we generated high-coverage base-resolution methylomes (14× to 25×) using MethylC-seq8. We also assessed the methylomes of three additional IVF ES cells (H1, H9 and HUES6)28–30. Hierarchical clustering at CG differentially methylated regions (DMRs) demonstrated that the methylation landscape of NT ES cells more closely matched IVF ES cells compared to iPS cells (Fig. 4a). By comparing the methylomes and filtering regions that were obscure or highly variable in IVF ES cells, 678 CG DMRs were identified (Supplementary Table 5) that were present in at least one NT ES cell or iPS cell line but not in IVF ES cells (FDR = 0.01). Most of these CG DMRs were identified within iPS cells (619), whereas NT ES cells contained threefold fewer (212) and 153 CG DMRs were shared (Fig. 4b). Using a similar approach, we calculated that five previously profiled iPS cells8 carried a total of 792 CG DMRs, suggesting that both iPS cell groups are comparable. Most of the CG DMRs were localized within CG islands and gene bodies (Fig. 4c). Analysis of CG-DMR distribution among individual cell lines showed that each NT ES cell line had fewer aberrant regions than any of the iPS cell lines (Fig. 4d, P = 0.0147, Mann–Whitney test). CG DMRs were then assigned into three groups: memory DMRs (mDMRs; shared with HDF), NT-specific DMRs (ntDMRs) and iPS-cell-specific DMRs (iDMRs). On average, 38% of total CG DMRs in the NT ES cell lines and 22% of DMRs in iPS cells were mDMRs (Fig. 4d).
Figure 4. CG DMRs across NT ES cells and iPS cells.
a, Complete hierarchical clustering of CG methylation for a total 678 CG DMRs identified by comparing methylomes of NT ES cells and iPS cells to IVF ES cells. b, Venn diagram showing the overlap of CG DMRs across iPS cells and NT ES cells in cases in which the DMR is found in at least one of the lines in the same group. c, The number of 678 CG DMRs that overlapped (at least 1 bp) with indicated genomic features. CGI, CG islands; TES, transcription end sites; TSS, transcription start sites. d, Distribution of CG DMRs among each NT ES cell and iPS cell line. DMRs that were also shared with parental somatic cells were identified as memory or mDMRs. Other DMRs were then assigned into NT-specific DMRs (ntDMRs) and iPS-cell-specific DMRs (iDMRs) if the DMRs were present in NT ES cell lines and iPS cell lines, respectively. e, The Venn diagram shows the hotspot CG DMRs that were identified in every iPS cell or NT ES cell line in the same group. Hotspot CG DMRs (48) were shared among all iPS cell and NT ES cell lines.
Inspection of the recurrent CG DMRs (hotspot DMRs8) in every iPS cell or NT ES cell line revealed that NT ES cell lines had 50 hotspot DMRs, or twofold fewer than iPS cells (104) (Fig. 4e). Interestingly, 48 of 50 hotspot DMRs in NT ES cells were also shared with iPS cells (P < 0.001, Hypergeometric test). Of the hotspot DMRs shared among all 8 cell lines 63% (30 out of 48) were mDMRs, suggesting regions resistant to reprogramming by either approach. Only 2 (4%) hotspot DMRs were unique to NT ES cells compared to 56 (54%) iPS-cell-specific hotspots (Fig. 4e).
Non-CG methylation in NT ES cells
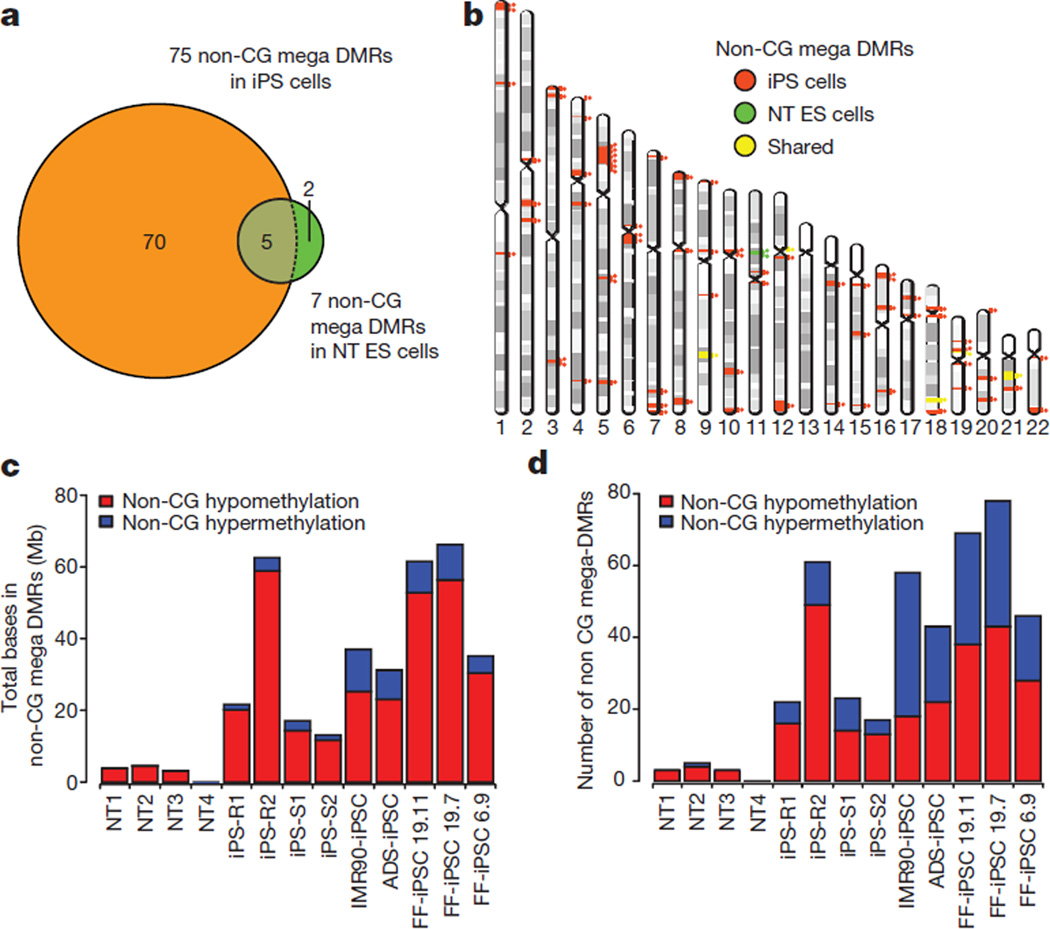
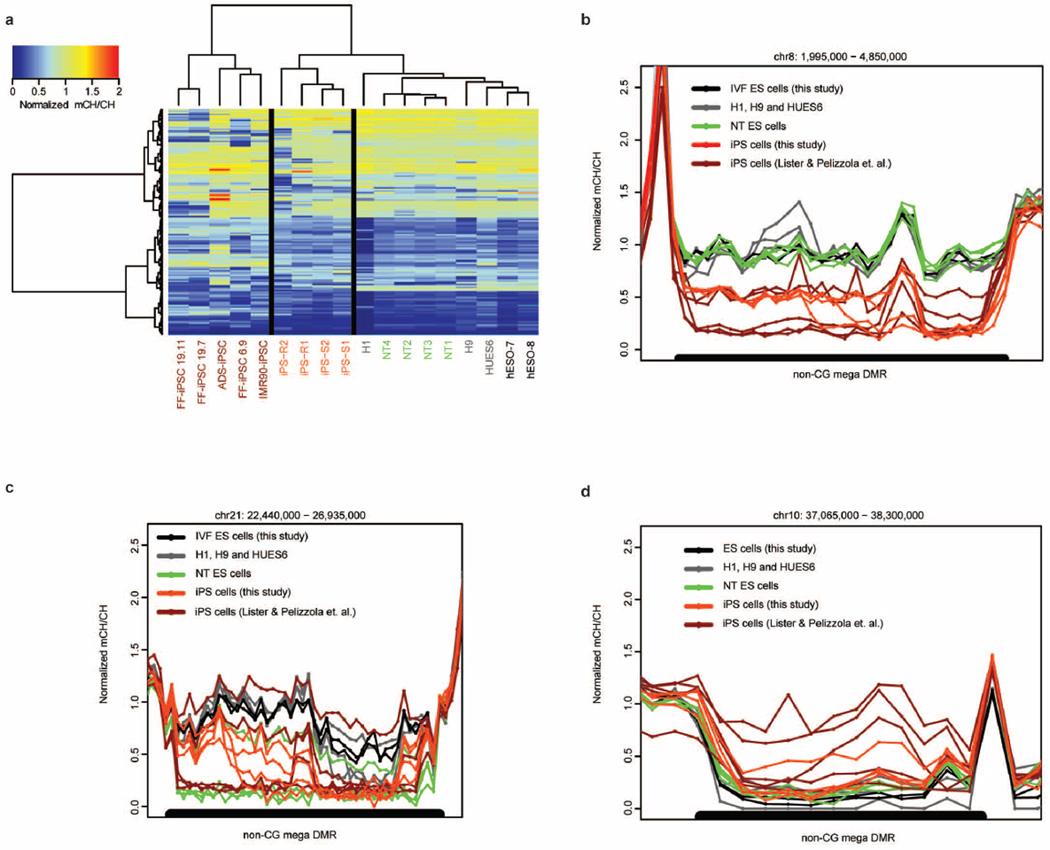
We previously identified pervasive and exclusive non-CG methylation in pluripotent cells31. We also reported that iPS cells carry frequent aberrant non-CG methylations8. We identified regions showing megabase-scale non-CG methylation differences (non-CG mega DMRs) in NT ES cells and iPS cells when compared to IVF ES cells. Five IVF ES cell lines, two from this study and the three described previously, served as our control methylation landscape28–30. Autosomal non-CG mega DMRs (150) were identified when the methylomes of 13 iPS cell lines and NT ES cell lines were compared to controls (Extended Data Fig. 7a and Supplementary Table 6). Non-CG mega DMRs linked to the sex chromosomes were excluded due to the mixed gender of controls. A total of 150 autosomal non-CG mega DMRs covered 123 megabases (Mb) of genome and included all regions reported previously8 (99% of bases); of these, 77 non-CG mega DMRs were identified from the iPS and NT cells, 70 of which occurring exclusively in iPS cells (Fig. 5a). These DMRs were distributed on every autosomal chromosome except chromosome 13 (Fig. 5b). Only 7 non-CG mega DMRs (tenfold less) were present in NT ES cells. Consistent with our previous findings8, non-CG mega DMRs were significantly closer to centromeric and telomeric regions compared with shuffled non-CG mega DMRs (Fig. 5b, P < 0.001). We also observed several different patterns of aberrant non-CG methylation, including hypomethylation in iPS cells only, or in both NT ES cells and iPS cells, and hypermethylation in iPS cells only (Extended Data Fig. 7b, c, d). However, the vast majority of non-CG mega DMRs (92.5% of total bases) were hypomethylated in iPS cells and/or NT ES cells compared with IVF ES cells (Fig. 5c).
Figure 5. Non-CG mega DMRs in NT ES cells and iPS cells.
a, Venn diagram showing the overlap of the 77 non-CG mega DMRs identified in the iPS cell and the NT ES cell lines from this study. Numbers within circles denote DMRs identified exclusively within each group. Five DMRs were shared among all cell lines in both groups. b, Chromosome ideogram showing the location of the 77 non-CG mega DMRs found in both NT ES cell and iPS cell lines from this study. Orange circles and lines indicate the location of the individual DMRs specific for iPS cells; green circles and lines denote those specific for NT ES cells and yellow circles and lines are DMRs shared by both cell types. c, Total length of the non-CG mega DMRs identified in 4 NT ES cell and 9 iPS cell lines. The NT ES cells had a significantly lower size of DMRs (Mann–Whitney test, P < 0.005) compared to the iPS cells. FF, foreskin fibroblasts. d, Total number of the non-CG mega DMRs identified in the cell lines. The NT ES cells had a significantly lower number of DMRs (Mann–Whitney test, P < 0.005) compared to the iPS cells.
We asked whether methylomes from our four iPS cells were similar to other iPS cells8. The former contained a total of 75 DMRs, while the latter carried 121, indicating that despite different somatic cell origin and culture conditions, iPS cells carried similar levels of aberrant non-CG methylation. In contrast, NT ES cells showed the least amount of aberrant non-CG methylation (Fig. 5c, d; P < 0.005). Hierarchical clustering for all non-CG mega DMRs also supported the conclusion that the NT ES cells are more similar to IVF ES cells (Extended Data Fig. 7a).
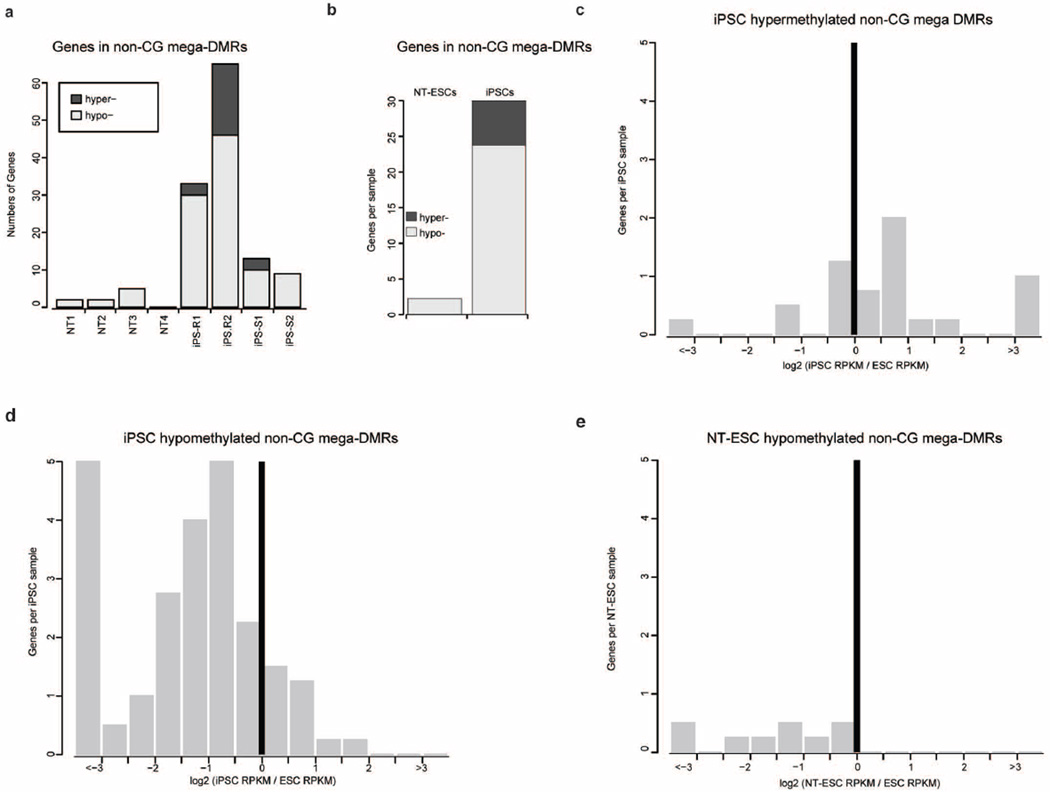
To understand the functional impact of non-CG mega DMRs, we focused on transcriptional activity within those regions. On average, 2 genes in NT ES cells and 30 in iPS cells were located within non-CG mega DMRs, implying that fewer genes in NT ES cells are affected (Extended Data Fig. 8a, b; P = 0.0147). Gene ontology analysis32 for genes in hypomethylated non-CG DMRs revealed that these genes were related to olfactory transduction, epidermal cell differentiation, cytoskeleton, immunoglobulin and homeobox proteins (FDR ≤ 0.001; Supplementary Table 7). Gene expression in the iPS cells for 2 genes in the hypermethylated non-CG mega DMRs was upregulated (Extended Data Fig. 8c, P < 0.05), whereas expression of 24 genes in the iPS cells and 6 genes in the NT ES cells in the hypomethylated non-CG mega DMRs were down regulated (Extended Data Fig. 8d, e; P < 0.001). These observations indicate that NT ES cells were more faithfully reprogrammed to a state closely matching IVF ES cells compared to iPS cells. Particularly, NT4 had the least aberrant methylation in both CG and non-CG contexts.
Global gene expression
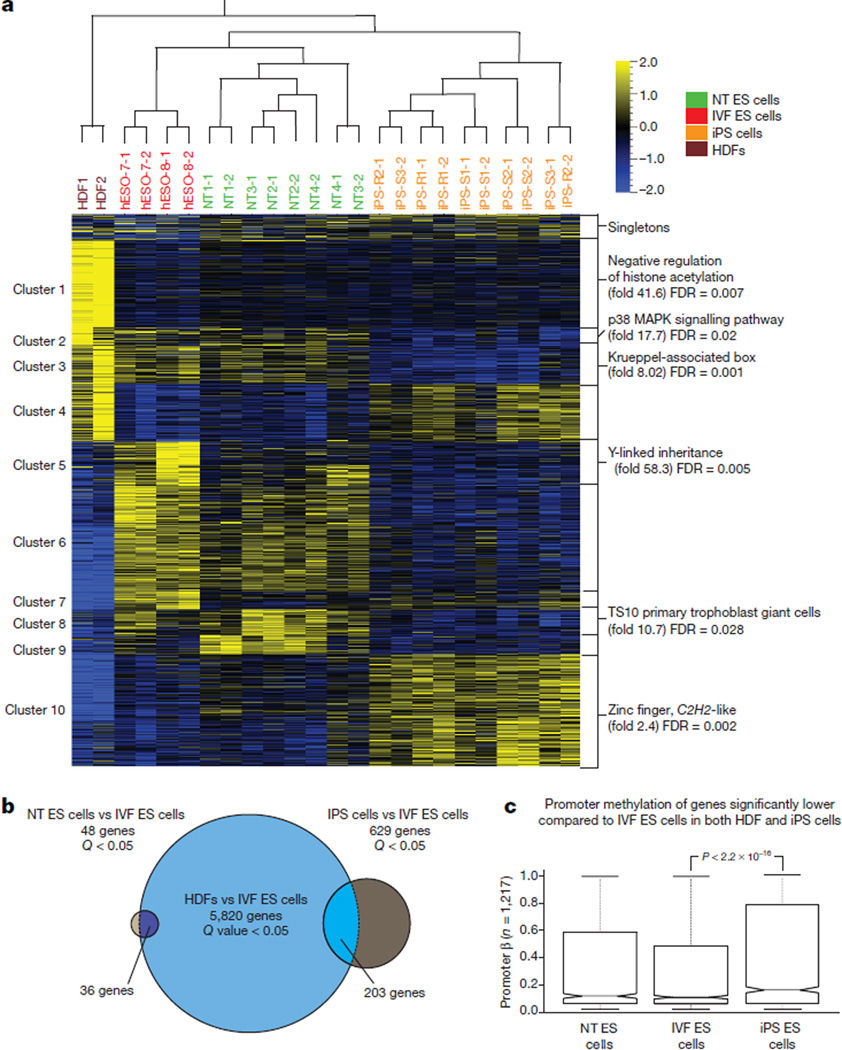
Lastly, we examined global gene expression patterns from strand-specific RNA-seq. Consistent with DNA methylation, intra-group variability was similar among cell types (coefficients of variation: NT ES cells = 1.41, IVF ES cells = 1.45, iPS cells = 1.44) and unsupervised hierarchical clustering positioned NT ES cells closely with IVF ES cells (Fig. 6a). Differential expression analysis (FDR < 0.05) yielded 1,220-transcripts, grouped into 10 clusters. The majority (65%) of these genes were either significantly upregulated or down regulated in iPS cells compared to NT ES cells and IVF ES cells. Clusters 2 and 3 showed higher gene expression in NT ES cells and IVF ES cells compared to iPS cells; when subjected to functional enrichment analysis, these clusters were associated with p38 MAPK signalling pathway genes (FDR = 0.02; n = 51) and Krueppel-associated box genes (FDR = 0.001; n = 91). Cluster 10 contained transcripts that were upregulated in IVF ES cells compared to both NT ES cells and iPS cells and included genes associated with zinc finger and C2H2-like genes (FDR = 0.002; n = 227). Cluster 8 was enriched for MGI expression of TS10 primary trophoblast giant cells (FDR = 0.03; n = 46) and cluster 5 was associated with Y-linked inheritance.
Figure 6. Gene expression analysis by RNA-seq.
a, Heat map displaying 1,220 differentially expressed genes between NT ES cells, iPS cells and IVF ES cells (n = 22) (ANOVA adjusted p-value <0.05). Genes were clustered into ten-groups for functional analysis and presented as a heat map. Cluster 4, 6, 7, and 9 showed no significant functional enrichments. b, Venn diagram showing the number of genes differentially expressed between the HDFs and the IVF ES cells (large circle), the iPS cells and the IVF ES cells (medium circle) and the NT ES cells and IVF ES cells (small circle; t-test FDR <0.05). Overlapping regions represent the number of genes differentially expressed in both the HDFs and either the NT ES cells or iPS cells. c, Notched box plots represent the β-value of all probes in the promoter regions (−2,000 bp to 500 bp) of the genes that were expressed at significantly lower levels (t-test FDR < 0.05) in both the HDFs and the iPS cells (exhibiting transcriptional memory) when compared to the IVF ES cells. The box represents the interquartile range (25th to 75th percentile), and the line within the box marks, the median. The notch in the box represents the 95% confidence interval around the median. The whiskers above and below the box contain 99.3% of the data and the number of CpGs interrogated is shown on the y axis.
Based on differential expression analysis, we searched for genes displaying transcriptional memory in both iPS cells and NT ES cells. Three separate t-tests between HDFs and IVF ES cells, NT ES cells and IVF ES cells and iPS cells and IVF ES cells were conducted at a FDR cut-off of 0.05. We found 24 genes that were expressed at significantly lower levels in the NT ES cells and HDFs compared to IVF ES cells, probably indicating incompletely reactivated genes, and 12 genes that were expressed at significantly higher levels representing incompletely silenced genes (Fig. 6b). In contrast, 171 genes were incompletely reactivated and 32 were incompletely silenced in iPS cells.
We found that incompletely reactivated genes in iPS cells also retained significantly higher promoter methylation (P < 2.2 × 10⁻¹⁶, Mann–Whitney test), possibly indicating incomplete demethylation during reprogramming (Fig. 6c). Overall, the gene expression and DNA methylation results were consistent, both suggesting that NT ES cells are more similar to IVF ES cells than to iPS cells.
Conclusions
Here, we showed that transcription-factor-based reprogramming is associated with incomplete epigenetic reprogramming. In contrast, the same somatic cells reprogrammed by SCNT displayed epigenetic and transcriptional signatures remarkably similar to those of IVF ES cell controls.
Both NT ES cells and iPS cells contained similar levels of de novo CNVs, with some lines (iPS-R2, iPS-S4, iPS-S5 and NT1 and NT2) displaying no detectable alterations. This observation indicates that screening of multiple cell lines may allow recovery of genetically normal lines. However, CNV analysis does not completely exclude the presence of point mutations, small indels, or translocations. Indeed, exome sequencing has demonstrated that iPS cells carry, on average, six non-synonymous point mutations per line33.
Using genome-wide microarray-based DNA methylation as an indicator of reprogramming, we demonstrated that NT ES cells undergo more complete reprogramming than iPS cells. We also confirmed the persistence of somatic patterns of CpG methylation in human iPS cells, consistent with a mouse study34. Although NT ES cells also carried evidence of epigenetic memory, iPS cells contained eightfold more CpG sites that retained the DNA methylation pattern of parental HDFs. Whole-genome bisulphite sequencing was consistent with the DNA methylation microarray analysis, showing that iPS cells carried threefold more aberrant CG and tenfold more aberrant non-CG methylation compared to NT ES cells, indicating that SCNT reprogramming is capable of resetting the DNA methylation and corresponding gene expression program more faithfully than iPS cell reprogramming.
An explanation for this more effective reprogramming by SCNT is that the ooplasm provides ‘physiologic’ levels of reprogramming factors that are upstream of pluripotency. It has been suggested that oocyte factors rapidly demethylate the somatic genome, whereas this process occurs passively during factor-based reprogramming34. Clearly, elucidation of oocyte-based reprogramming mechanisms will support the development of improved reprogramming protocols.
In summary, although IVF ES cells most closely resemble cells residing in embryos, they are allogeneic. Human iPS cells might remain the most facile cell type for many in vitro applications, but show extensive epigenetic and transcriptomic aberrations compared to NT ES cells and IVF ES cells. NT ES cells combine significant advantages of both types; epigenetic stability of IVF ES cells and the histocompatible nature of iPS cells. Further studies on additional NT ES cell lines, especially lines derived from aged patients, and their differentiation potential are now warranted.
Online Content Methods, along with any additional Extended Data display items and Source Data, are available in the online version of the paper; references unique to these sections appear only in the online paper.
METHODS
The study protocols and informed consent for human subjects were approved by the OHSU Embryonic Stem Cell Research Oversight Committee and the Institutional Review Board.
Generations of iPS cells
Fetal origin human dermal fibroblasts (HDFs) were acquired from ScienCell Research Laboratories (catalogue no. 2300). Leigh fibroblasts were acquired from Coriell Cell Repositories (catalogue no. GM13411). The HDFs and the Leigh fibroblasts were cultured in DMEM F12 with 10% fetal bovine serum (FBS). Cells were transduced by retro virus-based iPS cell vectors as reported previously12. Sendai-virus-based reprogramming was carried out according to the manufacturer’s protocol (CytoTune-iPS Reprogramming Kit, Life Technologies). Colonies with typical ES cell morphology were isolated and manually propagated similar to NT ES cell and IVF ES cell protocols11. All cell lines were propagated in Knockout DMEM medium (Invitrogen) supplemented with 20% of knockout serum replacement (KSR), 0.1 mM nonessential amino acids, 1 mMl-glutamine, 0.1 mM b-mercaptoethanol, 1× penicillin–streptomycin and 4 ng ml−1 basic fibroblast growth factor. All cell-line derivation, culture and DNA and RNA isolations were conducted in the Mitalipov laboratory.
DNA methylation microarray analysis and statistics
DNA was purified from early passage cells (8–10) (QIAGEN Gentra Puregene Cell Kit), quantified (Qubit dsDNA BR Assay Kits, Life Technologies) and bisulphite-converted (EZDNA Methylation Kit, Zymo Research) according to the manufacturer’s protocol. Bisulphite-converted DNA was hybridized to the Infinium HumanMethylation 450K beadchip (Illumina) and scanned on a HiScan (Illumina). All samples passed GenomeStudio (Illumina) quality-control steps based on built-in control probes. Data obtained from our eleven samples were combined with three IVF ES cell lines and three iPS cell lines (HUES64, hiPS-27b, hiPS-17b, hiPS-20b, HUES13 and HUES1)17 for hierarchical clustering and principle component analysis. We performed pre-processing and normalization using the statistical programming language R (http://www.r-project.org/) (v.3.0.1) and the R package minfi (v.1.6.0). In brief, intensity data files (.idat) were control-normalized and probes with detection P > 0.01 in at least one sample were discarded. The samples were then normalized using the SWAN normalization option in the minfi package andM values were exported. The R script, ComBat35 was used to eliminate batch effects between our samples and the six additional samples. Global differential methylation probe analysis was done on our eleven samples using the dmpFinder function in minfi. Probes were considered differentially methylated if Q <0.01. Differential methylation was considered to have residual epigenetic memory if (|average β HDF − average β IVF ES cells| > 0.3) AND (|average β iPS cells − average β IVF ES cells| > 0.3) or (|average β HDF − average β IVF ES cells| > 0.3) AND (|average β NT ES cells − average β IVF ES cells| > 0.3). For autosomal non-imprinted loci, the probes were annotated36 and probes with a documented SNP at the target CpG, probes that contained two or more SNPs, non-CpG probes, sex chromosome probes, and probes that mapped to multiple locations were removed. Hierarchical clustering was performed with the R package pvclust, with Euclidian distance and complete linkage. The somatic HDF sample was then removed and the remaining probes were filtered in Cluster 3.0 software16 using a standard deviation filter of one. A Kruskal–Wallis test was then applied in R, andQ values were estimated using the R package Q value. Because β values are easier to interpret biologically, in the figures and results, we converted M values back to β values using the equation, β = 2M/2M + 1. To filter further the number of probes before clustering with an unsupervised self-organizing map algorithm24, the four NT ES cells samples, the two IVF ES cells samples and the four iPS cell samples were averaged and then only probes with a maximum – minimum value greater than 0.5 were clustered. The HDF sample was then added back for visualization purposes. Principle component analysis (PCA) plots were made using Qlucore Omics Explorer 2.3, each variable was standardized by subtraction of its mean value and division by its standard deviation across all samples, and heat maps were produced using Java TreeView (v.1.1.5r2)21 and AutoSOME (v.2.1)24. All enrichment analysis was performed using GREAT (v.2.0.2)25 with default settings. X chromosome inactivated and imprinted probes were obtained from ref. 7 and were analysed separately. X-chromosome-inactivated probes were filtered using a 0.25 variance filter after removing the male hESO-8 and HDF samples. Allelic expression was determined using the heterozygous SNPs on the Illumina Omni5 genotyping array found within the imprinted genes. To use a SNP, at least two RNA-seq reads needed to cover the SNP and at least five total RNA-seq reads (when adding all the SNPs within the gene) were required. For biallelic expression, we required at least one SNP to have over 20% of its overlapping RNA-seq reads expressing the alternative allele.
RNA-seq library construction
RNA was isolated (passage 8–10) (TRIzol Reagent, Life Technologies), quantified (Qubit RNA Assay Kit, Life Technologies) and quality controlled (RNA6000 Nano Kit and BioAnalyzer 2100, Agilent). RNA (500 ng) from each sample was used as input for the Illumina TruSeq Stranded messenger RNA LT Sample Prep Kit (Illumina) and sequencing libraries were created according to the manufacturer’s protocol. Briefly, poly-A containing mRNA molecules were purified using poly-T oligo-attached magnetic beads. Following purification, the mRNA was fragmented and copied into first strand complementary DNA using random primers and reverse transcriptase. Second strand cDNA synthesis was then done using DNA polymerase I and RNase H. The cDNA was ligated to adapters and enriched with PCR to create the final cDNA library. The library was pooled and sequenced on a HiSeq 2000 (Illumina) instrument per the manufacturer’s instructions. Sequencing was performed up to 2 × 101 cycles.
RNA-seq data processing
The RNA-seq reads were trimmed and mapped to the hg19 reference using STAR (v.2.3.0.1). On average, approximately 23 million reads were generated per sample, and 76% of these reads were uniquely mapped. Expression levels for each gene were quantified using the python script rpkmforgenes and annotated using RefSeq (archive-2012-03-09-03-24-410). Genes without at least one sample with at least ten reads were removed from the analysis. The data was then normalized using the R (v.3.0.1) package DESeq (v.1.12.0) and then batch corrected using the R script ComBat35. Differential expression analysis was carried out using ANOVA in Qlucore Omics Explorer 2.3. Transcripts with a Q value of less than 0.05 were considered differentially expressed. Differentially expressed genes were then clustered using the CLICK algorithm in Expander (v.6.06) with an expected mean homogeneity of 0.75. PCA and heatmaps were constructed using Qlucore Omics Explorer 2.3. Each variable was standardized by subtraction of its mean value and division by its standard deviation across all samples. All enrichment analysis was performed using GREAT (v.2.0.2)25 with default settings.
InDel analysis by RNA-seq
InDels were called for each sample by first mapping the RNA-seq reads using STAR (v.2.3.0.1) with stringent parameters (--scoreDelOpen −1 --scoreDelBase −1 --scoreInsOpen −1-- scoreInsBase −1 --scoreGap −2 --scoreGapNoncan −100 --alignIntronMax 100000 --seedSearchStartLmax 25 --outFilterMatchNmin 95) designed to limit the number of false positive InDels. Additionally, the RNA-seq reads were also trimmed using FASTX (v.0.0.13) and TrimGalore (v.0.2.2) and then mapped to the hg 19 reference genome using Tophat (v.2.0.6). The reads were then sorted, merged, deduplicated and mpileup files were created using Samtools (v.0.1.17). The mpileup files were then run through VarScan (v.2.3.6) with a P-value filter of 0.01 to call InDels. An InDel was considered only if it met the following criteria: it was not called in the parental HDF lines; it was called using both mapping programs; and it was called in both replicate samples. Five percent of InDels passing the above filtering steps were then verified using the IGV genome browser (v.2.3).
Mitochondrial DNA SNP analysis by RNA-seq
Mapped and deduplicated .bam files were filtered for reads that mapped to human mtDNA using BamTools (v.1.0). These reads were then viewed in Integrated Genomics Viewer (v.2.3) and counts were recorded for differences between hg19 and any of our eleven samples.
SNP genotyping and copy-number-variation assessment
SNP genotyping was performed on the Illumina Omni5, which interrogates 4.3 million SNPs across the human genome. All DNA was isolated (QIAGEN Gentra Puregene Cell Kit) except the sperm sample (PicoPure DNA Extraction Kit, Life Technologies), and quantified (Qubit dsDNA BR Assay Kits, Life Technologies) according to the manufacturer’s protocol. Input genomic DNA (500 ng) was processed according to the manufacturer’s instructions, hybridized to the array and scanned on an Illumina HiScan. Genotyping calls were made with GenomeStudio (Illumina) via the cluster files provided by the manufacturer. The GenCall (v.6.3.0) threshold was set to 0.15, and the call rates were greater than 0.998. Reproducibility and heritability were calculated in GenomeStudio (Illumina). CNVs were identified using the cnvPartition Plug-in v.3.2.0 in GenomeStudio (Illumina). The cnvPartition confidence threshold was set at 100, with a minimum number of SNPs per CNV region of 10. All CNVs were visually verified by assessing both the B-allele-frequency and Log R ratios. Statistical analyses were performed using the t-test (Statview Software, SAS Institute) with statistical significance set at 0.01–0.05. CNV calls were validated using qPCR or by STR analysis.
MethylC-seq library construction
One microgram of genomic DNA was spiked with 5 ng unmethylated cl857 Sam7 Lambda DNA (Promega, Madison, Wisconsin, USA). The DNA was fragmented with a Covaris S2 (Covaris, Woburn, Massachusetts, USA) to 150–200 bp, followed by end repair and addition of a 3′ adenine base. Cytosine-methylated adapters provided by Illumina (Illumina, San Diego, California, USA) were ligated to the sonicated DNA at 16 °C for 16 h with T4 DNA ligase (New England Biolabs). Adaptor-ligated DNA was isolated by two rounds of purification with AMPure XP beads (Beckman Coulter Genomics, Danvers, Massachusetts, USA). Adaptor-ligated DNA (≤450 ng) was subjected to sodium bisulphite conversion using the MethylCode kit (Life Technologies, Carlsbad, California, USA) as per the manufacturer’s instructions. The bisulphite-converted, adaptor-ligated DNA molecules were enriched by eight cycles of PCR with the following reaction composition: 25 µl of Kapa HiFi Hotstart Uracil+ Readymix (Kapa Biosystems, Woburn, Massachusetts, USA) and 5 µl TruSeq PCR Primer Mix (Illumina) (50 µl final). The thermocycling parameters were: 95 °C 2 min, 98 °C 30 s, then four cycles of 98 °C 15 s, 60 °C 30 s and 72 °C 4 min, ending with one 72 °C 10-min step. The reaction products were purified using AMPure XP beads. Up to two separate PCR reactions were performed on subsets of the adaptor-ligated, bisulphite-converted DNA, yielding up to two independent libraries from the same biological sample.
MethylC-seq mapping
Sequencing reads were first trimmed for adaptor sequence using Cutadapt37. All cytosines in the trimmed reads were then computationally converted to thymines and mapped twice, to a converted forward strand reference and to a converted reverse strand reference both based on the hg19 reference genome. A converted reference is created by replacing all cytosines with thymines (forward strand) or all guanines with adenines (reverse strand) in the reference FASTA file. For mapping we used Bowtie38 with the following options: ‘-S’, ‘-k 1’, ‘-m 1’, ‘–chunkmbs 3072’, ‘–best’, ‘–strata’, ‘-o 4’, ‘-e 80’, ‘-l 20’, and ‘-n 0’. Any read that mapped to multiple locations was removed and one read from each starting location on each strand from each library was kept (that is, clonal reads were removed).
Methylation calling
To call methylated sites, we summed the number of reads that supported methylation at a site and the number of reads that did not. We used these counts to perform a binomial test with a probability of success equal to the non-conversion rate, which was determined by computing the fraction of methylated reads in the lambda genome (spiked in during library construction). The false discovery rate (FDR) for a given P-value cut-off was computed using Benjamini–Hochberg approach. Because the P-value distributions for each methylation context are different, this procedure was applied to each three nucleotide context independently (for example, a P-value cut-off was calculated for CAT cytosines).
DMR finding
We simultaneously identified DMRs in all samples using the following two-step process31. The first step involved performing a root-mean-square test on each individual CG as outlined in a previous report39. For this test, we constructed a contingency table where the rows indicated a particular sample and the columns indicated the number of reads that supported a methylated cytosine or an unmethylated cytosine at this position in a given sample. The P values were simulated using 3,000 permutations. For each permutation, a new contingency table was generated by randomly assigning reads to cells with a probability equal to the product of the row marginal and column marginal divided by the total number of reads squared. To speed up this process, if a P value returned 100 permutations with a statistic greater than or equal to the original test statistic, we stopped running permutations (that is, we used adaptive permutation testing). To determine a P-value cut-off that would control the false discovery rate (FDR) at our desired rate (1%), we used the procedure reported before40. In brief, this method first generates a histogram of the P values and calculates the expected number of P values to fall in a particular bin under the null. This expected count is computed by multiplying the width of the bin by the current estimate for the number of true null hypotheses (m0), which is initialized to the number of tests performed. It then looks for the first bin (starting from the most significant bin and working its way towards the least significant) where the expected number of P values is greater than or equal to the observed value. The differences between the expected and observed counts in all the bins up to this point are summed, and a new estimate of m0 is generated by subtracting this sum from the current total number of tests. This procedure was iterated until convergence, which we defined as a change in the m0 estimate of less than or equal to 0.01. With this m0 estimate, we were able to estimate the FDR of a given P value by multiplying the P value by the m0 estimate (the expected number of positives at that cut-off under the null hypothesis) and dividing that product by the total number of significant tests we detected at that P-value cut-off. We chose the largest P-value cut-off that still satisfied our FDR requirement. Once this P-value cut-off was chosen, significant sites were combined into blocks if they were within 250 bases of one another and had methylation changes in the same direction (for example, sample A was hypermethylated and sample B was hypomethylated at both sites). A sample was considered hypo- or hypermethylated if the deviation of observed counts from the expected counts was in the top or bottom 1% of deviations. These residuals were calculated using the following formula below for a given cell in row i and column j:
where i is the row index and j is the column index of the cell for which you are calculating the residual, C is the total number of columns, R is the total number of rows, N is the total number of observations, and k and l are row index and column index variables for the two respective summation functions. The distinction between hypermethylation and hypomethylation was made based on the sign of the residuals. For example, if the residual for the methylated read count of sample A was positive, it was counted as hypermethylation. Furthermore, blocks that contained fewer than 10 differentially methylated sites were discarded.
Methylation levels
Throughout the paper we refer to the methylation levels of regions in various contexts. Unless otherwise noted, these methylation levels are more specifically weighted methylation levels as defined in the previous report41.
Identification of CG DMRs
The DMR-finding algorithm described above was applied on hESO-7 and hESO-8, H1, H9, HUES6, NT1-4, iPS-S1 and iPS-S2, iPS-R1 and iPS-R2, FF-iPS 6.9, FF-iPS 19.7, FF-iPS 19.11, iMR90-iPS and ADS-iPS cell lines. In total, 5,138 DMRs were obtained. Then, assuming that each DMR splits the samples into two groups, a hypomethylated group and a hypermethylated group, we took the largest difference between neighbouring ranked values and divided the groups. Any DMR with a split less than 0.1 was discarded (861 DMRs) because its methylation pattern is obscure. The remaining 4,277 DMRs were then segregated further and only DMRs containing uniform agreement of all five IVF ES cell lines were considered (1,075 DMRs remaining): only DMRs where all ES lines were either all in the hypomethylation group or hypermethylation group were chosen. Lastly, only DMRs where the five IVF ES cell groups separated from at least one NT or one iPS cell line were included in the main figures. This yielded the final number of 678 DMRs that was used for further analyses.
Memory, NT-specific and iPS-cell-specific DMRs
Memory DMRs are defined as CG DMRs that shared the same methylation state with the progenitor HDFs. NT-specific DMRs (ntDMRs) or iPS cell-specific DMRs (iDMRs) are regions where the methylation states in the sample group match neither to HDFs nor to the IVF ES cell state.
Identification of non-CG mega DMRs
To identify non-CG mega DMRs, we first divided genome into 5-kb non-overlapping bins. For each bin, the non-CG methylation level (mCH/CH) was computed as weighted methylation level minus bisulphite non-conversion rate and mCH/CH was then normalized by dividing by the median mCH/CH of the 5-kb bin. Next, the Mann–Whitney test was used to compare the median normalized mCH/CH of every 10 consecutive bins (sliding window) of each sample (NTs, iPS cells from this study and iPS cells from our previous study8, and the average of all five IVF ES cells (H1, H9, HUES6, hESO-7 and hESO-8). Sliding windows were significantly non-CG differentially methylated if they showed more than two fold changes than the average IVF ES cell sample and had a P value below 5% FDR (Benjamini–Hochberg). Next, for each sample, significant sliding windows were merged if they were within 100 kb and showed changes in the same direction compared with the average ES cell sample (non-CG hypomethylated or hypermethylated).
To get a set of regions that aberrant non-CG methylation presented, we merged all non-CG mega DMRs from all iPS cell and NT ES cell samples if they were within 100 kb. In total, 150 merged non-CG mega DMRs were obtained. In the rest of the analyses, we used non-CG mega DMRs called in each samples.
Clustering samples by methylation states of non-CG mega DMRs
Normalized mCH/CH was computed for all non-CG mega DMRs. 1 − Pearson correlation coefficient was used as distance metric. Function ‘hclust’ in R with option ‘ward’ was used for hierarchical clustering.
Permutation to estimate the significance of closeness of non-CG mega DMRs to centromeres and telomeres
Merged non-CG mega DMRs were shuffled within autosomes of human reference genome (hg19) excluding ENCODE blacklisted regions. This permutation was conducted 1,000 times to estimate the distribution of median distance of shuffled non-CG mega DMRs to centromeric and telemeric regions. The significance (P value) of closeness to centromeric and telemeric regions was defined as the fraction of permutations that median distances of shuffled non-CG mega DMRs were less than the median distance of unshuffled non-CG mega DMRs.
Expression analysis on genes inside non-CG mega DMRs
The number of genes within non-CG mega DMRs in each sample was counted as the number of genes that overlapped (at least 1 bp) non-CG mega DMRs identified in each sample. To evaluate the effect of aberrant non-CG methylation on gene expression, for each sample, we computed the log2 fold change of reads per kb per million (RPKM) of genes that overlapped non-CG mega DMRs in that sample to that in ES cells. Permutation was used to estimate the significance of change in RPKM. For hypomethylated non-CG mega DMRs, we randomly picked the same number of genes (as number of genes that overlapped non-CG mega DMRs) in each iPS cell or NT ES cell sample and counted the total number of genes that showed more than a 10% decrease in expression compared with the average expression in ESCs. The permutation was run 1,000 times and the significance (P value) was defined as the percentage of permutations in which the random set showed more than a 10% decrease in expression rather than our set of non-CG mega DMRs. For hypermthylated non-CG mega DMRs, analysis was similar except that we analysed the number of genes that showed 10% increase rather than decrease in our test statistics.
DAVID42,43 was used to conducted gene ontology32 analysis to find out enriched terms related to genes that overlapped merged non-CG DMRs identified in NT ES cells and iPS cells from this study. The top five significant annotation clusters were reported in Supplementary Table 5 (FDR < 0.001).
Extended Data
Extended Data Figure 1. Mitochondrial DNA genotyping.
a, Mitochondrial DNA (mtDNA) genotyping by RNA-seq and MethylC-seq. The NT4 line carried a C/T heteroplasmy at position 16092 (open oval) while the other NT ES cell and IVF ES cell lines contained a homoplasmic C allele at this position. b, Chromatographs of single nucleotide polymorphisms (SNPs, arrows) within the human mitochondrial genome indicate that all four NT ES cell lines share a mtDNA sequence with IVF ES cells. Notably, the NT4 line carried a C/T heteroplasmy at position 16092 (double peaks with blue representing C and red representing T in the chromatograph) while other NT ES cell lines and both hESO-7 and hESO-8 contained a homoplasmic C allele. The mtDNA sequence of all iPS cell lines was identical to the parental HDFs. c, mtDNA genotyping by Sanger sequencing demonstrated that all Leigh-iPS cell lines contain a G mutation at mtDNA position 8993 and the Leigh-NT1 line contains oocyte mtDNA with a wild-type T at the same position.
Extended Data Figure 2. Subchromosomal genomic aberrations in IVF ES cells, NT ES cells and iPS cells.
a, The location and type of CNVs for all mapped samples. One-copy deletion regions are shown in red, two-copy deletions are in yellow, duplicated regions (three copies) are in dark blue, and runs of homozygosity (ROHs) are in green. b, The average number of CNVs per stem cell type for IVF ES cells, NT ES cells and iPS cells. Owing to the small sample sizes, no statistically significant differences were found between sample groups. c, Bar graphs displaying the number of InDels by sample. d, Bar graphs showing the average number of InDels found in the iPS cell lines and NT ES cell lines. No statistically significant differences were found between sample groups. Error bars, s.e.m.
Extended Data Figure 3. XIST and XACT expression.
a, Bar graph showing the reads per kb per million reads (RPKMs) of the XIST gene for pluripotent stem cell lines and HDFs. b, Bar graph showing the log transformed normalized read count of the XACT gene for the same samples. Error bars, s.e.m.
Extended Data Figure 4. Genes with aberrant methylation and associated alterations in gene expression.
a, Hypermethylation of iPS-R2 (black line in bar graphs representing the average β-values for methylation level, right side of y axis) and decreased gene expression of POU3F4, SLITRK2 and SLITRK4 (bar graphs representing normalized reads, averaged between replicates, left side of y axis). b, Hypomethylation (black line in bar graphs representing the average β-values for methylation level, right side of y axis) of iPS-R1 (top two graphs and bottom left corner) and iPS-S2 (bottom right corner) correlated with decreased gene expression of DACH2, CHM, RPS6KA6 and TMEM187 (bar graph representing normalized reads, averaged between replicates, left side of y axis).
Extended Data Figure 5. Differential methylation at autosomal non-imprinted loci.
Heat map displaying 1,621 autosomal, non-imprinted CpGs that were differentially methylated among NT ES cells, iPS cells and IVF ES cells (n = 10) (Kruskal–Wallis P-value < 0.01, Δβ > 0.5). CpG probes were clustered into six groups using an unsupervised self-organizing map algorithm24. The line graphs on the right represent an average β-value for each cluster.
Extended Data Figure 6. Methylation of CpG probes.
Box plots representing the β-values for all autosomal non-imprinted probes on the methylation array located within specified genomic regions. The box plots show a general trend of higher methylation levels in iPS cells compared to IVF ES cells. The number of CpGs interrogated in each genomic region is included on the y axis. The box represents the interquartile range (25th to 75th percentile), and the line within the box marking represents the median. The notch in the box represents the 95% confidence interval around the median. The whiskers above and below the box contain 99.3% of the data with outliers represented by circles above and below the whiskers. a, Probes within 2,000 base pairs of the transcription start site (TSS). b, Probes within CpG Islands (CGIs). c, Probes in the 5′ region (0–2 kb upstream of CGI). d, Probes in the 3′ region (0–2 kb downstream of CGI). e, Probes in the 5′ region (2–4 kb upstream of CGI). f, Probes in the 3′ region (2–4 kb downstream of CGI). g, Functional annotation of the mammalian genome (FANTOM 4) promoters with high CpG content. h, FANTOM 4 promoters with low CpG content. i, Probes within enhancers. j, Probes within major histocompatibility complex (MHC) regions. k, Probes within cancer differential methylated regions (CDMRs). l, Probes within reprogramming differentially methylated regions (RDMRs). m, Probes within short interspersed nuclear element (SINE) regions. n, Probes within long interspersed nuclear element (LINE) regions. o, Probes within long terminal repeat (LTR) regions.
Extended Data Figure 7. Non-CG mega DMRs.
a, Heat map of normalized mCH/CH of all 150 non-CG mega DMRs identified by comparing four NT ES cell lines, nine iPS cell lies to five IVF ES cell lines from this study and the previous studies28–30. b, An example of non-CG mega DMRs (black bar) ranged from 1,995,000 bp to 4,850,000 bp on chromosome 8. The y axis is normalized mCH/CH, which is defined as the weighted non-CG methylation level minus bisulphite non-conversion and dividing median mCH/CH of 5 kb bin. Scope was extended 200 kb on both sides to show non-CG methylation profile of regions surrounding non-CG mega DMRs. c, A representative non-CG mega DMR (black bar) hypomethylated in both iPS cells and NT ES cells on chromosome 21. d, A representative non-CG mega DMR hypermethylated only in iPS cells on chromosome 10.
Extended Data Figure 8. Expression patterns of genes in non-CG mega DMRs.
a, Number of genes in non-CG mega DMRs identified in each sample. b, Average number of genes falling in non-CG mega DMRs in NT ES cells and iPS cells. c, Histogram of gene expression in iPS cells for the genes located in hypermethylated. d, Hypomethylated non-CG mega DMRs identified in iPS cells. The x axis is the log2 fold change of iPS cell RPKM compared to IVF ES cell RPKM. e, Histogram of gene expression in NT ES cells for the genes located in hypomethylated non-CG mega DMRs. The x axis is the log2 fold change of NT ES cell RPKM compared to IVF ES cell RPKM. NT ES cell (or iPS cell) RPKM was the average of two replicates, while ES cell RPKM was the average of all replicates of hESO-7 and hESO-8.
Extended Data Table 1.
Complete list of genomlc aberrations identified in human IVF ES cells, NT ES cells and iPS cells
| Sample | Chromo- some |
Start (bp) | End (bp) | CNV Conf | #of SNP Probes |
#of Overlap- ping Genes |
Copy# | Loss/ Gain | Length (bp) | Validated by |
|---|---|---|---|---|---|---|---|---|---|---|
| NT3 | 16 | 89,408,074 | 89,439,454 | 191.4954 | 46 | 1 | 1 | Loss | 31,380 | qPCR |
| NT4 | 3 | 187,845,124 | 187,924,526 | 196.4829 | 195 | 2 | 3 | Gain | 79,402 | qPCR |
| NT4 | 6 | 75,123,272 | 75,175,449 | 220.6837 | 65 | 1 | 3 | Gain | 52,177 | qPCR |
| iPS-R1 | 3 | 9,362,779 | 9,368,946 | 799.5526 | 10 | 1 | 0 | Loss | 6,167 | qPCR |
| iPS-R1 | 3 | 60,799 | 52,757,653 | 5280.268 | 89,442 | 696 | 2 | ROH | 52,696,854 | STR |
| iPS-R1 | 3 | 52,758,962 | 52,864,938 | 261.1798 | 259 | 5 | 3 | Gain | 105,976 | qPCR |
| iPS-R1 | 4 | 93,458,820 | 93,668,885 | 203.8254 | 242 | 1 | 3 | Gain | 210,065 | qPCR |
| iPS-S1 | 1 | 175,173,524 | 175,988,713 | 966.2393 | 1,446 | 6 | 3 | Gain | 815,189 | qPCR |
| iPS-S1 | 5 | 58,314,095 | 58,374,072 | 217.1823 | 89 | 2 | 3 | Gain | 59,977 | qPCR |
| iPS-S2 | 1 | 97,684,968 | 97,847,690 | 739.0569 | 321 | 2 | 1 | Loss | 162,722 | qPCR |
| iPS-S2 | 4 | 93,255,316 | 93,606,843 | 241.5232 | 400 | 1 | 1 | Loss | 351,527 | qPCR |
| iPS-S2 | 17 | 57,732,914 | 57,998,653 | 562.8078 | 299 | 7 | 1 | Loss | 265,739 | qPCR |
| iPS-S3 | 10 | 53,683,347 | 53,825,576 | 653.6136 | 287 | 1 | 1 | Loss | 142,229 | qPCR |
| hESO-7 | X | 30,846,903 | 30,986,489 | 545.1291 | 161 | 1 | 1 | Loss | 139,586 | qPCR |
| Leigh-iPS1 | 1 | 236,951,332 | 237,001,821 | 276.8432 | 73 | 1 | 1 | Loss | 50,489 | qPCR |
| Leigh-iPS1 | 1 | 237,104,255 | 237,306,314 | 1627.849 | 436 | 1 | 1 | Loss | 202,059 | nt |
| Leigh-iPS1 | 1 | 238,529,991 | 238,936,131 | 2213.59 | 793 | 1 | 1 | Loss | 406,140 | nt |
| Leigh-iPS3 | 1 | 236,951,454 | 237,312,367 | 2498.518 | 724 | 2 | 1 | Loss | 360,913 | qPCR |
| Leigh-iPS3 | 1 | 238,502,906 | 238,930,859 | 2446.968 | 844 | 1 | 1 | Loss | 427,953 | nt |
| Leigh-iPS3 | 4 | 161,343,476 | 161,383,535 | 177.7607 | 62 | 0 | 1 | Loss | 40,059 | nt |
| Leigh-iPS3 | 17 | 60,641,467 | 60,692,446 | 197.7071 | 67 | 1 | 1 | Loss | 50,979 | nt |
| Leigh-iPS2 | X | 45,509,522 | 45,621,472 | 221.3433 | 108 | 2 | 2 | ROH | 111,950 | qPCR |
| Leigh-NT1 | 10 | 62,091,205 | 65,462,512 | 257.5634 | 4655 | 16 | 3 | Gain | 3,371,307 | qPCR |
Note that NT1 and NT2 as well as iPS-R2, iPS-S4 and iPS-S5 lines had no detectable CNVs. nt, not tested. See also Extended Data Fig. 2a, b.
Extended Data Table 2.
Allelic expression of imprinted genes
Allelic expression is shown for imprinted genes in Fig. 2a. DIRAS3, DLGAP2, KCNK9, MKRN3, PEG3 and GNASAS had no heterozygous SNPs with more than two reads.
#, total number of reads; B, bi-allelic; M, mono-allelic; N/A, no available SNPs; N/E, not expressed.
Supplementary Material
Acknowledgments
The authors acknowledge the OHSU Embryonic Stem Cell Research Oversight Committee and the Institutional Review Board for providing oversight and guidance. We thank oocyte and sperm donors and the Women’s Health Research Unit staff at the Center for Women’s Health, University Fertility Consultants and the Reproductive Endocrinology and Infertility Division in the Department of Obstetrics and Gynecology of Oregon Health and Science University for their support and procurement of human gametes. We are grateful to C. Penedo for microsatellite analysis and W. Sanger and D. Zaleski for karyotyping services. We are also indebted to Y. Li, H. Sritanaudomchai and D. Melguizo Sanchis for their technical support. We thank the staff at the Institute for Genomic Medicine Genomics Facility at UCSD for running the Infinium HumanMethylation450 BeadChips and sequencing of the RNA-seq libraries. The authors acknowledge the Texas Advanced Computing Center (TACC) at The University of Texas at Austin (http://www.tacc.utexas.edu) and the San Diego Supercomputing Center (through an allocation from the eXtreme Science and Engineering Discovery Environment (XSEDE)) for providing HPC resources that have contributed to the research results reported within this paper. SCNT and iPS cell studies were supported by grants from the Leducq Foundation and OHSU institutional funds. R.M., K.S., R.T. and L.C.L. were supported by the UCSD Department of Reproductive Medicine. Methylome studies were supported by the Salk International Council Chair fund endowment and the Mary K. Chapman Foundation to J.R.E. J.R.E. is an investigator of the Howard Hughes Medical Institute and the Gordon and Betty Moore Foundation (GMBF3034). A.P. received a fellowship from the Swedish Research Council, Vetenskapsrådet. E.K. was partially funded by a fellowship from the Collins Medical Trust.
Footnotes
Supplementary Information is available in the online version of the paper.
Author Contributions H.M., R.M., L.C.L. and S.M. conceived the study and designed the experiments. P.A., M.S. and N.M.G. coordinated recruitment of gamete donors. P.A. performed ovarian stimulations and oocyte retrievals. M.T., M.S., N.M.G. and S.M. conducted SCNT, IVF and embryo culture experiments. R.T.-H., S.M., M.T., M.S., N.M.G., H.M., A.P., B.D., E.K., A.S. and R.A. derived and cultured IVF ES cells, NT ES cells and iPS cells. S.G. performed teratoma analysis. H.M., M.T. and C.V.D. performed the DNA and RNA extractions, mtDNA amplification refractory mutation system qPCR analyses, and qPCR. R.M., K.S., R.D.T. and L.C.L. performed SNP, DNA methylation and RNA-seq studies and bioinformatic analysis of the data. R.C.O., Y.H., M.D.S., M.H., J.R.N., R.C. and J.R.E. conducted MethylC-seq studies. H.M., R.M., R.C.O., Y.H., J.R.E., L.C.L., D.P.W. and S.M. wrote the paper.
Processed data sets can be downloaded from the NCBI GEO under accession GSE53096 for RNA-seq, SNP array and 450K methylation array, and accession GSE57179 for MethylC-seq data. Analysed MethylC-seq data sets can also be accessed at http://neomorph.salk.edu/SCNT/browser.html.
The authors declare no competing financial interests.
References
- 1.Thomson JA, et al. Embryonic stem cell lines derived from human blastocysts. Science. 1998;282:1145–1147. doi: 10.1126/science.282.5391.1145. [DOI] [PubMed] [Google Scholar]
- 2.Takahashi K, et al. Induction of pluripotent stem cells from adult human fibroblasts by defined factors. Cell. 2007;131:861–872. doi: 10.1016/j.cell.2007.11.019. [DOI] [PubMed] [Google Scholar]
- 3.Rais Y, et al. Deterministic direct reprogramming of somatic cells to pluripotency. Nature. 2013;502:65–70. doi: 10.1038/nature12587. [DOI] [PubMed] [Google Scholar]
- 4.Hussein SM, et al. Copy number variation and selection during reprogramming to pluripotency. Nature. 2011;471:58–62. doi: 10.1038/nature09871. [DOI] [PubMed] [Google Scholar]
- 5.Laurent LC, et al. Dynamic changes in the copy number of pluripotency and cell proliferation genes in human ESCs and iPSCs during reprogramming and time in culture. Cell Stem Cell. 2011;8:106–118. doi: 10.1016/j.stem.2010.12.003. [DOI] [PMC free article] [PubMed] [Google Scholar]
- 6.Ruiz S, et al. Analysis of protein-coding mutations in hiPSCs and their possible role during somatic cell reprogramming. Nature Commun. 2013;4:1382. doi: 10.1038/ncomms2381. [DOI] [PMC free article] [PubMed] [Google Scholar]
- 7.Nazor KL, et al. Recurrent variations in DNA methylation in human pluripotent stem cells and their differentiated derivatives. Cell Stem Cell. 2012;10:620–634. doi: 10.1016/j.stem.2012.02.013. [DOI] [PMC free article] [PubMed] [Google Scholar]
- 8.Lister R, et al. Hotspots of aberrant epigenomic reprogramming in human induced pluripotent stem cells. Nature. 2011;471:68–73. doi: 10.1038/nature09798. [DOI] [PMC free article] [PubMed] [Google Scholar]
- 9.Ohi Y, et al. Incomplete DNA methylation underlies a transcriptional memory of somatic cells in human iPS cells. Nature Cell Biol. 2011;13:541–549. doi: 10.1038/ncb2239. [DOI] [PMC free article] [PubMed] [Google Scholar]
- 10.Ruiz S, et al. Identification of a specific reprogramming-associated epigenetic signature in human induced pluripotent stem cells. Proc. Natl Acad. Sci. USA. 2012;109:16196–16201. doi: 10.1073/pnas.1202352109. [DOI] [PMC free article] [PubMed] [Google Scholar]
- 11.Tachibana M, et al. Human embryonic stem cells derived by somatic cell nuclear transfer. Cell. 2013;153:1228–1238. doi: 10.1016/j.cell.2013.05.006. [DOI] [PMC free article] [PubMed] [Google Scholar]
- 12.Lowry WE, et al. Generation of human induced pluripotent stem cells from dermal fibroblasts. Proc. Natl Acad. Sci. USA. 2008;105:2883–2888. doi: 10.1073/pnas.0711983105. [DOI] [PMC free article] [PubMed] [Google Scholar]
- 13.Fusaki N, Ban H, Nishiyama A, Saeki K, Hasegawa M. Efficient induction of transgene-free human pluripotent stem cells using a vector based on Sendai virus, an RNA virus that does not integrate into the host genome. Proc. Jpn Acad B. 2009;85:348–362. doi: 10.2183/pjab.85.348. [DOI] [PMC free article] [PubMed] [Google Scholar]
- 14.Taylor RW, Turnbull DM. Mitochondrial DNA mutations in human disease. Nature. Rev. Genet. 2005;6:389–402. doi: 10.1038/nrg1606. [DOI] [PMC free article] [PubMed] [Google Scholar]
- 15.Bock C, et al. Reference maps of human ES and iPS cell variation enable high-throughput characterization of pluripotent cell lines. Cell. 2011;144:439–452. doi: 10.1016/j.cell.2010.12.032. [DOI] [PMC free article] [PubMed] [Google Scholar]
- 16.Suzuki R, Shimodaira H. Pvclust: an R package for assessing the uncertainty in hierarchical clustering. Bioinformatics. 2006;22:1540–1542. doi: 10.1093/bioinformatics/btl117. [DOI] [PubMed] [Google Scholar]
- 17.Ziller MJ, et al. Genomic distribution and inter-sample variation of non-CpG methylation across human cell types. PLoS Genet. 2011;7:e1002389. doi: 10.1371/journal.pgen.1002389. [DOI] [PMC free article] [PubMed] [Google Scholar]
- 18.Stelzer Y, et al. Identification of novel imprinted differentially methylated regions by global analysis of human-parthenogenetic-induced pluripotent stem cells. Stem Cell. Rep. 2013;1:79–89. doi: 10.1016/j.stemcr.2013.03.005. [DOI] [PMC free article] [PubMed] [Google Scholar]
- 19.Rugg-Gunn PJ, Ferguson-Smith AC, Pedersen RA. Status of genomic imprinting in human embryonic stem cells as revealed by alarge cohort of independently derived and maintained lines. Hum. Mol. Genet. 2007;16:R243–R251. doi: 10.1093/hmg/ddm245. [DOI] [PubMed] [Google Scholar]
- 20.de Hoon MJ, Imoto S, Nolan J, Miyano S. Open source clustering software. Bioinformatics. 2004;20:1453–1454. doi: 10.1093/bioinformatics/bth078. [DOI] [PubMed] [Google Scholar]
- 21.Saldanha AJ. Java Treeview–extensible visualization of microarray data. Bioinformatics. 2004;20:3246–3248. doi: 10.1093/bioinformatics/bth349. [DOI] [PubMed] [Google Scholar]
- 22.Silva SS, Rowntree RK, Mekhoubad S, Lee JT. X-chromosome inactivation and epigenetic fluidity in human embryonic stem cells. Proc. Natl Acad. Sci. USA. 2008;105:4820–4825. doi: 10.1073/pnas.0712136105. [DOI] [PMC free article] [PubMed] [Google Scholar]
- 23.Vallot C, et al. XACT, a long noncoding transcript coating the active X chromosome in human pluripotent cells. Nature Genet. 2013;45:239–241. doi: 10.1038/ng.2530. [DOI] [PubMed] [Google Scholar]
- 24.Newman AM, Cooper JB. AutoSOME: a clustering method for identifying gene expression modules without prior knowledge of cluster number. BMC Bioinformatics. 2010;11:117. doi: 10.1186/1471-2105-11-117. [DOI] [PMC free article] [PubMed] [Google Scholar]
- 25.McLean CY, et al. GREAT improves functional interpretation of cis-regulatory regions. Nature Biotechnol. 2010;28:495–501. doi: 10.1038/nbt.1630. [DOI] [PMC free article] [PubMed] [Google Scholar]
- 26.Nishino K, et al. DNA methylation dynamics in human induced pluripotent stem cells over time. PLoS Genet. 2011;7:e1002085. doi: 10.1371/journal.pgen.1002085. [DOI] [PMC free article] [PubMed] [Google Scholar]
- 27.Polo JM, et al. Cell type of origin influences the molecular and functional properties of mouse induced pluripotent stem cells. Nature Biotechnol. 2010;28:848–855. doi: 10.1038/nbt.1667. [DOI] [PMC free article] [PubMed] [Google Scholar]
- 28.Xie W, et al. Epigenomic analysis of multilineage differentiation of human embryonic stem cells. Cell. 2013;153:1134–1148. doi: 10.1016/j.cell.2013.04.022. [DOI] [PMC free article] [PubMed] [Google Scholar]
- 29.Laurent L, et al. Dynamic changes in the human methylome during differentiation. Genome. Res. 2010;20:320–331. doi: 10.1101/gr.101907.109. [DOI] [PMC free article] [PubMed] [Google Scholar]
- 30.Lister R, et al. Global epigenomic reconfiguration during mammalian brain development. Science. 2013;341:1237905. doi: 10.1126/science.1237905. [DOI] [PMC free article] [PubMed] [Google Scholar]
- 31.Lister R, et al. Human DNA methylomes at base resolution show widespread epigenomic differences. Nature. 2009;462:315–322. doi: 10.1038/nature08514. [DOI] [PMC free article] [PubMed] [Google Scholar]
- 32.Ashburner M, et al. Gene ontology: tool for the unification of biology. The Gene Ontology Consortium. Nature Genet. 2000;25:25–29. doi: 10.1038/75556. [DOI] [PMC free article] [PubMed] [Google Scholar]
- 33.Gore A, et al. Somatic coding mutations in human induced pluripotent stem cells. Nature. 2011;471:63–67. doi: 10.1038/nature09805. [DOI] [PMC free article] [PubMed] [Google Scholar]
- 34.Kim K, et al. Epigenetic memory in induced pluripotent stem cells. Nature. 2010;467:285–290. doi: 10.1038/nature09342. [DOI] [PMC free article] [PubMed] [Google Scholar]
- 35.Johnson WE, Rabinovic A, Li C. Adjusting batch effects in microarray expression data using Empirical Bayes methods. Biostatistics. 2007;8:118–127. doi: 10.1093/biostatistics/kxj037. [DOI] [PubMed] [Google Scholar]
- 36.Price ME, et al. Additional annotation enhances potential for biologically-relevant analysis of the Illumina Infinium HumanMethylation450 BeadChip array. Epigenetics Chromatin. 2013;6:4. doi: 10.1186/1756-8935-6-4. [DOI] [PMC free article] [PubMed] [Google Scholar]
- 37.Martin M. Cutadapt removes adapter sequences from high-throughput sequencing reads. EMB net. journal. 2011;17 [Google Scholar]
- 38.Langmead B, et al. Ultrafast and memory-efficient alignment of short DNA sequences to the human genome. Genome Biol. 2009;10:R25. doi: 10.1186/gb-2009-10-3-r25. [DOI] [PMC free article] [PubMed] [Google Scholar]
- 39.Perkins W, Tygert M, Ward R. Computing the confidence levels for a root-mean-square test of goodness-of-fit. Appl. Math. Comput. 2011;217:9072–9084. [Google Scholar]
- 40.Bancroft T, Du C, Nettleton D. Estimation of false discovery rate using sequential permutation p-values. Biometrics. 2013;69:1–7. doi: 10.1111/j.1541-0420.2012.01825.x. [DOI] [PubMed] [Google Scholar]
- 41.Schultz MD, Schmitz RJ, Ecker JR. ‘Leveling’ the playing field for analyses of single-base resolution DNA methylomes. Trends Genet. 2012;28:583–585. doi: 10.1016/j.tig.2012.10.012. [DOI] [PMC free article] [PubMed] [Google Scholar]
- 42.Huang, da W, Sherman BT, Lempicki RA. Systematic and integrative analysis of large gene lists using DAVID bioinformatics resources. Nature Protocols. 2009;4:44–57. doi: 10.1038/nprot.2008.211. [DOI] [PubMed] [Google Scholar]
- 43.Huang, da W, Sherman BT, Lempicki RA. Bioinformatics enrichment tools: paths toward the comprehensive functional analysis of large gene lists. Nucleic Acids. Res. 2009;37:1–13. doi: 10.1093/nar/gkn923. [DOI] [PMC free article] [PubMed] [Google Scholar]
Associated Data
This section collects any data citations, data availability statements, or supplementary materials included in this article.


