Abstract
Superoxide is a naturally produced reactive oxygen species (ROS) in the human body and is involved in many pathological and physiological signaling processes. However, if superoxide formation is left unregulated, overproduction can lead to oxidative damage to important biomolecules, such as DNA, lipids, and proteins. Superoxide can also lead to the formation of peroxynitrite, an extremely hazardous substance, through its reaction with endogenously produced nitric oxide. Despite its importance, quantitative information regarding superoxide production is difficult to obtain due to its high reactivity and low concentrations in vivo. MitoHE, a fluorescent probe that specifically reacts with superoxide, was used in conjunction with microchip electrophoresis (ME) and laser-induced fluorescence detection to investigate changes in superoxide production by RAW 264.7 macrophage cells following stimulation with phorbol 12-myristate 13-acetate (PMA). Stimulation was performed in the presence and absence of the superoxide dismutase (SOD) inhibitors, diethyldithiocarbamate (DDC) and 2-metoxyestradiol (2-ME). The addition of these inhibitors resulted in an increase in the amount of superoxide specific product (2-OH-MitoE+) from 0.08 ± 0.01 fmol (0.17 ± 0.03 mM) in native cells to 1.26 ± 0.06 fmol (2.5 ± 0.1 mM) after PMA treatment. This corresponds to an approximately 15-fold increase in intracellular concentration per cell. Furthermore, the addition of 3-morpholino-sydnonimine (SIN-1) to the cells during incubation resulted in 0.061 ± 0.006 fmol (0.12 ± 0.01 mM) of 2-OH-MitoE+ per cell on average. These results demonstrate that indirect superoxide detection coupled with the use of SOD inhibitors and a separation method is a viable method to discriminate the 2-OH-MitoE+ signal from possible interferences.
Keywords: Bioanalytical methods, Fluorescence, Microchip electrophoresis, Superoxide
Graphical abstract
Introduction
Reactive oxygen species (ROS), including superoxide (O2•−) and hydrogen peroxide (H2O2), are part of the natural aerobic metabolism of cells and are involved in many physiological and pathological processes [1]. The mitochondrion is the main source of ROS in most cells [1]. Superoxide is primarily generated during the breakdown of the electron transport chain during ATP production [2]. It can then dismutate to hydrogen peroxide and diatomic oxygen either naturally or by the action of the intracellular enzyme superoxide dismutase (SOD) [3]. Hydrogen peroxide can be further degraded by catalase and glutathione peroxidase to water and oxygen. Superoxide generated inside the mitochondria is primarily scavenged by manganese SOD (MnSOD–SOD type 2) [1]. Even though superoxide cannot undergo passive transport through the mitochondrial membrane, it can cross this membrane via an anion channel (IMAC). Copper zinc SOD (Cu/ZnSOD–SOD type 1), present in intermembrane space and cytosol, is responsible for superoxide scavenging in the cytosolic compartment [1].
If these cell defense mechanisms fail to regulate ROS production, superoxide will accumulate inside the cell and react with proteins, DNA, carbohydrates, lipids, and other important biomolecules ultimately leading to cell death [2, 4]. Additionally, superoxide can react with other free radical species, such as nitric oxide (NO), to form peroxynitrite (ONOO−). Peroxynitrite is an extremely reactive and toxic molecule that has been linked to several disease states including cardiovascular, neurodegenerative, and inflammatory disorders [3].
In order to better understand the toxicity of excess superoxide production, several strategies to measure this molecule in cells have been reported in the literature [5–7]. Experimentally, high concentrations of intracellular superoxide can be achieved in immune cells by incubating with a stimulant such as phorbol 12-myristate 13-acetate (PMA) [7–9]. PMA promotes the phosphorylation of NADPH oxidase by inducing the activation of protein kinase C and produces superoxide in the process [7]:
Other methods of superoxide stimulation include the use of zymosan [5, 10, 11] and succinate [12].
The detection and quantitation of superoxide can be a complicated task due to its highly reactive and unstable nature. Moreover, SODs are ubiquitous, highly abundant in cells (often present in concentrations higher than 10 μM), and extremely efficient catalysts for superoxide dismutation (rate constant > 109 M−1 s−1) [3]. For this reason, superoxide detection is usually performed indirectly using fluorescence probes [6, 12–14], chemiluminescence [8, 9], electron spin resonance (ESR) [7], or a spectroscopic Nitro Blue tetrazolium reduction assay [15]. Additionally, microsensors have also been developed for direct superoxide detection [16]. Flamm et al. proposed the use of a linear–polyethylenimine-covered gold microelectrode to continuously monitor extracellular superoxide production by T-47D human breast carcinoma cells in culture flasks [17]. In a separate application, Wilson et al. developed a cytochrome c anchored gold microelectrode for in vivo superoxide detection [18]. Among all these methods, fluorescence detection is the most popular for the detection of intracellular and extracellular superoxide due to its low limits of detection, ability to be used in in vivo assays, and easy integration with separation methods for bulk and single cell analysis.
The most common probes used for superoxide detection are based on hydroethidine (HE) and its derivatives. MitoSOX red, or MitoHE, is a commercially available mitochondrial targeted hydroethidine derivative that has been widely used [2, 19, 20]. As pointed out by Zielonka et al., it is important to have a separation step prior to detection of the fluorescent product in order to eliminate interferences from other HE derivatives [21]. The reaction of HE with superoxide leads to a specific hydroxylated product (2-OH-E+, λex/λem = 475/580 nm), but other hydride acceptor molecules present in biological matrices can induce the formation of a second, non-specific product, ethidium (E+, λex/λem = 495/590 nm) [22, 23]. Analogously, the same behavior can be observed with MitoHE [21]. Therefore, it is necessary to separate the two fluorescent products to determine the signal obtained due to the reaction with superoxide from that obtained from oxidizing interferences.
An alternative to HE derivatives, 2-chloro-1,3-dibenzothiazolinecyclohexene (DBZTC), has been reported to have a higher specificity towards superoxide [24, 25]. This probe was used by Li et al. for the detection of superoxide in macrophage cell extract using microchip electrophoresis with fluorescence detection [6]. Hydrogen peroxide was detected simultaneously using the fluorescent probe bis(p-methylbenzenesulfonyl) dichlorofluorescein [6]. Despite the promising results, the impact of DBZTC for these types of studies is limited because the probe is not commercially available. Therefore, strategies to separate the superoxide-specific product from the non-specific ones generated by MitoHE and HE derivatives reactions in biological samples have been developed using high-performance liquid chromatography (HPLC) [13, 26] and capillary electrophoresis (CE) [12, 14]. For instance, Xu et al. developed a method for the determination of superoxide in single skeletal muscle fibers by individually lysing triphenylphosphonium hydroethine-treated cells in a nanowell [14]. Injection and separation were subsequently performed using micellar electrokinetic capillary chromatography with laser-induced fluorescence detection (MEKC-LIF) [14]. Meany et al. also used MEKC-LIF to separate and detect HE products in isolated mitochondria following stimulation with succinate [12].
Due to the similarities between ME and CE, electrophoresis methods can usually be transferred to the microchip format allowing sub-minute analysis times and high integration possibilities [6, 25]. Our group has previously reported the separation of other reactive nitrogen and oxygen species, including nitric oxide and nitrite, using ME with fluorescence or electrochemical detection [27, 28]. Since superoxide is difficult to detect electrochemically, the ability to integrate multiple detection platforms into a single ME device could therefore allow for the simultaneous detection of nitric oxide, superoxide, and peroxynitrite. Moreover, microfluidic devices are also the most suitable platform to perform single cell analysis because it allows for on-line integration of cell sample preparation and analysis [27].
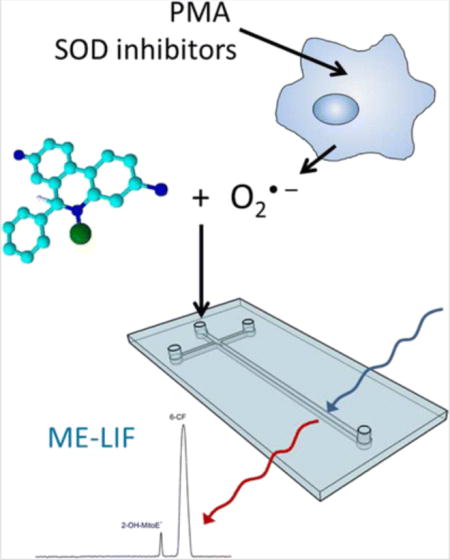
The present report focuses on the development of a microchip electrophoresis method with LIF detection for the measurement of superoxide production in native (untreated) and PMA-stimulated RAW 264.7 macrophage cells using MitoHE as the fluorescent probe. Differences in intracellular superoxide generation due to the presence of the cytosolic SOD inhibitor, diethyldithiocarbamate (DDC), and mitochondrial SOD inhibitor, 2-metoxyestradiol (2-ME) prior to PMA stimulation versus non-stimulated samples (control) are measured with this technique. Finally, changes in intracellular superoxide concentration due to incubation of RAW 264.7 cells with a superoxide donor, 3-morpholino-sydnonimine (SIN-1), were also investigated.
Materials and methods
Materials and reagents
All chemical used in this work were of analytical grade and purchased from Sigma (St. Louis, MO, USA), unless specified otherwise. MitoSOX Red (MitoHE) was purchased from Life Technologies (Carlsbad, CA, USA). Potassium nitrosodisulfonate was purchased as a 50–75 % pure powder (Sigma). Dulbecco’s Modified Eagle’s Medium (DMEM), fetal bovine serum (FBS), L-glutamine, penicillin, and streptomycin were obtained from ATCC (Manassas, VA, USA). Polydimethylsiloxane (PDMS) microdevices were prepared from the Sylgard 184 Elastomer Kit (Ellsworth Adhesives, Germantown, WI, USA).
The pH values of solutions were adjusted using 1.5 M sodium hydroxide and 0.1 M hydrochloric acid solutions as needed.
Solution preparation
MitoHE stock solution preparation
MitoHE stock solution was prepared as specified by the manufacturer. Briefly, 13 μL of dimethyl sulfoxide (DMSO) was added to an individual vial containing 50 μg of probe. The vial was vortexed for 15 seconds and then centrifuged for 2 min at 7000 rpm, leading to a 5-mM MitoHE stock solution. All preparation and handling steps using MitoHE were performed in the dark. All MitoHE stock solutions were used in the experiments immediately after preparation.
2-OH-MitoE+ standard preparation
2-OH-MitoE+ standards were prepared by the reaction of MitoHE with nitrosodisulfonate anion (NDS) as follows: A 1-mM NDS solution was prepared by dissolving potassium nitrosodisulfonate (Fremy’s salt) in a 50-mM borate solution (pH = 9.2) containing 1 mM diethylene triamine pentaacetic acid (DTPA). The NDS solution used was always fresh, prior to each standard preparation.
The reaction was conducted by mixing the following reagents: 200 μL of 100 mM borate buffer (pH = 9.2), 40 μL of 1 mM DTPA, 8 μL of 5 mM MitoHE stock solution, 72 μL of nanopure water, and 80 μL of 1 mM NDS solution. The reaction was allowed to proceed for 2 h in the dark at room temperature. Afterwards, the reaction media containing 2-OH-MitoE+ standard was simply diluted in ME run buffer and analyzed with the ME-LIF system.
Xanthine/xanthine oxidase reaction
The xanthine/xanthine oxidase reaction (XA/XO) is a well-established method for in situ superoxide production [16, 29]. MitoHE was added to solution containing XA and XO in order to produce 2-OH-MitoE+. The reaction was performed in two different vials. The first vial contained 375 μL of 1 mM xanthine (XA), 7 μL of 0.5 U mL−1 xanthine oxidase (XO), 6 μL of 5 mM MitoHE stock solution, and 612 μL of XO buffer. XO buffer consisted of 0.1 mM ethylenediaminetetraacetic acid in 50 mM phosphate buffer (pH = 7.4). The second vial was prepared with the same amount of XA, XO, and MitoHE with the addition of 50 μL of 5800 U mL−1 superoxide dismutase (SOD) and 562 μL of XO buffer. The contents of both vials were allowed to react for 3 h in the dark at room temperature, and then the contents of each vial was diluted in electrophoresis run buffer prior to analysis.
Cell culture and stimulation protocol
RAW 264.7 macrophages cells obtained from American Type Culture Collection (ATCC® TIB-71™, Manassas, VA, USA) were cultured in DMEM supplemented with 10 % (v/v) FBS, L-glutamine (2 mM), penicillin (0.3 mg mL−1), and streptomycin (0.3 mg mL−1). The cells were maintained in a humidified environment at 37 °C and 5 % CO2 and cultured in 25 cm2 polystyrene culture flasks (Fisher Scientific, Waltham, MA, USA). Cells were passaged every 2 days to avoid overgrowth. Cells were grown until they reached approximately 50–60 % confluence and then stimulated.
Stimulation of superoxide production in the macrophage cells was accomplished using PMA. PMA was added to healthy cells in a 25-cm2 cell culture flask to obtain a final PMA concentration of 3.24 nM and then incubated for 24 h in a humidified environment at 37 °C and 5 % CO2. Untreated (native) RAW 264.7 cells from the same population were incubated under identical conditions and used as a control for each stimulation experiment. In order to increase superoxide detection, cells were treated with 1 mM DDC and 50 μM 2-ME 1 h prior to PMA stimulation.
For SIN-1 incubation studies, healthy cells in a 25-cm2 cell culture flask were first treated with 1 mM DDC for 1 h in the same environment mentioned above and then incubated with 50 μM SIN-1 solution under the same conditions for 1 h. An experiment without DDC addition was also performed. Native cells (not treated with SIN-1) from the same population were also incubated at the same conditions and used as a control.
Bulk cell lysate preparation
Following stimulation or SIN-1 incubation, RAW 264.7 cells in their original medium were labeled with MitoHE. The stock dye solution was prepared in DMSO. A 6-μL aliquot of 5 mM MitoHE solution was added to each culture flask and allowed to react for 10 min in the dark inside the incubator. Then, the dye-loaded cells were harvested using a cell scraper. The cell suspension was transferred to a 15-mL centrifuge tube and centrifuged at 1137 g for about 3 min. Before centrifugation, 100 μL of the cell solution was taken out for cell counting. The supernatant medium was then removed, leaving only the cell pellet, which was washed twice with 1 M phosphate-buffered saline at pH 7.4. Next, the cell pellet was lysed in 100 μL of lysing buffer (10 mM borate buffer, 40 mM Tris HCl, and 0.5 % Triton X-100 at pH 9.2) and transferred into 500 μL vials. Twenty-five microliters of 10 mg mL−1 Proteinase K solution was added to the lysate followed by incubation for 45 min at 37 °C. Then, 13.5 μL of 10 mg mL−1 of DNase I was loaded into the vials for an additional 20 min. In order to remove any turbidity, the lysate solution was sonicated for 30 s and then centrifuged for 2 min at 7000 rpm. Lastly, the lysate solution was diluted 10-fold and loaded into the sample reservoir of the microchip for ME-LIF analysis.
Cell viability
Cell viability was measured using the Trypan blue exclusion assay and a hemocytometer cell count (C-Chip disposable hemocytometer, Bulldog Bio, Inc., Portsmouth, NH, USA). The RAW 264.7 cell suspension was diluted using 1:1 to 1:3 ratios (based on cell density) with a 0.4 % Trypan blue solution. The number of viable cells and cell density was determined using a 4-mm2 total area hemocytometer. Native RAW cells typically had densities of about 6 million cells in a 25-cm2 flask prior to passaging.
Microchip fabrication and instrumental setup
The fabrication of the PDMS/glass microfluidic has been previously described by our group [27]. First, a SU-8 10 photoresist (Silicon, Inc., Boise, ID, USA) mold containing the microdevice design was fabricated using soft photolithography. Second, the PDMS substrate was prepared by mixing its pre-polymer and cross-linking agent in a 10:1 w/w ratio. The mixture was degassed under vacuum and poured over the SU-8 mold and cured in oven at 70 °C for 3 h. The cured PDMS device was peeled off the mold, and access reservoirs were made using a 3-mm biopsy punch (Harris Uni-core, Ted Pella, Redding, CA, USA). Lastly, the PDMS substrate was reversibly sealed against flat borosilicate glass (Precision Glass and Optics, Santa Ana, CA, USA) to form the final microdevice with enclosed microchannels in which the electrophoresis separations were performed. The present work used a simple “T” microchip design with a 5-cm separation channel and 0.75 cm side arms for all experiments. The microchannel depth and width dimensions were 15 and 45 μm, respectively.
A dual channel high-voltage power supply (HV Rack, Ultravolt Inc., Ronkonkoma, NY, USA) controlled by a homemade Labview program (National Instruments, Austin, TX, USA) was used in all experiments. Sample was introduced to the separation channel using a 1-s gated injection. Both injection and separation were performed using a high-voltage power supply in positive polarity mode. For all separations, +2400 and +2200 V were applied to the background electrolyte (BGE) and sample reservoir, respectively.
The PDMS/glass hybrid microchip was placed in an inverted microscope (Eclipse Ti-U, Nikon Instruments Inc., Melville, NY, USA) for fluorescence detection. A 488-nm diode laser (Spectra-Physics, Irvine, CA, USA) was used as the excitation source. Light was collected using a photomultiplier tube (Hamamatsu Corporation, Bridgewater, NJ, USA). The signal was amplified using a SR570 low noise current preamplifier at 1 μAV−1 (Stanford Research Systems, Sunnyvale, CA). Data acquisition and analysis were carried out using a D/A converter (National Instruments) and a custom Labview software program.
Prior to analysis, each microdevice was flushed with 0.1 M NaOH for 5 min, followed by a 10 min flush with electrophoresis BGE. The BGE used in all ME-LIF experiments consisted of 10 mM borate (pH = 9.2) and 3.5 mM sodium dodecyl sulfate (SDS). Cleaning runs were performed between each bulk cell lysate sample analysis by flushing the system for 30 s with electrophoresis BGE only. This setup made it possible to perform several consecutive runs for each sample, and it was also possible to easily realign the laser when needed.
Results and discussion
One primary focus of our group has been developing methods using spectrometric and electrochemical detection to study biological reactive species, such as nitric oxide and peroxynitrite, in vitro. Due to the complexity of biological samples, a separation method is needed to isolate the analytes of interest from interferences. In the case of superoxide, the combination of a separation method with a fluorescent probe that generates a unique product with superoxide can ensure that a given signal is due only to superoxide production, and not other ROS, such as hydrogen peroxide. Therefore, the present study was focused on the development of a ME-LIF method that could be used for the detection of superoxide produced by native and stimulated RAW 264.7 macrophages cells.
The fluorescent probe used, Mito-HE, has been reported to react with intracellular superoxide to produce a 2-hydroxylated product, 2-OH-MitoE+. Once inside a cell, MitoSOX can also react with other reactive species, such as peroxynitrite, hydroxyl radical, and hydrogen peroxide, but these reactions generate a non-hydroxylated product, MitoE+, that can be electrophoretically separated from 2-OH-MitoE+ [21, 23, 30]. Therefore, under biological conditions, only superoxide will lead to the formation of 2-OH-MitoE+, which gives a fluorescent signal useful for monitoring changes in its concentration (Fig. 1).
Fig. 1.
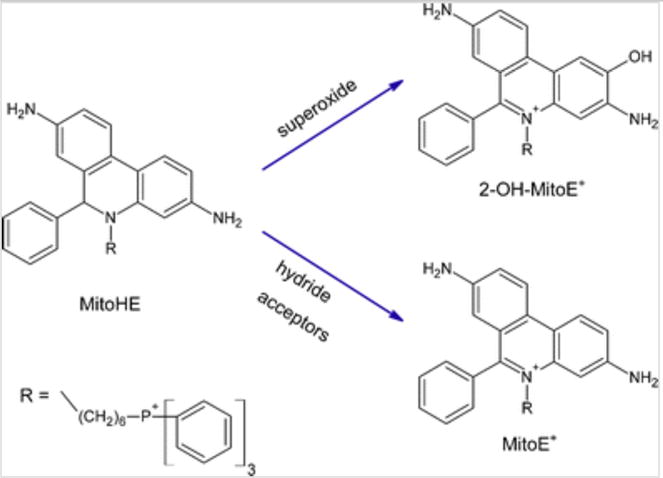
Reaction of MitoHE with superoxide and other ROS. Reproduced from Zielonka et al. [30]
Results from standard solutions
Although the reaction of superoxide and MitoHE inside RAW 264.7 cells generates a specific product, an alternative approach to obtain 2-OH-MitoE+ outside the biological environment has been reported [31]. This involves the reaction of the fluorescent probe with nitrosodisulfonate anion (NDS). The previously discussed method was used to generate 2-OH-MitoE+ standards and the calibration curve [30]. The reaction has a 1:2 stoichiometry and should give, under optimal conditions, a total conversion of the fluorescent probe to 2-OH-MitoE+.
Following the optimization of the reaction and subsequent analysis of the product by ME-LIF, a calibration curve between 50 and 500 nM was obtained for 2-OH-MitoE+ with a R2 value of 0.97 (Online Resource 1). Under the reaction conditions specified in the experimental section for preparation of the standard, only one peak was observed in the electropherogram. Electropherograms containing two peaks were obtained when the reaction was performed using a limiting amount of NDS. In this case, the excess unreacted probe could autoxidize into the non-specific product MitoE+, which was detected as a less intense peak in the electropherogram (Fig. 2).
Fig. 2.
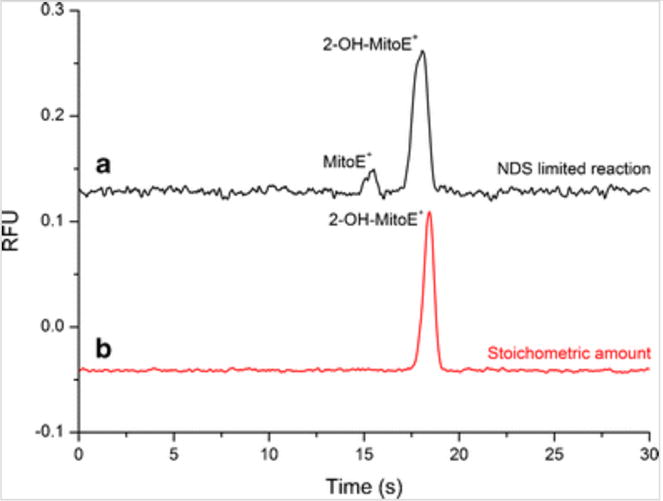
MitoHE reaction with NDS prepared using (a) 3.6 mg of potassium NDS (NDS limited reaction) and (b) using 4.0 mg of potassium NDS (stoichiometric amount) from a 67.5 % pure Fremy’s salt. Laser alignment at 2.3 cm
Peak identification using XA/XO reaction
The identity of the major peak at 18.1 s in standard runs (Fig. 2) was assigned to 2-OH-MitoE+ based on Fremy’s salt reaction, sample electrophoretic mobility, and also by comparison with previously published work [12]. To further verify the identity, the xanthine/xanthine oxidase (XA/XO) system was employed to generate superoxide in situ which then reacted with MitoHE. The conversion of XA to uric acid is catalyzed by XO and the generation of superoxide occurs as part of the regeneration of XO into its oxidizing form. The amount of superoxide produced is dependent on the concentration of XA, XO, and oxygen present in the medium [16]. By making the XA/XO reaction media with and without the presence of superoxide dismutase (SOD), we were able to account for the specificity of the reaction between superoxide and MitoHE as well as provide a means for peak identification.
These reactions were allowed to proceed for 3 h in the dark in open vials to ensure access to atmospheric oxygen. The reaction products were then analyzed by the ME-LIF system. The results are shown in Fig. 3. Figure 3a represents the XA/XO reaction media without SOD. In this case, two fluorescent products were formed mainly due to the reaction of MitoHE with superoxide and hydrogen peroxide. Electropherogram (b) in Fig. 3 shows the data for the reaction media containing SOD. In this case, SOD scavenges superoxide from the system and the second peak disappears. Therefore, it is possible to conclude that the peak at 21 s is indeed due to 2-OH-MitoE+ and is formed from the reaction of MitoHE and superoxide. The slight difference in the migration time of the 2-OH-MitoE+ found in these experiments compared to the standards can be attributed to the use of a different PDMS microchip and small variations in the laser alignment on the separation channel. Moreover, the migration order obtained in this experiment was comparable to that obtained during the analysis of the previously prepared standards, indicating that the initial peak identifications were correct.
Fig. 3.
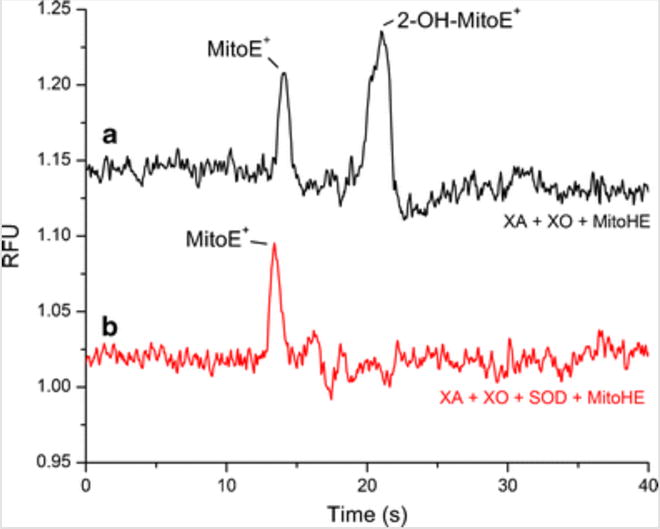
Electropherograms for the injection of XA/XO reaction media + MitoHE with and without SOD
Bulk cell analysis of SIN-1 incubated RAW 264.7 macrophages
Before monitoring superoxide production in RAW 264.7 cells, it was crucial to ensure that the method will generate a measurable and reproducible signal in complex matrices such as cell lysates. Several factors needed to be taken into account that might influence the ability to detect the target analyte by ME-LIF including the experimental setup, the stimulation protocol used, the presence of superoxide dismutase, and the reactions between the target analyte and biomolecules present in the biological media.
In order to monitor 2-OH-MitoE+ signal in the presence of the cell lysate using the proposed experimental setup, we first decided to study the electropherograms obtained for RAW 264.7 cells incubated with SIN-1, a well-known peroxynitrite donor, and the fluorescent probe MitoHE before lysis. SIN-1 decomposition to SIN-1C is triggered by the addition of NaOH, producing both superoxide and nitric oxide (Online Resource 2) [32, 33]. These two molecules can then react with each other to form peroxynitrite. It is possible to monitor the production of superoxide by SIN-1 in vitro by adding MitoHE to the mixture and monitoring the increase in the 2-OH-MitoE+ peak as the superoxide indicator. Figure 4 shows the use of ME-LIF to continuously monitor superoxide production by the SIN-1 reaction in vitro.
Fig. 4.
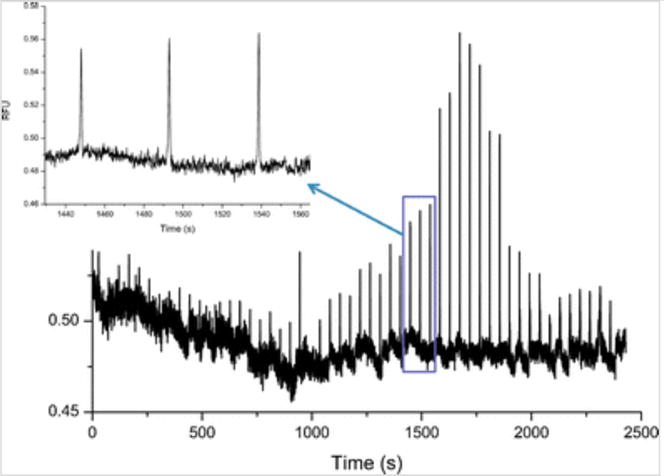
Monitoring of superoxide release during SIN-1 conversion to SIN-1C as a function of time
From these results, it is possible to observe the increase in 2-OH-MitoE+ concentration over time due to continuous superoxide production. The concentration keeps increasing until a certain point, after 1750 s, when the signal intensity starts to drop, eventually reaching a constant plateau. A possible explanation for this observation is that superoxide levels keep increasing until there is an excess of nitric oxide, which is also produced in the reaction. The presence of nitric oxide will cause the formation of peroxynitrite, and the amount of free superoxide will therefore decrease as peroxynitrite is formed. This hypothesis will be further investigated by monitoring peroxynitrite concentration using peroxynitrite-specific fluorescent probes, such as HK-Green 3 and HK-Green 4 [34, 35]. For the time being, it is important to state that SIN-1 decomposition and superoxide production can be monitored using MitoHE.
To reproduce this reaction in vivo, RAW 264.7 cells were incubated with 50 μM SIN-1 for 1 h with subsequent addition of 7 μM MitoHE and incubation for an additional 10 min. Once inside the cellular environment, esterases hydrolyze SIN-1 and trigger its conversion into SIN-1C, generating superoxide that will then react with the MitoHE. In the initial experiments, the electropherogram of the cell lysate analysis consisted of a constant baseline, with no detectable peak for 2-OH-MitoE+, for both native (Fig. 5a) and SIN-1 incubated cells (Fig. 5b). It was surmised that this was due to the presence of SOD in the cell cytosol. SOD reacts faster with superoxide than MitoHE, causing any native or induced superoxide to be immediately converted to hydrogen peroxide and molecular hydrogen. To circumvent this problem, RAW 264.7 cells were first treated with DDC, an inhibitor for cytosolic SOD prior to the introduction of the SIN-1. Under these conditions, superoxide was detected in the electropherogram as seen in Fig. 5c, d.
Fig. 5.
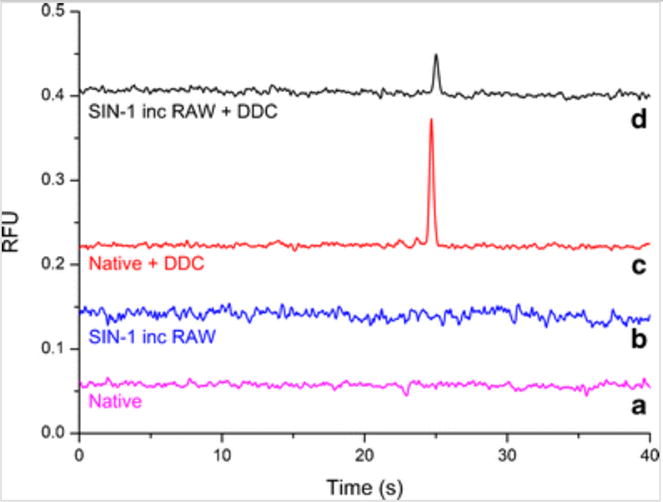
Electropherogram obtained for native and SIN-1 incubated RAW 264.7 macrophage cells. (a) Native RAW 264.7 macrophage cells, (b) SIN-1 incubated RAW 264.7 macrophage cells, (c) native RAW 264.7 macrophage cells in presence of DDC, (d) SIN-1 incubated RAW 264.7 macrophage cells in presence of DDC. Detection point = 4.5 cm from T intersection; n = 4
The peaks in the electropherograms for 2-OH-MitoE+ were integrated, and the areas obtained were 0.015 ± 0.001 and 0.055 ± 0.007 for SIN-1 incubated and native RAW 264.7, respectively. To estimate the 2-OH-MitoE+ concentration in a single cell, 2-OH-MitoE+ concentration for each electropherogram was calculated based on four parameters: the external calibration curve (Online Resource 1), the volume of cell lysis buffer, the estimated volume of an individual macrophage cell (0.05 pL) [28], and the number of cells present in each cell culture flask. Therefore, each SIN-1 incubated cell produced, on average, 0.061 ± 0.006 fmol (0.12 ± 0.01 mM) of 2-OH-MitoE+, while native cells produced 0.23 ± 0.03 fmol (0.45 ± 0.05 mM) of 2-OH-MitoE+ (both treated with DDC). The results indicate that after incubation with SIN-1, the detected amount of superoxide-specific fluorescent probe is less than those detected in native (not treated with SIN-1) cells inhibited with DDC. Once again, the hypothesis created to explain this behavior is that the reaction between nitric oxide and superoxide will be favored over the reaction between superoxide and MitoHE. This is primarily due to the faster reaction kinetics of the nitric oxide/superoxide reaction. Notably, the experiment demonstrated the importance of using a SOD inhibitor to minimize the loss of superoxide through biological pathways. Moreover, the experiment also proved that the system can detect the superoxide signal generated in such a complex matrix.
Indirect superoxide detection in PMA stimulated RAW 264.7 macrophage cells
Chronic and acute stimulation protocols were both evaluated for the production of superoxide. Bulk cell lysates were analyzed by ME-LIF. Experiments were performed without the addition of SOD inhibitors, proteinase K, or DNase I, and the cell pellets were lysed using electrophoresis BGE, containing SDS. We obtained a different fluorescent image for stimulated and control cells (Fig. 6a, b) and an electropherogram with a low intensity 2-OH-MitoE+ peak for the stimulated cells (Fig. 6c).
Fig. 6.
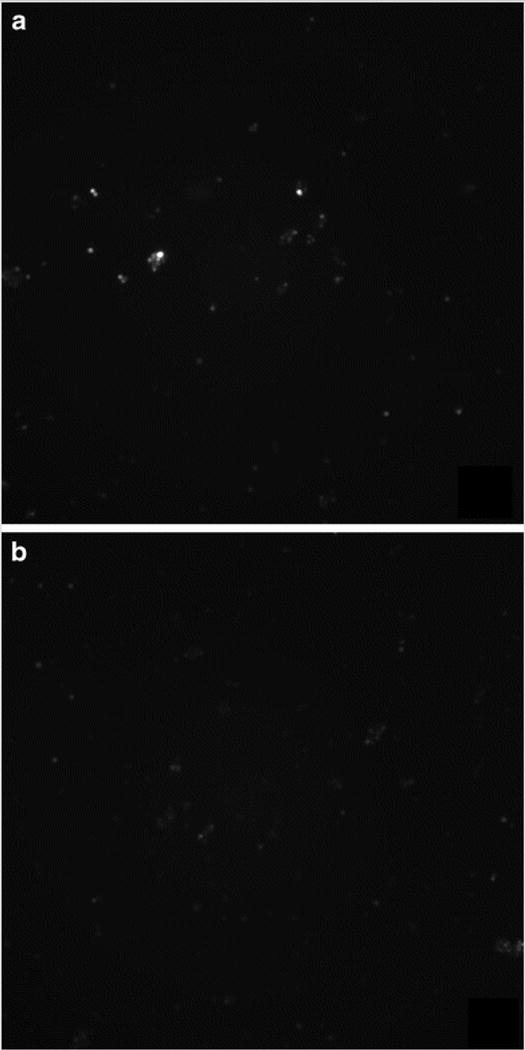
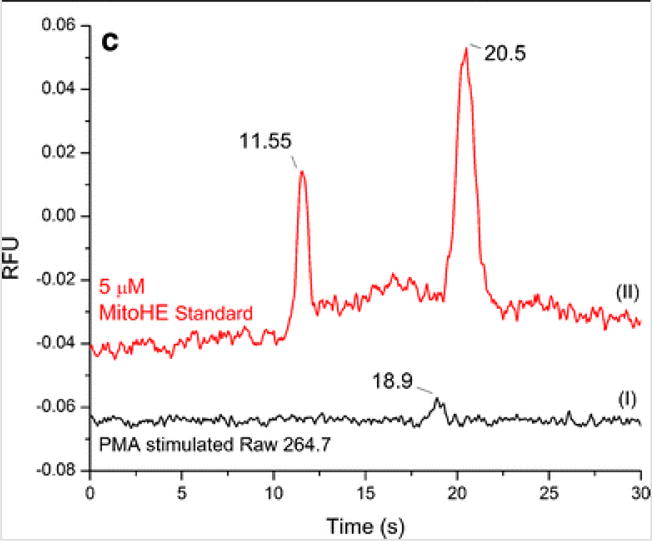
Stimulation optimization. RAW 264.7 macrophage cells were stimulated with 2 ng/mL PMA for 12 h and then incubated with 6 μL of 5 mM MitoHE for 10 min. a Fluorescence image of stimulated cells and b fluorescence image of native/control cells after stimulation protocol. c Electropherogram for (I) stimulated RAW 264.7 in comparison to (II) standard containing MitoE and 2-OH-MitoE. Detection point = 2.5 cm from T intersection
Although the fluorescence signal for stimulated cells can be clearly distinguished from the control cell sample, the peak obtained from the cell lysate exhibited very low intensity and it is evident from Fig. 6a that not all cells will respond equally to the stimulation. Therefore, in order to increase the amount of superoxide produced by cells, the incubation time was increased from 12 to 24 h, without compromising cell viability.
Sample preparation was also a determining factor for the signal intensity. Previously, our group developed a method for the detection of nitric oxide in Jurkat cells using ME-LIF. In these studies, a similar sample preparation method was employed using SDS in the lysing buffer and then filtering the lysate with a 3-kDa MWCO PES centrifuge filter [27]. Although this method was satisfactory for measurement of nitric oxide with DAF-FM, the use of the centrifuge filter affected the results for superoxide analysis. This is because 2-OH-MitoE+ binds to DNA [21], which causes most of target analyte to be stuck to the PES filter during centrifugation. Furthermore, attempts to analyze the lysate sample without centrifugation caused an irreproducible EOF and led to easily clogged channels due to the highly viscous lysate solution obtained when SDS and cell debris are present. Thus, in order to obtain a less viscous lysate capable of being analyzed without a centrifugation step, we decided to switch from a lysing solution containing SDS to a 0.5 % Triton X-100 solution in borate buffer.
The migration times for 5 μM 2-OH-MitoE+ standards in the presence of SDS and Triton X-100, with the detection point at 4.5 cm down from the T intersection of the simple T microchip, were 26.5 and 27.2 s, respectively. The average peak area obtained for standards in SDS was 0.24 with a RSD of 10.2 %, while those in Triton X-100 were 0.25 with a RDS of 7.2 %. Both results are not statistically different at a 95 % confidence level. Thus, a less viscous lysate that can be diluted in electrophoresis BGE prior to injection in the ME-LIF system, without drastically altering the analytes electrophoretic properties, was identified. Additionally, since the interaction between 2-OH-MitoE+ and DNA will alter the electrophoretic mobility and fluorescence yield of the 2-OH-MitoE+, proteinase K, and DNase I were employed as part of the sample preparation to break up DNA and eliminate this interaction [12].
Another important factor to take into account is the presence of both cytosolic and mitochondrial SOD in the macrophage cells. As discussed previously, SOD can scavenge superoxide faster than MitoHE, and this will cause a decrease in signal intensity. This way, the system would only provide information regarding excess superoxide production instead of total superoxide production. In order to minimize the effects of SOD on the analysis, cytosolic and mitochondrial SOD inhibitors (DDC and 2-ME, respectively) were added to the cells prior to PMA incubation. Thus, the optimized protocol for PMA stimulation was achieved.
The electropherograms obtained for stimulated and native RAW 264.7 cells using the optimized protocol described above are shown in Fig. 7. 6-Carboxyfluorescein (6-CF) was added to the cell lysate samples as an internal standard to ensure injection reproducibility. The results show the difference between the concentration of 2-OH-MitoE+ due to the reaction with natively present superoxide and PMA-stimulated produced. The average peak area, cell count, average number of moles of [2-OH-MitoE+] per cell (n[2-OH-MitoE+]), average 2-OH-MitoE+ concentration per cell, and RSD for each electropherogram are detailed in Table 1.
Fig. 7.
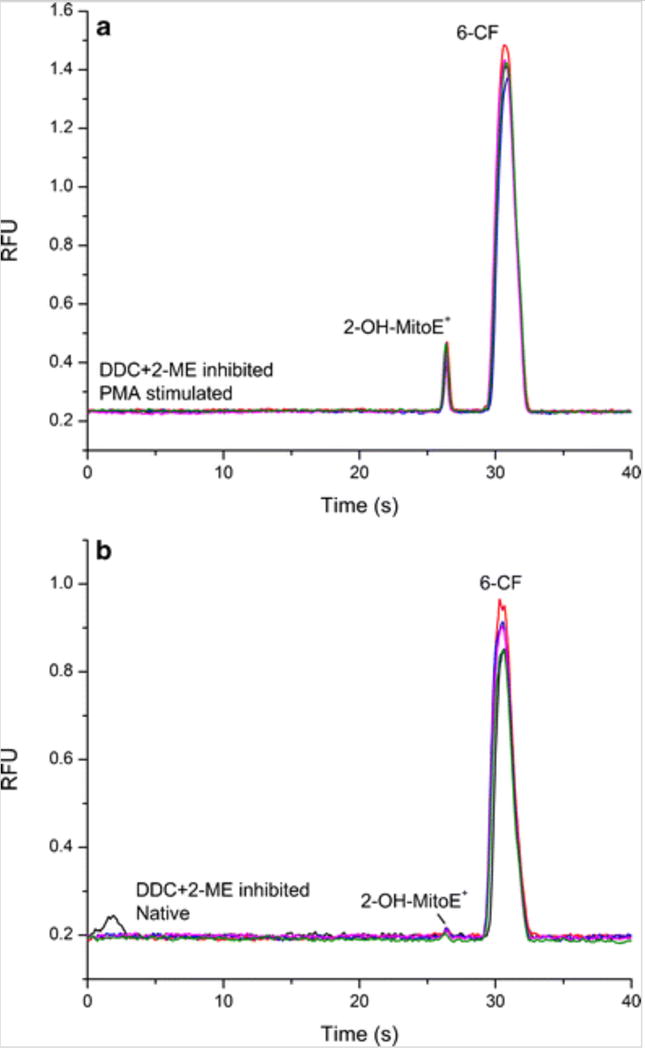
Electropherograms for RAW 264.7 lysate samples. Samples were prepared and diluted by a factor of 10 prior to injection. n = 5. a Lysate from 24 h PMA stimulated cells in the presence of both DDC and 2-ME. b Lysate from cells incubated with DDC and 2-ME without PMA stimulation (native/control)
Table 1.
Results for RAW 264.7 lysate samples: average peak area, cell count, average number of moles of [2-OH-MitoE+] per cell, average 2-OH-MitoE+ concentration per cell, and RSD
| PMA stimulated DDC inhibited + 2-ME | Native DDC + 2-ME inhibited | |
|---|---|---|
| Average peak area | 0.086 | 0.007 |
| Cell count (106) | 2.34 | 4.00 |
| n[2-OH-MitoE+] | 1.26 ± 0.06 fmol | 0.08 ± 0.01 fmol |
| [2-OH-MitoE+]/cell | 2.5 ± 0.1 mM | 0.17 ± 0.03 mM |
| RSD | 4.67 % | 15.15 % |
These results clearly show that superoxide production increases following chronic PMA stimulation represented by the increase in 2-OH-MitoE+ from 0.08 ± 0.01 fmol (0.17 ± 0.03 mM) in native cells to 1.26 ± 0.06 fmol (2.5 ± 0.1 mM) after PMA treatment. The presence of both SOD inhibitors makes it possible to indirectly detect superoxide even in native cells. Assuming the cell volume as 0.5 pL, the average 2-OH-MitoE+ concentration per cell was 15-fold higher in stimulated cells compared to native/control cells, which corresponds to increased superoxide production due to the presence of PMA. Moreover, the results obtained with both inhibitors for the control cells (Fig. 7b) show that the amount of superoxide that is naturally produced was not detectable without the presence of the inhibitors due to the scavenging action of SOD.
Finally, the electropherograms showed in Fig. 7 for stimulated and native RAW 264.7 cell samples generated two peaks, the first is due to 2-OH-MitoE+ and the second represents 6-CF. However, later, it was observed that some samples started to develop a faster migrating and less intense additional peak. This peak was caused by the formation of the non-specific product MitoE+ (Online Resource 3). Its formation could be due to the reaction of free MitoHE with other oxidizing species present in the sample or due to probe auto-oxidation. The presence of this interfering peak highlights the importance of using a separation method as a method to distinguish the fluorescence signal generated from the superoxide specific product from the signal generated by the presence of MitoE+.
Conclusions
The development and evaluation of a ME-LIF method for the indirect detection of superoxide in RAW 264.7 macrophage cells using MitoSOX Red as a specific fluorescent probe were reported. The separation step is important to eliminate potential fluorescent side products and interferences that could provide exaggerated results for superoxide generation. The stimulation protocol using PMA in the presence of DDC and 2-ME as SOD inhibitors showed an increase of 15-fold in 2-OH-MitoE+ concentration per cell when compared to native cells. Cell stimulation and sample preparation protocols were optimized for the detection of the product of MitoHE with superoxide. Additionally, the monitoring of SIN-1-driven superoxide production inside and outside a biological environment by ME-LIF was also presented. In the future, the cell heterogeneity observed after PMA stimulation can be further evaluated by performing single cell analysis. Other superoxide-specific fluorescent probes can be tested using the proposed PMA stimulation protocol to evaluate probe-to-probe variability. Additional cell lines can also be studied. This method complements our previously reported methods for nitric oxide detection using fluorescence and electrochemical detection [27, 28] as it allows an effective way to study a second reactive species, superoxide, using ME-LIF. The ultimate goal is to develop microanalytical methods that are capable of simultaneously monitoring the production of nitric oxide, superoxide, and peroxynitrite to better evaluate oxidative damage in different biological conditions at bulk and single cell levels.
Supplementary Material
Acknowledgments
This work was performed with the financial support from NSF (CHE-1411993), NIH (R01NS042929 and COBRE P20GM103638), FAPESP, CNPq, CAPES, and National Institute of Science and Technology on Bioanalysis (INCTBio – Brazil). R.P.S.C. received support from the CNPq scholarship through the Science without Borders program. J.M.S. was supported by the Madison and Lila Self Graduate Fellowship. We would also like to thank Ryan Grigsby for help with microchip fabrication and Nancy Harmony for editorial support.
Footnotes
Electronic supplementary material
The online version of this article (doi: 10.1007/s00216-015-8865-1) contains supplementary material, which is available to authorized users.
Below is the link to the electronic supplementary material.
(PDF 524 kb)
References
- 1.Ma ZA, Zhao Z, Turk J. Exp Diabetes Res. 2012 doi: 10.1155/2012/703538. [DOI] [PMC free article] [PubMed] [Google Scholar]
- 2.Robinson KM, Janes MS, Pehar M, Monette JS, Ross MF, Hagen TM, Murphy MP, Beckman JS. Proc Natl Acad Sci. 2006;103:15038–15043. doi: 10.1073/pnas.0601945103. [DOI] [PMC free article] [PubMed] [Google Scholar]
- 3.Ferrer-Sueta G, Radi R. Chem Biol. 2009;4:161–177. doi: 10.1021/cb800279q. [DOI] [PubMed] [Google Scholar]
- 4.Estévez AG, Jordán J. Ann N Y Acad Sci. 2002;962:207–211. doi: 10.1111/j.1749-6632.2002.tb04069.x. [DOI] [PubMed] [Google Scholar]
- 5.Kagan VE, Tyurina YY, Tyurin V, Konduru NV, Potapovich AI, Osipov AN, Kisin ER, Schwegler-Berry D, Mercer R, Castranova V, Shvedova AA. Toxicol Lett. 2006;165:88–100. doi: 10.1016/j.toxlet.2006.02.001. [DOI] [PubMed] [Google Scholar]
- 6.Li H, Li Q, Wang X, Xu K, Chen Z, Gong X, Liu X, Tong L, Tang B. Anal Chem. 2009;81:2193–2198. doi: 10.1021/ac801777c. [DOI] [PubMed] [Google Scholar]
- 7.Abbas K, Hardy M, Poulhès F, Karoui H, Tordo P, Ouari O, Peyrot F. Free Radic Biol Med. 2014;71:281–290. doi: 10.1016/j.freeradbiomed.2014.03.019. [DOI] [PubMed] [Google Scholar]
- 8.Ambrozova G, Pekarova M, Lojek A. Toxicol Vitr. 2011;25:145–152. doi: 10.1016/j.tiv.2010.10.006. [DOI] [PubMed] [Google Scholar]
- 9.So H, Park R, Oh H, Pae H. J Ethnopharmacol. 1999;68:209–217. doi: 10.1016/s0378-8741(99)00101-4. [DOI] [PubMed] [Google Scholar]
- 10.Cohen HJ, Newburger PE, Chovaniec ME, Whitin JC, Simons ER. Blood. 1981;58:975–982. [PubMed] [Google Scholar]
- 11.Suzuki K, Yamaguchi T, Oshizawa T, Yamamoto Y, Nishimaki-Mogami T, Hayakawa T, Takahashi A. Biochim Biophys Acta. 1995;1266:261–267. doi: 10.1016/0167-4889(95)00029-r. [DOI] [PubMed] [Google Scholar]
- 12.Meany DL, Thompson L, Arriaga EA. Anal Chem. 2007;79:4588–4594. doi: 10.1021/ac062252+. [DOI] [PubMed] [Google Scholar]
- 13.Kalyanaraman B, Dranka BP, Hardy M, Michalski R, Zielonka J. Biochim Biophys Acta – Gen Subj. 2014;1840:739–744. doi: 10.1016/j.bbagen.2013.05.008. [DOI] [PMC free article] [PubMed] [Google Scholar]
- 14.Xu X, Thompson LDV, Navratil M, Arriaga EA. Anal Chem. 2010;82:4570–4576. doi: 10.1021/ac100577q. [DOI] [PMC free article] [PubMed] [Google Scholar]
- 15.Grellet Bournonville CF, Díaz-Ricci JC. Phytochem Anal. 2011;22:268–271. doi: 10.1002/pca.1275. [DOI] [PubMed] [Google Scholar]
- 16.Lvovich V, Scheeline A. Anal Chem. 1997;69:454–462. doi: 10.1021/ac9606261. [DOI] [PubMed] [Google Scholar]
- 17.Flamm H, Kieninger J, Weltin A, Urban GA. Biosens Bioelectron. 2015;65:354–359. doi: 10.1016/j.bios.2014.10.062. [DOI] [PubMed] [Google Scholar]
- 18.Wilson RCK, Phuong DT, Chainani E, Scheeline A. J Electroanal Chem. 2011;662:100–104. [Google Scholar]
- 19.Mukhopadhyay P, Rajesh M, Haskó G, Hawkins BJ, Madesh M, Pacher P. Nat Protoc. 2007;2:2295–2301. doi: 10.1038/nprot.2007.327. [DOI] [PMC free article] [PubMed] [Google Scholar]
- 20.Robinson KM, Janes MS, Beckman JS. Nat Protoc. 2008;3:941–947. doi: 10.1038/nprot.2008.56. [DOI] [PubMed] [Google Scholar]
- 21.Zielonka J, Kalyanaraman B. Free Radic Biol Med. 2010;48:983–1001. doi: 10.1016/j.freeradbiomed.2010.01.028. [DOI] [PMC free article] [PubMed] [Google Scholar]
- 22.Zhao H, Kalivendi S, Zhang H, Joseph J, Nithipatikom K, Vásquez-Vivar J, Kalyanaraman B. Free Radic Biol Med. 2003;34:1359–1368. doi: 10.1016/s0891-5849(03)00142-4. [DOI] [PubMed] [Google Scholar]
- 23.Gomes A, Fernandes E, Lima JLFC. J Biochem Biophys Methods. 2005;65:45–80. doi: 10.1016/j.jbbm.2005.10.003. [DOI] [PubMed] [Google Scholar]
- 24.Gao JJ, Xu KH, Tang B, Yin LL, Yang GW, An LG. FEBS J. 2007;274:1725–1733. doi: 10.1111/j.1742-4658.2007.05720.x. [DOI] [PubMed] [Google Scholar]
- 25.Liu X, Li Q, Gong X, Li H, Chen Z, Tong L, Tang B. Electrophoresis. 2009;30:1077–1083. doi: 10.1002/elps.200800421. [DOI] [PubMed] [Google Scholar]
- 26.Michalski R, Michalowski B, Sikora A, Zielonka J, Kalyanaraman B. Free Radic Biol Med. 2014;67:278–284. doi: 10.1016/j.freeradbiomed.2013.10.816. [DOI] [PMC free article] [PubMed] [Google Scholar]
- 27.Mainz ER, Gunasekara DB, Caruso G, Jensen DT, Hulvey MK, da Silva JAF, Metto EC, Culbertson AH, Culbertson CT, Lunte SM. Anal Methods. 2012;4:414–420. [Google Scholar]
- 28.Gunasekara DB, Siegel JM, Caruso G, Hulvey MK, Lunte SM. Analyst. 2014;139:3265–3273. doi: 10.1039/c4an00185k. [DOI] [PMC free article] [PubMed] [Google Scholar]
- 29.Chen J, Rogers SC, Kavdia M. Ann Biomed Eng. 2014;41:327–337. doi: 10.1007/s10439-012-0653-x. [DOI] [PMC free article] [PubMed] [Google Scholar]
- 30.Zielonka J, Vasquez-Vivar J, Kalyanaraman B. Nat Protoc. 2008;3:8–21. doi: 10.1038/nprot.2007.473. [DOI] [PubMed] [Google Scholar]
- 31.Zielonka J, Zhao H, Xu Y, Kalyanaraman B. Free Radic Biol Med. 2005;39:853–863. doi: 10.1016/j.freeradbiomed.2005.05.001. [DOI] [PubMed] [Google Scholar]
- 32.Singh RJ, Hogg N, Joseph J, Konorev E, Kalyanaraman B. Arch Biochem Biophys. 1999;361:331–339. doi: 10.1006/abbi.1998.1007. [DOI] [PubMed] [Google Scholar]
- 33.Hulvey MK, Frankenfeld CN, Lunte SM. Anal Chem. 2010;82:1608–1611. doi: 10.1021/ac902821v. [DOI] [PMC free article] [PubMed] [Google Scholar]
- 34.Peng T, Yang D. HKGreen-3: Org Lett. 2010;12:4932–4935. doi: 10.1021/ol102182j. [DOI] [PubMed] [Google Scholar]
- 35.Peng T, Wong N-K, Chen X, Chan Y-K, Ho DH-H, Sun Z, Hu JJ, Shen J, El-Nezami H, Yang D. J Am Chem Soc. 2014;136:11728–11734. doi: 10.1021/ja504624q. [DOI] [PubMed] [Google Scholar]
Associated Data
This section collects any data citations, data availability statements, or supplementary materials included in this article.


