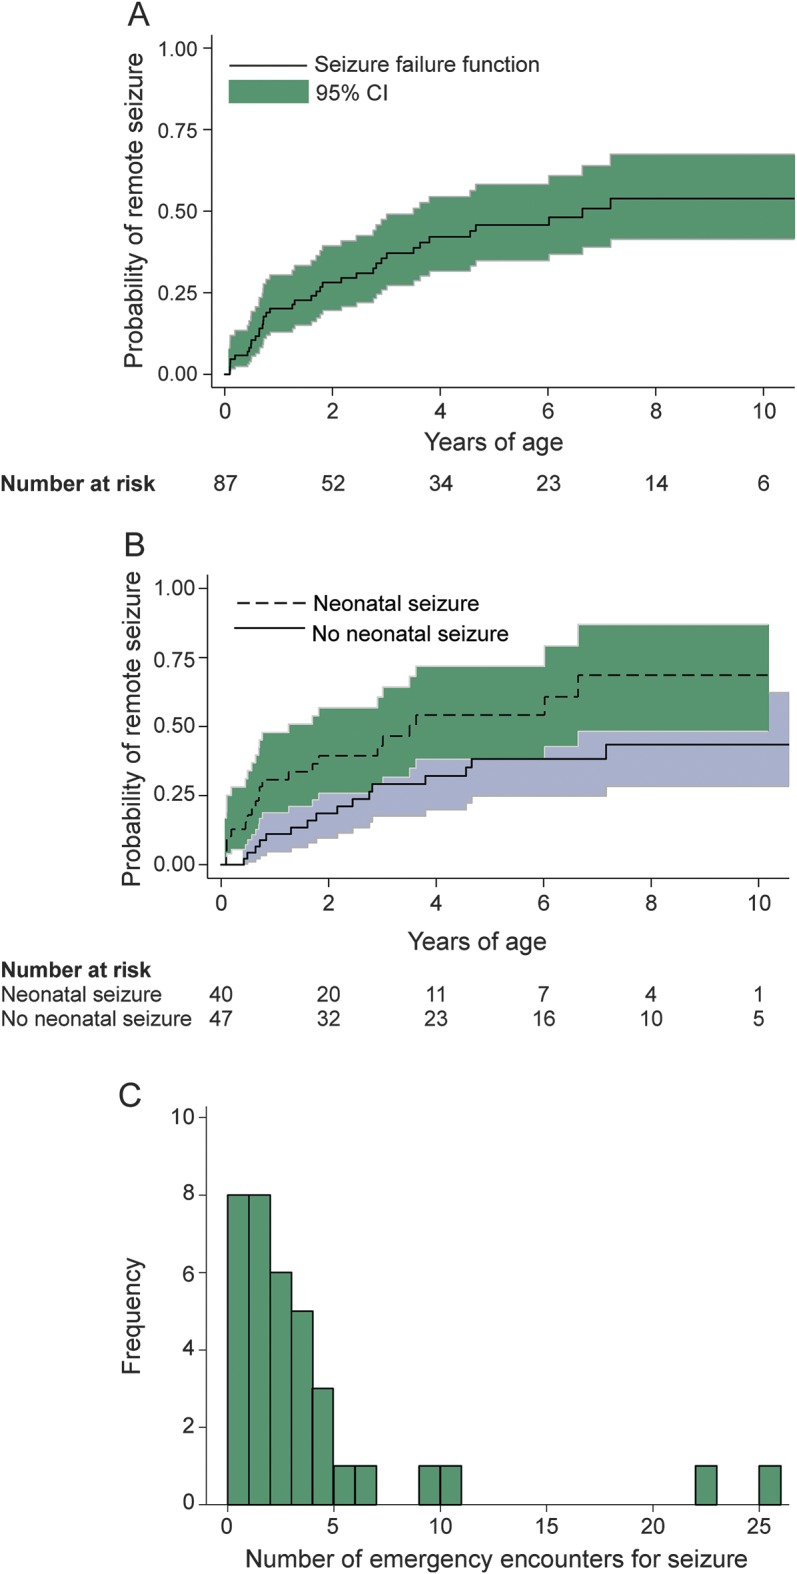
Figure 2. Remote seizures among 87 children after perinatal arterial ischemic stroke.

Kaplan-Meier failure plots demonstrate (A) the overall cumulative incidence of a first remote seizure (solid line represents the failure function) and (B) a 3-fold increased risk of remote seizure in children with a history of neonatal seizures (dashed line) compared to children with no neonatal seizures (solid line) (hazard ratio 2.8, 95% confidence interval [CI] 1.3–5.8, p = 0.03 for log-rank test for equality). In plots A and B, gray shading represents 95% confidence intervals and the x-axis represents time at risk beginning at 29 days of age. (C) During a median follow-up of 7.1 years, frequency of emergency medical encounters for seizure among the 37 children in the perinatal stroke cohort who had at least one remote seizure.
