

Abstract
We have applied principles of statistical signal processing and non-linear dynamics to analyze heart rate time series from premature newborn infants in order to assist in the early diagnosis of sepsis, a common and potentially deadly bacterial infection of the bloodstream. We began with the observation of reduced variability and transient decelerations in heart rate interval time series for hours up to days prior to clinical signs of illness. We find that measurements of standard deviation, sample asymmetry and sample entropy are highly related to imminent clinical illness. We developed multivariable statistical predictive models, and an interface to display the real-time results to clinicians. Using this approach, we have observed numerous cases in which incipient neonatal sepsis was diagnosed and treated without any clinical illness at all. This review focuses on the mathematical and statistical time series approaches used to detect these abnormal heart rate characteristics and present predictive monitoring information to the clinician.
Keywords: Neonatal sepsis, heart rate characteristics, sample entropy, predictive monitoring
Introduction
We aim to develop useful numerical algorithms to assist in the care of patients with common and severe medical problems, particularly those with subclinical prodromes in which early diagnosis and treatment might improve outcomes. To date, we have focused on sepsis in premature infants.
Sepsis, an often severe bacterial infection of the bloodstream, is a common cause of illness and death in premature infants in the neonatal intensive care unit (NICU). The early signs of sepsis are neither specific for the disease, nor very sensitive, and infants are often not diagnosed until they are very ill. Diagnostic testing via blood cultures is usually reserved until signs of illness appear, and even so are limited by the very small amounts of blood that can be safely removed and the length of time before results are available.
Premature infants in the NICU have high risk for systemic infection because of indwelling vascular catheters and incompletely developed immunity. The NICHD Neonatal Research Network consistently finds a rate of sepsis of 25% or more in very low birth weight (VLBW, <1500g birth weight) infants. Sepsis comes at a high cost – mortality is more than doubled, hospital stay is lengthened by 50%, and neurodevelopmental outcomes are worse. Strategies for early diagnosis are badly needed (40).
We have investigated continuous analysis of heart rate (HR) and RR interval time series as just such an early detection strategy. We have observed abnormal heart rate characteristics (HRC) of reduced variability and transient decelerations that were unlike any variant of normal heart rate variability (HRV) (1, 16, 19, 31), and developed mathematical algorithms that detect them (7, 8, 22, 26, 30, 35). In clinical studies, we have found that abnormal HRC precede clinical signs of illness (13, 15, 17, 18), and can be used by doctors and nurses to raise concerns about sepsis, and to initiate antibiotic treatment much earlier than usual (14, 30).
We suggest that this form of monitoring is unique in clinical medicine, and delivers on the promise of novel mathematical analyses of clinical time series data in the care of individual patients. Here, we review our approach to HRC analysis using mathematical and statistical time series analysis monitoring, including our work on time-domain, frequency-domain, entropy, non-stationarity analysis, and a non-linear dynamical analysis of heart rate decelerations.
Mathematical analysis of neonatal HR – overview
Figure 1 shows the central observations of the overall work.
Figure 1.

Neonatal HR time series. (A) Normal, (B) Reduced variability, (C) Reduced variability and a storm of transient decelerations, (D) Excerpt from (C). All records are from the same infant, and B to D occurred in the hours prior to clinical signs of sepsis.
Figure 1A to C show three 20-minute time series of RR intervals, the times from one heartbeat to the next, from the same infant at various intervals prior to the diagnosis of bacterial neonatal sepsis. Panel A shows normal heart rate variability. Panel B shows reduced baseline variability and a single deceleration – note that the baseline HR does not change, and that the deceleration does not lead to HR less than 100 beats per minute, a conventional alarm threshold in the NICU. Panel C shows a cluster of such decelerations early in the course of gram-negative sepsis, and Panel D shows a 4 minute excerpt.
Prominent among the abnormal HRC are the decelerations. These oscillations of the HR arise from the sinus node, and are unexplained by known periodic phenomena in the cardiovascular system. The transient slowings are usually subclinical – that is, they do not lead to heart rates slow enough to reach alarm thresholds - and thus are not detected by clinical personnel. Most of the measures that we use report on decelerations only indirectly, and only in new work have we developed a deceleration detector. The approach is based on a wavelet transform inspired method for template matching, and has allowed us to detect low-dimensional non-linear dynamics of clustered decelerations (9).
The indirect measures were suggested by inspection of the HR or RR histograms. Figure 2 shows HR time series and histograms from exemplary records. Panel A shows a normal 20-min record, and Panel B shows a record with a storm of decelerations near the time of sepsis.
Figure 2.
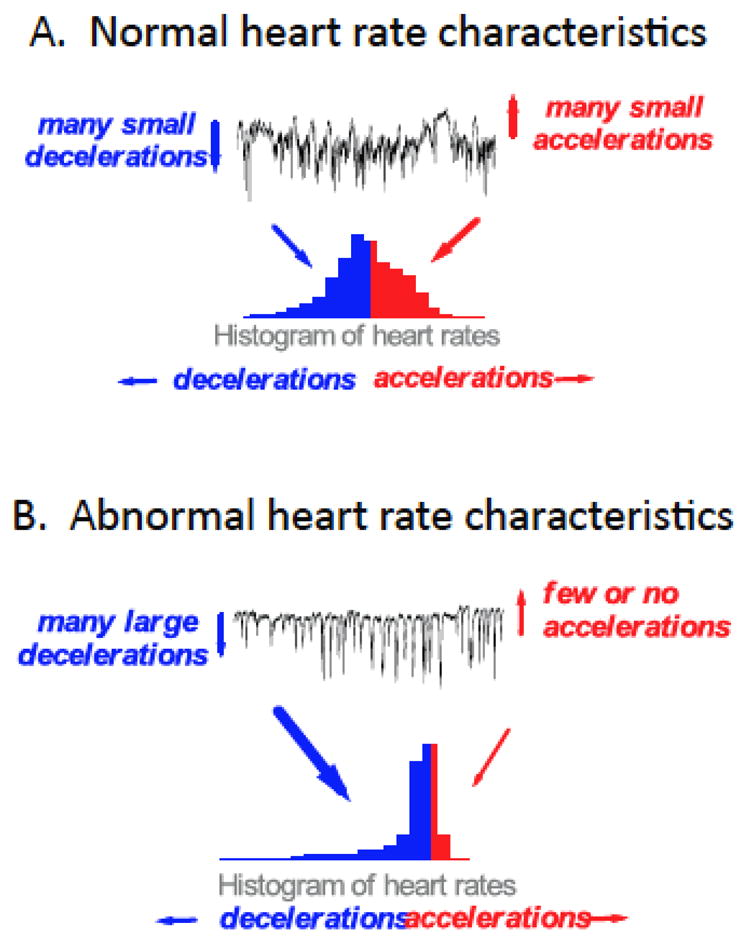
Time series and histograms of neonatal heart rates.
Normal HR, which we consider as a mix of many small decelerations as well as accelerations, leads to a reasonably symmetric histogram. The large decelerations and relative lack of accelerations that characterize abnormal HRC lead to a distinctly asymmetric histogram. Thus our original three HRC metrics can be rationalized – the standard deviation tells us the width of the histogram, the sample asymmetry tells us the degree to which decelerations and accelerations are present, and the sample entropy tells us the degree of non-Gaussianity (Gaussian random numbers have the highest entropy). Each of these measures is described more fully below, as are our tests of measures in the frequency domain, of non-stationarity, and of individual decelerations.
Data collection and filtering
EKG data are collected from bedside monitors, and we analyze sets of 4096 intervals, about 20 to 25 minutes of data depending on the heart rate. For analysis of S.D., sample asymmetry and sample entropy, we filter outlying intervals by eliminating those that are more than 20% from the mean of the previous 15, or if the difference from one interval to the next is more than 5 S.D.s of the last 512 interval-to-interval differences. For smoothing, the time series is low-pass filtered by subtracting a 2M+1 point moving average window:
where n is the index of the RR interval (1 to 4096) and M=100. The -3 dB point is 0.0039 cycles per beat (7). The remaining signal has mean = 0, and is then normalized by dividing by its S.D.
These are severe filtering criteria that serve well the purpose of estimating the statistical properties of distributions of intervals in heart rate series with reduced variability and transient decelerations. We find, though, that many intervals during decelerations are removed. For the deceleration detection we employed a different filtering strategy, eliminating intervals greater than 1000 msec, less than 200 msec, or more than 50 msec different from immediate neighbors. This filtering preserves deceleration structure much better.
Time-domain analysis: Moments
These are descriptive statistics of the set of RR intervals. The rth sample moment mn of a data set x1, x2,…, xn is: . The first moment is the mean. If the mean is 0, the other moments are called central moments. The second central moment is the variance (σ2), a familiar measure of the dispersion. Its square root is the standard deviation (S.D., σ). The third central moment is the skewness, which measures the deviation of the distribution from symmetry. A distribution with a tail toward large values has positive skewness. The fourth central moment about the mean is the kurtosis, which measures “peakedness” of the distribution. A distribution that is flatter or more peaked than the normal distribution has greater and lesser kurtosis, respectively.
The mean and S.D. are most informative when the distribution is bell-shaped (Gaussian or normal). In this special circumstance, all odd-numbered moments higher than the second are 0. Especially for conspicuously non-Gaussian data, non-parametric measures such as percentiles can provide more intuitive information. The percentile (or quantile) of a distribution of values is a number xp such that a proportion p of the population values are less than or equal to xp. For example, the 10th percentile of a variable (we call this p10) is a value such that 10% of the values of the variable fall below that value.
Sample asymmetry
One characteristic of abnormal HRC is a marked asymmetry of the distribution of inter-beat intervals accompanied by an occurrence of large deviations, especially to the right of the distribution median. In order to quantify this observed phenomenon we adapted an approach developed by Kovatchev and coworkers in their studies of blood glucose (21). The first step is to construct a quadratic function that will be used for weighting the deviation of each inter-beat interval from a median of the set of n RR intervals x1, x2, ... xn. Figure 2 presents a quadratic function r(xi)=(xi-m)2where m is the median of the data. The two branches of this parabola quantify deviations towards increase (we call this R2) and decrease (R1) of an inter-beat interval with respect to the median. We compute r1(xi)=r(xi) if xi<m; 0 otherwise, and r2(xi)=r(xi) if xi>m; 0 otherwise for each RR interval xi. R1 and R2 are computed as:
respectively. R1 and R2 are non-negative quantities that increase when the number and/or the magnitude of large deviations from the median increases. Intuitively, a distribution of inter-beat intervals that is skewed to the right by the long RR intervals during decelerations will result in R2 > R1. Thus the characteristic abnormality early in the course of neonatal sepsis is reduced R1 (few or no accelerations) and increased R2 (more and bigger decelerations).
Entropy
Sample entropy analysis
Sample entropy is an estimate of irregularity. In 1991, Pincus introduced approximate entropy (ApEn) as potential measure for clinical use. We found, however, that there are important practical issues in implementing the algorithm. These findings motivated us to develop Sample Entropy (SampEn) in 2000 as an alternative method for entropy estimation in real world data (36). SampEn is a more robust measure less influenced by record length (36), and we optimized its use in detection of reduced variability and transient decelerations in neonatal HR (26). Richman has demonstrated asymptotic normality of the SampEn estimate, and proposed methods for hypothesis testing based on entropies (34).
More recently, Lake refined concepts relevant to quadratic entropy and placed ApEn and SampEn in context (23). An important stride forward was the introduction of a correction for the tolerance r that allows much more flexibility in entropy estimation and avoidance of pitfalls of poor choices of parameters. This allows rational choices of the parameters m and r for each data segment, knowing the individual entropy estimates can be normalized for r and compared directly. We have successfully applied these ideas in detection of atrial fibrillation, a common arrhythmia of adults (24).
In principle, the calculations are simple enough and are depicted in Figure 4.
Figure 4.
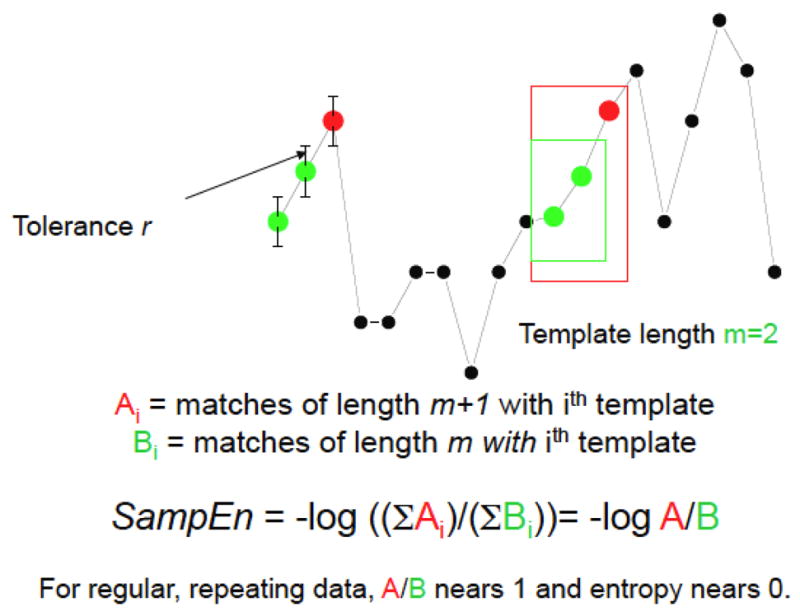
Schema for entropy estimation in HR timer series
For a time-series x1,x2, …,xN, let xm(i) denote the m points xi,xi+1, …,xi+m−1 , which we call a template and can be considered a vector of length m. When all the components of the vector xm(j) are within a distance r of xm(i), there is a template match. Let Bi denote the number of template matches with xm(i) and Ai denote the number of template matches with xm+1(i) . Then pi=Ai/Bi is an estimate of the conditional probability that the point xj+m is within r of xi+m−1 given that xm(j) matches xm(i). Pincus (32) defined approximate entropy or ApEn calculated as the negative average natural logarithm of this conditional probability on a template-by-template basis (in this work, log and logarithm refers to the natural logarithm base e):
Self-matches are included in the original ApEn algorithm to avoid the pi=0/0 indeterminate form, but this convention leads to large bias (33) when there are few other matches.
To give more robust results, we omit self-matches and define sample entropy or SampEn as:
i.e., the negative logarithm of the conditional probability of a match of length m +1 given a match of length m throughout the data set, not template-by-template. SampEn has closer agreement with theory for data of known probabilistic content over a wider range of m, r and N, and its statistical properties are more tractable.
We have addressed the important question of how to make the optimum choice of parameters for the SampEn calculation. A central concept is that the parameters should be relaxed enough - that is, m short enough and r large enough - to allow sufficient numbers of matches, but not so relaxed as to allow all points to match each other.
Our current approach is to pick m based on autocorrelation, and to pick r such that there is a minimum numerator count that allows statistical confidence in the conditional probability fraction (24). This strategy requires that r can vary among templates while still allowing comparison with other values. This is achieved by calculating the quadratic entropy by converting the probability estimate to a density, a step that requires normalizing by the matching volume 2r (23).
A common practice is to interpret low values of entropy as increased order. We have found, though, that time series with spikes have low values of ApEn and SampEn (25), a direct consequence of the practice of basing the tolerance r on the S.D. Spikes inflate the S.D. and allow many template matches of lengths m and m+1 in the baseline. The high CP leads inevitably to a low value for the entropy, but it is not intuitively correct that a large number of matching templates in the baseline necessarily reflect order.
Frequency domain
Frequency domain analysis is a conventional approach to quantifying HRV. Akselrod and coworkers reported three peaks in the HRV power spectrum, at 0.04 Hz, 0.12 Hz, and at the respiratory rate, which they named the low-, mid-, and high-frequency peaks (2). Atropine, which blocks muscarinic acetylcholine receptors and therefore the parasympathetic nervous system, eliminated the high-frequency peak and greatly reduced the mid-frequency peak. Subsequent addition of propranolol, which blocks beta-adrenergic receptors and therefore the sympathetic nervous system, eliminated the remaining peaks. Thus, it is accepted that high (i.e., respiratory sinus arrhythmia) and mid-frequency HRV results mainly from parasympathetic activity, and that low frequency HRV results (at least somewhat) from sympathetic activity.
We find four fundamental problems with applying frequency domain analysis to the study of human heart rates. First, as originally conceived, the Fourier transformation seeks to characterize a signal that is the sum of periodic components that do not change their behaviors over time – in other words, a periodic signal that is stationary if only in the weakest sense that the mean and variance do not change over time (3). These conditions only rarely apply to the human heart rate, and in particular do not apply to the abnormal heart rate characteristics of transient decelerations that we seek to identify and understand. Second, the amount of sinus arrhythmia depends on the rate and the regularity of breathing. At fast rates, sinus arrhythmia is greatly decreased or absent even in the same individual at fast rates or if breaths are taken randomly with respect to time (5). Third, the heart rate only marginally meets the Nyquist criterion for sampling the respiratory rate at more than 2 points per cycle in neonates. This leads to assignment of some of the HRV due to respiration to frequencies lower than that of respiration, a phenomenon appropriately called “cardiac aliasing” (37, 41)
Fourth, the mathematics assume that the time series has been sampled at equal time intervals – this clearly does not apply, as the samples are the RR intervals themselves, and it is their variability that interests us. For the first, second and third problems, there are no excellent answers except to study sinus arrhythmia during slow, controlled regular breathing. For the fourth problem, that of using Fourier techniques for unevenly sampled data, there are two workable solutions. The first is an elegant interpolation technique introduced by RD Berger that converts the RR data to evenly-sampled point estimates of heart rate based on a weighted average of recent RR intervals (4). The second is the Lomb periodogram, a technique born in astrophysics (27) and applied to HR originally by GB Moody (28).
Using these methods, we calculated frequency domain characteristics of RR intervals near the time of neonatal sepsis using both Berger’s method and the Lomb periodogram (8). We affirmed that the Berger’s algorithm acted as a low-pass filter, and accentuated low frequency power while the Lomb method did not. We found, however, no convincing useful differences in the frequency content of time series near the time of sepsis. As in many studies of HRV in illness, there was less power in all frequency bands, especially in the lowest. There was modest statistical impact on predictive models using demographic information. We have not employed frequency-domain measures in our current bedside monitors.
Non-stationarity
Heart rate is not a stationary signal, and we reasoned that measures of stationarity would fall further near illness in the presence of abrupt decelerations. A hallmark of this behavior is that short epochs of points during the deceleration would be unlike the great majority of other points. We devised a test based on the Kolmogorov-Smirnov two-sample test (20, 38, 39), which relates the probability of the null hypothesis (the epochs belong to the same distribution) to the maximum vertical distance D between the empirical cumulative distribution functions (ECDF) of the epochs (7).
The ECDF is formed by ranking the values from smallest to largest, converting them to order statistics. In a set of n values, the first order statistic is the smallest value, the nth is the largest value, and the kth is the kth smallest. The ECDF plots k/n, the relative rank, as a function of order statistics, and increases from 0 to 1. As a statistical tool, it is non-parametric and can be used for any data distribution.
We formed ECDFs of many short RR interval epochs, and compared pairs with the Kolmogorov-Smirnov two-sample test. We examined several characteristics of these analyses from many randomly selected pairs, including a new measure, the area between cumulative distributions. As shown in Figure 5, we used real and synthetic data sets with known numerical properties to develop theory and practice.
Figure 5.

Examples of test data sets. (A) random numbers within a possible range of a RR intervals (mean 400, S.D. 25). (B),(C),(D) RR intervals from a same infant when the infant was healthy (B), and within 3 to 6 hours prior to an episode of sepsis when the RR interval time series was (C) abnormal with low variability and (D) abnormal with low variability and transient deceleration.
The exercise is to measure the maximum distance D between the ECDF pairs from the observed data, and compare to the expected result from theory (16). As shown in Figure 6, only random numbers (panel A) matches this contour well. None of the observed data sets match the results for stationarity, and the result for the record with reduced variability and transient decelerations (panel D) is particularly abnormal, with a high proportion of records with D=1, the expected result when the ECDFs do not overlap at all.
Figure 6.

Histogram of KS distance D for test datasets in Figure 5 to demonstrate stationarity. The smoothed contour is the expected histogram for a stationary dataset theoretically.
From these observations, we developed related metrics on non-stationarity. For example, we measured the area between the expected and observed ECDFs, and found in a clinical data set that the new metric had a significant association with neonatal RR interval time series prior to the clinical diagnosis of sepsis (7).
Deceleration detection
We have recently completed a systematic evaluation of the decelerations themselves (9). The approach was based on the observation that most appeared to have similar characteristics from infant to infant. Hence, Flower devised an analytic expression that described an individual deceleration and used a patter-searching and scaling algorithm with features of wavelet transform methods. In a large data set, she identified many decelerations and made a number of seminal observations. First, she affirmed the idea that large decelerations of neonatal HR indeed are very similar in infants, suggesting a common pathophysiological basis for them. Second, she showed that the frequency of decelerations increases near the time of the clinical diagnosis of neonatal sepsis. Third, she found several infants with repeated and almost completely periodic clusters of decelerations (one is shown as panels C and D of Figure 1). Finally, she was able to show that the dynamics of clustering of decelerations could be successfully modeled as a Hopf bifurcation, a familiar path to chaos in dynamical systems.
This final finding is interesting in its own right, and the number of decelerations may well be clinically useful in early detection of neonatal sepsis. Perhaps more importantly, though, is the prospect of deploying the formidable arsenal of non-linear dynamical mathematics on clinical problems such as early detection of subacute potentially catastrophic illnesses. Consideration of the human as an integrated organism whose health depends on successful non-linear coupling of organs through extracellular and intracellular signaling was advanced by Buchman (6, 10), Goldberger (11, 12) and their coworkers. Our finding of deterministic non-linear dynamics of cardiovascular oscillations at the bedsides of critically ill premature infants emphatically underscore these ideas, and justify much further work in this field.
Summary
We have applied principles of statistical signal processing and non-linear dynamical systems to the clinical problem of early detection of neonatal sepsis in premature infants in the Neonatal ICU. We have based our work on the repeated observation of abnormal heart rate characteristics (HRC) of reduced variability and transient decelerations in the hours to days prior to the clinical appearance of illness. To test the real-world applicability of our findings, we have completed a large randomized clinical trial to test the impact of HRC monitoring on neonatal outcomes, the results of which we expect to be published in 2011 (29).
Figure 3.

Sample asymmetry weights deviations from the center of a distribution.
Acknowledgments
Funded by the American Heart Association, National Institutes of Health, Swortzel Foundation.
References
- 1.Aghili AA, Rizwan u, Griffin MP, Moorman JR. Scaling and ordering of neonatal heart rate variability. Phys Rev Lett. 1995;74:1254–1257. doi: 10.1103/PhysRevLett.74.1254. [DOI] [PubMed] [Google Scholar]
- 2.Akselrod S, Gordon D, Ubel FA, Shannon DC, Barger AC, Cohen RJ. Power spectrum analysis of heart rate fluctuation: a quantitative probe of beat-to-beat cardiovascular control. Science. 1981;213:220–222. doi: 10.1126/science.6166045. [DOI] [PubMed] [Google Scholar]
- 3.Bendat JS, Piersol AG. Random data: Analysis and measurement procedures. New York: John Wiley; 1986. p. 566. [Google Scholar]
- 4.Berger RD, Akselrod S, Gordon D, Cohen RJ. An efficient algorithm for spectral analysis of heart rate variability. IEEE Transactions on Biomedical Engineering. 1986;BME-33:900–904. doi: 10.1109/TBME.1986.325789. [DOI] [PubMed] [Google Scholar]
- 5.Brown TE, Beightol LA, Koh J, Eckberg DL. Important influence of respiration on human R-R interval power spectra is largely ignored. Journal of Applied Physiology. 1993;75:2310–2317. doi: 10.1152/jappl.1993.75.5.2310. [DOI] [PubMed] [Google Scholar]
- 6.Buchman TG. Nonlinear dynamics, complex systems, and the pathobiology of critical illness. CurrOpinCrit Care. 2004;10:378–382. doi: 10.1097/01.ccx.0000139369.65817.b6. [DOI] [PubMed] [Google Scholar]
- 7.Cao H, Lake DE, Griffin MP, Moorman JR. Increased nonstationarity of neonatal heart rate before the clinical diagnosis of sepsis. Ann Biomed Eng. 2004;32:233–244. doi: 10.1023/b:abme.0000012743.81754.0b. [DOI] [PubMed] [Google Scholar]
- 8.Chang KL, Monahan KJ, Griffin MP, Lake D, Moorman JR. Comparison and clinical application of frequency domain methods in analysis of neonatal heart rate time series. Ann Biomed Eng. 2001;29:764–774. doi: 10.1114/1.1397791. [DOI] [PubMed] [Google Scholar]
- 9.Flower AA, Moorman JR, Lake DE, Delos JB. Dynamical theory of periodic heart rate decelerations in premature infants. Experimental Medicine and Biology. 2010;235:531–538. doi: 10.1258/ebm.2010.009336. [DOI] [PMC free article] [PubMed] [Google Scholar]
- 10.Godin PJ, Buchman TG. Uncoupling of biological oscillators: a complementary hypothesis concerning the pathogenesis of multiple organ dysfunction syndrome. Crit Care Med. 1996;24:1107–1116. doi: 10.1097/00003246-199607000-00008. [DOI] [PubMed] [Google Scholar]
- 11.Goldberger AL, Amaral LA, Hausdorff JM, Ivanov PC, Peng CK, Stanley HE. Fractal dynamics in physiology: alterations with disease and aging. Proc Natl Acad Sci USA. 2002;99 (Suppl 1):2466–2472. doi: 10.1073/pnas.012579499. [DOI] [PMC free article] [PubMed] [Google Scholar]
- 12.Goldberger AL, West BJ, Degn H, Holden AV, Olsen LF. Chaos in biological systems. New York: Plenum Press; 1987. Chaos in physiology: health or disease? In; pp. 1–4. [Google Scholar]
- 13.Griffin MP, Lake D, Moorman JR. Heart rate characteristics and clinical signs in neonatal sepsis. Pediatric Research. 2007;61:222–227. doi: 10.1203/01.pdr.0000252438.65759.af. [DOI] [PubMed] [Google Scholar]
- 14.Griffin MP, Lake DE, Bissonette EA, Harrell FE, Jr, O'Shea TM, Moorman JR. Heart rate characteristics: novel physiomarkers to predict neonatal infection and death. Pediatrics. 2005;116:1070–1074. doi: 10.1542/peds.2004-2461. [DOI] [PubMed] [Google Scholar]
- 15.Griffin MP, Lake DE, Moorman JR. Heart rate characteristics and laboratory tests in neonatal sepsis. Pediatrics. 2005;115:937–941. doi: 10.1542/peds.2004-1393. [DOI] [PubMed] [Google Scholar]
- 16.Griffin MP, Moorman JR. Toward the early diagnosis of neonatal sepsis and sepsis-like illness using novel heart rate analysis. Pediatrics. 2001;107:97–104. doi: 10.1542/peds.107.1.97. [DOI] [PubMed] [Google Scholar]
- 17.Griffin MP, O'Shea TM, Bissonette EA, Harrell FE, Jr, Lake DE, Moorman JR. Abnormal heart rate characteristics are associated with neonatal mortality. Pediatr Res. 2004;55:782–788. doi: 10.1203/01.PDR.0000119366.21770.9E. [DOI] [PubMed] [Google Scholar]
- 18.Griffin MP, O'Shea TM, Bissonette EA, Harrell FE, Jr, Lake DE, Moorman JR. Abnormal heart rate characteristics preceding neonatal sepsis and sepsis-like illness. Pediatr Res. 2003;53:920–926. doi: 10.1203/01.PDR.0000064904.05313.D2. [DOI] [PubMed] [Google Scholar]
- 19.Griffin MP, Scollan DF, Moorman JR. The dynamic range of neonatal heart rate variability. Journal of Cardiovascular Electrophysiology. 1994;5:112–124. doi: 10.1111/j.1540-8167.1994.tb01151.x. [DOI] [PubMed] [Google Scholar]
- 20.Kolmogorov A. Sulla determinazione empirica di una legge di distribuzione. IstItalAttuariG. 1933;4:1–11. [Google Scholar]
- 21.Kovatchev BP, Cox DJ, Gonder-Frederick LA, Clarke W. Symmetrization of the blood glucose measurement scale and its applications. Diabetes Care. 1997;20:1655–1658. doi: 10.2337/diacare.20.11.1655. [DOI] [PubMed] [Google Scholar]
- 22.Kovatchev BP, Farhy LS, Cao H, Griffin MP, Lake DE, Moorman JR. Sample asymmetry analysis of heart rate characteristics with application to neonatal sepsis and systemic inflammatory response syndrome. Pediatr Res. 2003;54:892–898. doi: 10.1203/01.PDR.0000088074.97781.4F. [DOI] [PubMed] [Google Scholar]
- 23.Lake DE. Renyi entropy measures of heart rate Gaussianity. IEEE TransBiomed Eng. 2006;53:21–27. doi: 10.1109/TBME.2005.859782. [DOI] [PubMed] [Google Scholar]
- 24.Lake DE, Moorman JR. Accurate estimation of entropy in very short physiological time series: The problem of atrial fibrillation detection in implanted ventricular devices. Am J Physiol Heart Circ Physiol. 2011;300:H319–325. doi: 10.1152/ajpheart.00561.2010. [DOI] [PubMed] [Google Scholar]
- 25.Lake DE, Richman JS, Griffin MP, Moorman JR. Sample entropy analysis of neonatal heart rate variability. Am J Physiol Regul Integr Comp Physiol. 2002;283:R789–797. doi: 10.1152/ajpregu.00069.2002. [DOI] [PubMed] [Google Scholar]
- 26.Lake DE, Richman JS, Griffin MP, Moorman JR. Sample entropy analysis of neonatal heart rate variability. American Journal of Physiology. 2002;283:R789–R797. doi: 10.1152/ajpregu.00069.2002. [DOI] [PubMed] [Google Scholar]
- 27.Lomb NR. Least-squares frequency analysis of unequally spaced data. Astrophysics and Space Science. 1976;39:447–462. [Google Scholar]
- 28.Moody GB. Spectral analysis of heart rate without resampling. Computers in cardiology. 1993:715–718. [Google Scholar]
- 29.Moorman JR, Carlo WA, Kattwinkel J, Schelonka RL, Porcelli PJ, Naverrete CT, Bancalari E, Aschner JL, Walker MW, Perez JA, Palmer C, Wagner DP, Stukenborg GJ, Lake DE, O'Shea TM. Mortality reduction by heart rate characteristics monitoring in very low birthweight neonates: a randomized trial. Journal of Pediatrics. 2011 doi: 10.1016/j.jpeds.2011.06.044. In press. [DOI] [PMC free article] [PubMed] [Google Scholar]
- 30.Moorman JR, Lake DE, Griffin MP. Heart rate characteristics monitoring in neonatal sepsis. IEEE Transactions in Biomedical Engineering. 2006;53:126–132. doi: 10.1109/TBME.2005.859810. [DOI] [PubMed] [Google Scholar]
- 31.Nelson JC, Rizwan u, Griffin MP, Moorman JR. Probing the order within neonatal heart rate variability. Pediatr Res. 1998;43:823–831. doi: 10.1203/00006450-199806000-00017. [DOI] [PubMed] [Google Scholar]
- 32.Pincus SM. Approximate entropy as a measure of system complexity. Proceedings of the National Academy of Science. 1991;88:2297–2301. doi: 10.1073/pnas.88.6.2297. [DOI] [PMC free article] [PubMed] [Google Scholar]
- 33.Pincus SM, Goldberger AL. Physiological time-series analysis: what does regularity quantify? American Journal of Physiology. 1994;266:H1643–H1656. doi: 10.1152/ajpheart.1994.266.4.H1643. [DOI] [PubMed] [Google Scholar]
- 34.Richman JS. Sample entropy statistics and testing for order in complex physiological signals. Communications in statistics - theory and methods. 2006;36 [Google Scholar]
- 35.Richman JS, Lake DE, Moorman JR. Sample entropy. Methods Enzymol. 2004;384:172–184. doi: 10.1016/S0076-6879(04)84011-4. [DOI] [PubMed] [Google Scholar]
- 36.Richman JS, Moorman JR. Physiological time series analysis using approximate entropy and sample entropy. American Journal of Physiology. 2000;278:H2039–H2049. doi: 10.1152/ajpheart.2000.278.6.H2039. [DOI] [PubMed] [Google Scholar]
- 37.Rother M, Witte H, Zwiener U, Eiselt M, Fischer P. Cardiac aliasing--a possible cause for the misinterpretation of cardiorespirographic data in neonates. Early Human Development. 1989;20:1–12. doi: 10.1016/0378-3782(89)90068-6. [DOI] [PubMed] [Google Scholar]
- 38.Smirnov NV. Ob uklonenijah empiricheskoi krivoi raspredelenija. Recueil MathMatSbornik, NS. 1939;6:13–26. [Google Scholar]
- 39.Smirnov NV. On the estimation of the discrepancy between empirical curves of distributions for two independent samples. Bull Math Univ Moscou. 1939;2 [Google Scholar]
- 40.Stoll BJ, Hansen N, Fanaroff AA, Wright LL, Carlo WA, Ehrenkranz RA, Lemons JA, Donovan EF, Stark AR, Tyson JE, Oh W, Bauer CR, Korones SB, Shankaran S, Laptook AR, Stevenson DK, Papile LA, Poole WK. Late-onset sepsis in very low birth weight neonates: the experience of the NICHD Neonatal Research Network. Pediatrics. 2002;110:285–291. doi: 10.1542/peds.110.2.285. [DOI] [PubMed] [Google Scholar]
- 41.Witte H, Zwiener U, Rother M, Glaser S. Evidence of a previously undescribed form of respiratory sinus arrhythmia (RSA)--the physiological manifestation of “cardiac aliasing”. Pflugers Archiv - European Journal of Physiology. 1988;412:442–444. doi: 10.1007/BF01907565. [DOI] [PubMed] [Google Scholar]