

Abstract
Cichlid fishes are an ideal model system for studying biological diversification because they provide textbook examples of rapid speciation. To date, there has been little focus on the role of gene regulation during cichlid speciation. However, in recent years, gene regulation has been recognized as a powerful force linking diversification in gene function to speciation. Here, we investigated the potential role of miRNA regulation in the diversification of six cichlid species of the Midas cichlid lineage (Amphilophus spp.) inhabiting the Nicaraguan crater lakes. Using several genomic resources, we inferred 236 Midas miRNA genes that were used to predict the miRNA target sites on 8,232 Midas 3′-UTRs. Using population genomic calculations of SNP diversity, we found the miRNA genes to be more conserved than protein coding genes. In contrast to what has been observed in other cichlid fish, but similar to what has been typically found in other groups, we observed genomic signatures of purifying selection on the miRNA targets by comparing these sites with the less conserved nontarget portion of the 3′-UTRs. However, in one species pair that has putatively speciated sympatrically in crater Lake Apoyo, we recovered a different pattern of relaxed purifying selection and high genetic divergence at miRNA targets. Our results suggest that sequence evolution at miRNA binding sites could be a critical genomic mechanism contributing to the rapid phenotypic evolution of Midas cichlids.
Keywords: miRNA, gene regulation, Neotropical cichlids, adaptation, sympatric speciation, purifying selection
Introduction
The fundamental role of regulatory changes in the phenotypic diversification of species was first proposed about 40 years ago (Britten and Davidson 1969; King and Wilson 1975). This early work postulated that the small differences in protein sequences between humans and chimpanzees were insufficient to explain the pronounced phenotypic differences between these species. Now, after intense research on regulatory evolution with much focus on its role in phenotypic diversification and speciation, regulation of gene expression in its various forms is considered one of the fastest and most effective mechanisms underlying adaptive evolution (e.g., reviewed in Carroll 2008). Direct evidence of the connection between cis-acting mutations and gene expression combined with evidence of signatures of divergent and positive selection in target sequences of putative gene regulatory elements, have highlighted the importance of these genomic regions in phenotypic divergence between closely related species (Miller et al. 2007; Berezikov 2011; Hausser and Zavolan 2014). For example, the evolutionary history of transcription factors and RNA binding proteins, and how their interactions with protein targets change over evolutionary time, has recently been the subject of intensive investigation (Gerstberger et al. 2014; Villar et al. 2014). This work represents an important step toward understanding the differences between organisms and how gene expression programs are rewired during evolution (Hogan et al. 2015). Additionally, several studies have provided further evidence that mutations that alter the expression of genes contribute to adaptive phenotypic evolution (Wittkopp et al. 2003; Shapiro et al. 2004; Chan et al. 2010; Romero et al. 2012; Seehausen et al. 2014).
In the past 15 years, microRNAs (miRNAs) have emerged as key post-transcriptional regulators of gene expression (Bartel 2004; He and Hannon 2004; Berezikov 2011; Li et al. 2012; Pritchard et al. 2012). These small RNA molecules (≈22 nt) modulate the expression of protein-coding genes by inhibiting translation or by inducing mRNA degradation (Berezikov 2011). The levels of expression of miRNA target genes can thus be altered by variation in levels of miRNA expression, genetic variants of miRNA loci, and mutations in miRNA target sites (Lu and Clark 2012). For this reason, miRNAs play an important role in development (Lagos-Quintana et al. 2001; Ketley et al. 2013) and regulate a variety of pivotal biological processes (Gupta et al. 2006; Friedman et al. 2009). It has been recognized that miRNAs have the potential to facilitate evolutionary change (Li and Zhang 2013), thus playing a role in animal evolution (Peterson et al. 2009). Notably, it has recently been shown that differences in miRNA expression might be involved in morphological evolution, and therefore in generating organismal diversity (Berezikov 2011; Arif et al. 2013; Jovelin and Cutter 2014). It has also been suggested that natural selection could act on mutations in miRNA target sites resulting in variation in expression of miRNA target genes (Lu and Clark 2012). Generally, most miRNA families have targets that are conserved among related animal species (Friedman et al. 2009; Hiard et al. 2010) and evolve under purifying selection (Chen and Rajewsky 2006), likely because of the functional importance of the miRNA target genes. However, a smaller fraction of a species’ miRNA targets might not be well conserved across taxa, as has been observed in mammals (Sethupathy et al. 2006). Surprisingly, accelerated sequence evolution has been reported in African cichlid fish for most of the miRNA target sites (Loh et al. 2011).
Due to their extremely rapid phenotypic diversification and speciation, cichlid fish are one of the most well-known model systems for the study of biological diversification (Meyer 1993; Kocher 2004). With ∼2,000 species, cichlids have formed spectacularly diverse and species-rich adaptive radiations showing impressive variation in body shape, coloration and behaviour (Verheyen et al. 2003). Cichlid radiations in East Africa’s large rift lakes are among the most famous adaptive radiations in the animal kingdom. Here, hundreds of cichlid species coexist in individual lakes that are up to 500,000 (Lake Victoria), 5 million (Lake Malawi) and 12 million (Lake Tanganyika) years old. Independent radiations of cichlids have repeatedly evolved similar phenotypes in parallel in response to the same ecological circumstances—making them a textbook example of convergent evolution (Meyer et al. 1990; Elmer and Meyer 2011). These ecologically similar forms (ecotypes) are likely the product of parallel regimes of natural selection in different lakes, yet virtually nothing is known about the genetic mechanisms underlying this phenomenon of repeated evolution. Despite the potential importance of the regulatory role of miRNAs in producing phenotypic variation, studies linking phenotypic diversification of cichlids and miRNA variation are still in an embryonic stage (Loh et al. 2011; Brawand et al. 2014).
Neotropical fishes of the Midas cichlid species complex (the Amphilophus citrinellus species group) are a particularly tractable model for investigating the molecular genetic basis of speciation. In this system, in which 13 species have been described, adaptive radiations have formed repeatedly in crater lakes that are <20,000 years old from a single source population (Wilson et al. 2000; Barluenga and Meyer 2004; Elmer, Kusche, et al. 2010, 2014; Kautt et al. 2012). As a result of parallel sympatric speciation events promoted by ecological factors, new species have arisen in the face of the homogenizing effects of gene flow (Barluenga et al. 2006; Elmer and Meyer 2011; Elmer et al. 2014). Unlike the great lakes system of Eastern Africa where the huge genetic and phenotypic diversity is the complex product of relatively old radiations (up to 12 Myr old), the younger radiations occurring in the Nicaraguan crater lakes offer a simpler, more tractable case study of fast sympatric divergence (Barluenga and Meyer 2010). This array of small, deep, and young (<2,000–∼20,000 years old) crater lakes have been colonized from source populations living in the old and larger Lakes Nicaragua and Managua. In these young lakes, Midas cichlids have diverged in body shape, pharyngeal jaw shape and gut microbiota (Barluenga et al. 2006; Elmer, Kusche, et al. 2010, 2014; Franchini, Fruciano, Frickey, et al. 2014; Franchini, Fruciano, Spreitzer, et al. 2014). In two crater lakes, Apoyo and Xiloá, small and monophyletic adaptive radiations have occurred and rapidly produced multiple species comprising open water “arrow-shaped” (limnetic ecomorphs) and bottom dwelling “high-bodied” (benthic ecomorphs) forms (Elmer et al. 2014; Franchini, Fruciano, Spreitzer, et al. 2014). Each radiation harbors a single limnetic species and multiple (five in Lake Apoyo and three in Lake Xiloá) benthic species. It has been suggested that these radiations have occurred because the deep, clear water of the crater lakes provided new niches (e.g., the open water environment), that are absent in the shallow, turbid water of the ancestral great lakes (Elmer, Kusche, et al. 2010).
We are now beginning to understand how genetic variation produces the actual observed phenotypic patterns in this group. For instance, genes putatively under positive selection have been identified through transcriptomic analysis (Elmer, Fan, et al. 2010), and quantitative trait loci for body shape have recently been found (Franchini, Fruciano, Spreitzer, et al. 2014). However, our understanding of the different genetic processes underpinning phenotypic differentiation in these fish is still limited.
Here, we use genomic data and bioinformatic tools to investigate the potential role of miRNA regulation in the diversification of the Midas cichlid species group. Specifically, using a set of predicted miRNAs, we investigated sequence evolution at miRNA binding sites in the Midas cichlid adaptive radiation. We targeted six species occurring in the Nicaraguan crater lakes Apoyo and Xiloá (including a benthic and a limnetic species from each lake) and in the two large and old lakes, Nicaragua and Managua (both housing the ancestral benthic species A. citrinellus) (fig. 1). We find evidence of purifying selection acting on miRNA binding sites. Surprisingly, the Lake Apoyo species pair showed a different pattern of sequence evolution that could have been driven by a “relaxation” of purifying selection and is a candidate molecular mechanism that might have contributed to species diversification in this sympatric setting.
Fig. 1.—

Nicaraguan lake system. Pictures of representative specimens of six forms of the Midas cichlid group: Amphilophus citrinellus from Lake Nicaragua and Lake Managua, A. astorquii and A. zaliosus from crater Lake Apoyo, A. amarillo and A. sagittae from crater Lake Xiloá. According to their ecomorphological specialization, the six species were labelled as “benthic” or “limnetic”.
Materials and Methods
Midas Species Selection
For this study, we targeted six Midas species/forms: the two A. citrinellus forms living in the great lakes Nicaragua and Managua, and two species pairs from each crater lake, Apoyo (A. astorquii and A. zaliosus) and Xiloá (A. amarillo and A. sagittae) (fig. 1). From each crater lake, the only limnetic (A. zaliosus from Apoyo and A. sagittae from Xiloá) and a representative benthic species (A. astorquii from Apoyo and A. amarillo from Xiloá) were selected because of their different ecomorphological specialization. Among the benthic species from each crater lake radiation, A. astorquii and A. amarillo were chosen as being the best studied so far, and the species with the highest sequence coverage in existing population genomics data sets (thus allowing more accurate sequence evolution estimates).
Midas miRNAs Detection
A data set including precursor miRNAs (pre-miRNAs) and mature miRNAs was downloaded from miRBase release 20 (Kozomara and Griffiths-Jones 2011) for eight teleost fish species (Danio rerio, Fugu rubripes, Tetraodon nigroviridis, Oryzias latipes, Paralichthys olivaceus, Hippoglossus hippoglossus, Cyprinus carpio, Ictalurus punctatus). The teleost pre-miRNA sequences were aligned to the Midas draft genome v5 (Elmer et al. 2014) using the similarity search BLASTn v2.2.26 algorithm (Altschul et al. 1990) with an e-value cutoff of 1e − 5. Potential Midas pre-miRNAs were extracted from the Midas genome according to the BLAST hit coordinates and their secondary structure was predicted using a minimum free energy (MFE) approach implemented in CLC Genomics Workbench v6.5.1 (CLC bio, Aarhus, Denmark). Here, the stability of a given secondary structure (stem-loop structure) is defined by the amount of free energy released by its formation. Default Mfold v3.4 (Zuker 2003) thermodynamic energy parameters were used. Finally, the teleost mature miRNA data set was aligned to the retained Midas pre-miRNAs using BLASTn (e-values cutoff 1e − 5) and the Midas mature forms extracted.
Midas 3′-UTRs Detection
A data set including teleost fish 3′-UTR sequences and proteins was used to extract the 3′-UTR regions from the Midas genome with the following pipeline: (1) the sequences of the last exon for each annotated gene in nine teleost genomes (Astyanax mexicanus, Danio rerio, Fugu rubripes, Gadus morhua, Gasterosteus aculeatus, Oreochromis niloticus, Oryzias latipes, Tetraodon nigroviridis, Xiphophorus maculatus) from Ensembl release 73 (Cunningham et al. 2015) were extracted; (2) tBLAST v2.2.26 (e-values cutoff 1e − 10), using the teleost exons as queries, was used to identify Midas coding sequences (CDS) > 100 bp, with a match length > 80% and containing a stop codon within ± 9 bp from the end of the match; and (3) sequences downstream of the identified stop codon (ranging from 100 bp and the length of the query teleost 3′-UTR) were extracted from the Midas genome and used as reference for miRNA target prediction.
MicroRNA Target Prediction
The Midas mature miRNAs were used to predict miRNA binding sites on the Midas 3′-UTRs with the target prediction tool miRanda v3.3a (Enright et al. 2004). The miRanda algorithm is based on a comparison of miRNAs complementarity to 3′-UTR regions, in which the binding energy of the duplex structure, the evolutionary conservation of the whole target site and its position within the 3′-UTR, are calculated. The complementarity required “strict” alignments in the seed region (offset positions 2–8), minimum alignment score of 140 and minimum energy threshold of −20.0 kcal/mol. The remaining parameters were set as default. The predicted miRNA target sites and the 3′-UTRs were annotated for downstream SNP discovery in the six species.
Annotation of Midas Coding Regions
As a reliable annotation for the Midas genome is not yet available, a robust transcriptome data set was generated and aligned to the genome to infer its gene structure using the program GMAP v2015-11-20 (Wu and Watanabe 2005). In detail, the following steps were applied:
Transcriptome Generation
Broods from A. astorquii and A. zaliosus (crater Lake Apoyo), A. amarillo and A. sagittae (crater Lake Xiloá), and A. citrinellus (Lake Nicaragua) were produced in the University of Konstanz animal facility (TFA) and sampled at 1-day post-hatch (1 dph) and 1-month post-hatch (1 mph). In total, nine samples were processed as single units in the downstream RNA extraction and library preparation steps: three samples from 1 dph fish (pooling three individuals in one sample); six samples from 1 mph fish (from a single fish, bodies and heads were separated and treated as different samples). Total RNA from each sample was isolated using a Qiagen RNeasy Mini Kit (Qiagen, Valencia). A FastPrep-24 homogenizer (MP Biomedicals) was used to process 30 μg of each sample (30 s at 4.0 M). RNA quality and quantity was assessed using a Bioanalyzer 2100 (Agilent Technologies, Palo Alto) and a Qubit v2.0 fluorometer (Life Technologies, Darmstadt, Germany), respectively. High-quality RNA samples (RIN value > 8) were used to construct transcriptomic (RNA-Seq) sequencing libraries. About 400 ng of RNA was used to construct a total of 45 barcoded libraries with the Illumina TruSeq RNA sample preparation kit v2 (Low-Throughput protocol) according to the manufacturer’s instructions (Illumina, San Diego). In particular, to maximize the number of unique transcripts, for each of the five species, we used the following three stages/parts: 1 dph larvae, 1 mph body, 1 mph head, each in three biological replicates (so 5 species×3 stages/parts×3 replicates = 45 libraries). Paired-end sequencing (151 bp) was performed in an Illumina HiSeq2500.
After sequencing, we obtained 490,293,234 raw reads (from 81,089,742 to 115,093,936 reads per species), each 146 bp in length (after removing the 5-bp barcode) that were quality-controlled before assembly and downstream analyses. First, Trimmomatic v0.33 (Bolger et al. 2014) was used to remove the remaining adapters and to quality filter the reads using default parameters, discarding sequences shorter than 50 bp. Reference-guided and de novo assembly were performed using the filtered reads of the 45 samples combined. For the reference assembly, we used the program Stringtie v1.0.4 (Pertea et al. 2015) with the Midas genome as reference. Read mapping was performed using TopHat v2.0.14 (Trapnell et al. 2009) and Bowtie v2.2.3 (Langmead and Salzberg 2012) with default parameters. v1.2.1 (Li 2011) was used to convert the Bowtie output alignment from SAM to BAM format in order to obtain the input file for Stringtie. A total of 65,964 transcripts were extracted from the genome using the gffread utility implemented in the Cufflink v2.2.1 package (Trapnell et al. 2010). Trinity v2.06 (Grabherr et al. 2011) was used to generate a de novo assembly with the PasaFly transcript reconstruction mode, k-mer size of 32 and a minimum contig length of 200 bp. To filter out transcripts with unknown function, the obtained de novo assembly (519,882 transcripts) was subjected to similarity searches against a custom database containing the available nine teleost fish proteins used for the 3′-UTR detection (see above) and the well-annotated Human and Mouse protein data sets (Ensembl release 73). The BLASTx v2.2.26 algorithm was used for similarity searches enforcing a cut-off e-value of 1e − 6. A set of 51,035 transcripts aligned to proteins contained in the reference databases and were retained for downstream analyses.
Annotation of Midas Coding Regions
The final set of 116,999 sequences obtained combining the reference and the de novo assembled transcripts was aligned to the Nile tilapia protein data set (Ensembl release 73) using BLASTx. Out of the 46,451 positive hits, the longest Midas transcript among those matching a unique tilapia protein was selected and its coding region was extracted according to the BLAST hit coordinates using bedtools v2.25.0 (Quinlan and Hall 2010). Finally, the coding sequences of the obtained 18,361 Midas transcripts were aligned to the Midas genome using GMAP with default parameters. The output, that includes the annotation of the coding regions, was exported in GFF3 format for downstream analyses.
SNP Calling in the Midas miRNA, 3′-UTRs and Coding Regions
Here, we used the recently published genomic sequences (Elmer et al. 2014) of six pools of 26 individuals for each of five Midas cichlid species from four lakes. Briefly, these comprise fish collected in the great lakes Nicaragua and Managua (A. citrinellus) and in crater lakes Apoyo (A. astorquii and A. zaliosus) and Xiloá (A. amarillo and A. sagittae) (fig. 1). A total of 530,860,846 raw reads were obtained ranging from 69,161,026 reads for A. astorquii to 95,494,772 for A. sagittae (see Elmer et al. 2014 for details). The raw reads of each species were first trimmed to remove the remaining adaptors and then filtered by quality using CLC Genomics Workbench (CLC parameter “limit” set to 0.03 and no more than 1 ambiguous nucleotide per read allowed). The filtered reads were aligned to the Midas genome using Bowtie. The raw mapping results were converted to BAM format using Samtools in which mapping quality was required to be at least 20 to exclude low quality/ambiguous mapped reads. To identify SNPs among species, the software GATK v3.4 (DePristo et al. 2011) was used with the UnifiedGenotyper module, setting a minimum quality score of 20. Low confidence SNPs were filtered using the VariantFiltration GATK module. Intra- and inter-specific SNPs were called in the previously annotated miRNA genes, 3′-UTRs (miRNA target and nontarget regions) and coding regions (for the full set of parameters used in GATK see supplementary files S1, Supplementary Material online).
Analyses of SNP Density and Selection Coefficient
To compute the frequency of SNPs in the miRNA binding sites and in the remaining portions of the 3′-UTRs (called “3′-UTR nontarget regions” from here ongoing), the SNP density for each region was calculated as the number of SNPs divided by the length of the region (that is, the number of SNPs for all the target regions divided the length in bases of all the target regions; the same principle for the computation of SNP density in nontarget regions). SNP density in the miRNA target sites was then assessed against the null hypothesis of equal SNP density of target and nontarget regions, as expected under a model of neutral evolution. In fact, under the assumption that the 3′-UTR nontarget regions are not subject to selection, they should have on an average the same SNP density of the miRNA targets. To test this null hypothesis, we used the same approach previously used to investigate SNP density in miRNA target sites to control for neighbour-dependent mutation rates (Hiard et al. 2010; Loh et al. 2011). In this procedure, the empirical distribution of SNPs in the whole 3′-UTRs under the null hypothesis was obtained by randomly reshuffling the observed SNPs along each 3′-UTR. In particular, SNPs were shuffled to random positions in the 3′-UTRs having the same trinucleotide context (allowing each SNP to be shuffled only to a position in the 3′-UTR containing the same two adjacent bases—e.g., a trinucleotide A[A/G]T in which A/G represents the SNP is allowed to be shuffled only to random AAT or AGT positions). This approach reflects the null hypothesis of equal SNP density as each SNP can be shuffled to a position within or outside the target region. To generate an empirical distribution of SNP densities, this simulation was repeated 1,000 times, where each time the average SNP density in the miRNA target/s in each 3′-UTR was computed. Finally, the miRNA target SNP density observed in our sequences was compared with the average miRNA target SNP density obtained through simulation, and to the empirical distribution obtained in the 1,000 simulations (so to obtain a p value as the proportion of simulations with target SNP density lower than the one observed). We did not observe substantial differences in base composition between miRNA targets and the 3′-UTR background sequence space (miRNA targets: A, 29.2%; T, 30.5%; G, 19.9% C, 20.4%—3′-UTRs: A, 29.7%; T, 30.5%; G, 20.0% C, 19.8%). This prevents bias in the SNP shuffling. This procedure was performed at two levels. First, the reads of all six species were merged in order to evaluate the general pattern of SNP density in the Midas cichlid group. Second, the analysis was carried out for each species independently.
Further, we also compared different species using a new procedure in which the rationale is similar to the one described above for the comparison of SNP density between target and 3′-UTR nontarget regions. In this case, to simulate the expectation under the null hypothesis of no difference between species, instead of shuffling SNPs between target and nontarget regions, SNPs observed in each 3′-UTR were shuffled between corresponding regions (target and nontarget regions) of different species, maintaining their trinucleotide context. This simulation procedure was repeated 1,000 times for each pairwise species comparison, thus allowing us to obtain the empirical distribution of the difference between species in target SNP density (relative to the total number of SNPs of the whole 3′-UTR) under the null hypothesis of no difference in miRNA target SNP density between species. The observed difference in SNP density between species was then compared with this simulated empirical distribution.
The level of selective pressure acting on each miRNA target site was calculated as “s” (Hiard et al. 2010). We can assume that selection pressure s has acted on target regions for each 3′-UTR comprising a proportion p of miRNA targets, whereas nontarget regions (1-p) evolve neutrally. Following these assumptions, the level of selection of miRNA target/s in each 3′-UTR was assessed as being subjected to positive selection, purifying selection or neutral selection when the observed SNP density in target sites is lower, higher, or equal to the simulated SNP density, respectively. As all these situations occurred in our data set, we used three different formulas following the same assumptions as in Hiard et al. (2010) but allowing “s” to have: (1) positive values (positive selection): (1 > s > 0, s = proportion of SNPs kept by selection); (2) negative values (purifying selection): (−1 < s < 0, |s| = proportion of SNPs eliminated by selection); and (3) equal to 0 (neutral selection): (s = 0) (see supplementary file S2, Supplementary Material online for details).
To graphically show the selective pressures acting on miRNA binding sites, a principal component analysis (PCA) was performed. The input raw data matrix included all the “s” values for each 3′-UTR for each species.
Finally, to have a frame of reference for SNP density in various regions of the genome, we calculated the SNP density in the coding regions. To do this, we computed SNP density in the genomic regions identified as coding using the transcriptome-based procedure outlined above (see section Annotation of Midas coding regions). The SNP density in coding regions was computed using the same starting data (i.e., the Pool-Seq data of Elmer et al. 2014) and the same principles (i.e., number of SNPs divided by the total length of the coding regions) that we used to calculate the SNP density in the 3′-UTRs.
Analysis of Genomic Divergence
The Popoolation2 v1.201 (Kofler et al. 2011) pipeline was used to compute the allele frequencies and the fixation index (FST) in the two crater lake species pairs: Lake Apoyo (A. astorquii vs. A. zaliosus) and Lake Xiloá (A. amarillo vs. A. sagittae). Prior to computation of these statistics, genomic sites were subsampled up to the target coverage of 7 to avoid bias across sites produced by a nonuniform coverage. The minimum minor allele count at each site was set to 2. Allele frequencies and FST values were computed at every single SNP as it is not possible to compute FST estimates at miRNA targets using a sliding window approach due to the limited length of miRNA target sequences.
Results
MicroRNA Prediction and 3′-UTR Annotation
Using 1,250 teleost precursor and 1,044 mature miRNAs as query sequences, and the Midas draft genome as a reference, a total of 236 candidate miRNA genes were discovered. These candidates were further processed and 201 mature miRNAs were identified according to their ability to fold in the proper secondary structure necessary for miRNA biogenesis (the sequences of precursor and mature miRNAs are provided in supplementary files S3 and S4, Supplementary Material online).
A total of 8,232 3′-UTRs were identified in the Midas genome using homology information from nine teleost protein data sets. The length of the Midas 3′-UTRs range from 102 to 11,553 bp—mean value: 263 bp; median value: 170 bp (the sequences of the 3′-UTRs are provided in supplementary file S5, Supplementary Material online). Within these 3′-UTRs, using the bioinformatically predicted Midas miRNAs, 38,768 putative miRNA binding sites were identified, ranging from 0 to 222 targets per 3′-UTR—mean value: 4.7; median value: 3.0 (the distribution of miRNA target sites per 3′-UTR is shown in supplementary fig. S1, Supplementary Material online). The average number of targets per 3′-UTR is comparable to what has been found in mammals and fish (Hiard et al. 2010; Loh et al. 2011). The miRNA binding sites per base pair ranges from 0.000 to 0.151—mean value: 0.018; median value: 0.015.
SNP Density in miRNA Genes
The population genomic data of the six Midas species was used to calculate SNP variation in the inferred Midas miRNA genes. These miRNA genes showed a high degree of inter-species conservation. When the variable sites in each position were considered for all species reads combined, the overall nucleotide divergence was extremely low (only ten variable positions found in all 236 precursor miRNAs—SNP density of 0.047%). When the divergence was calculated in the different regions of the pre-miRNAs, the lowest value of divergence was shown to be in the miRNA region itself, where no mutations were found, followed by the stem (nine mutations) and by the loop regions (one mutation).
SNP Density in 3′-UTRs
The same genomic resources were used to calculate SNP density in the annotated Midas 3′-UTRs. When the reads from the six species were merged into a single sequence data set, 3,711 SNPs that passed the quality filters were called in the 3′-UTRs, of which 699 were in the predicted miRNA binding sites. The distribution of SNP density across different polymorphic 3′-UTRs ranged between 0.025% and 4.519%, with a mean of 0.680% and a median of 0.571%. We found that the 3′-UTRs containing at least one SNP have an average SNP density (computed dividing the total number of SNPs divided by the total 3′-UTR length) of 0.438% (SNP density of 0.376% in miRNA target sites and 0.456% in 3′-UTR nontarget regions). The observed SNP density in miRNA targets (0.376%) was significantly lower (p < 0.05) than the SNP density calculated simulating a neutral distribution (randomized average target SNP density: 0.413%) (fig. 2). In the analyses conducted on each species independently (number of called SNPs per species is reported in supplementary table S1, Supplementary Material online), A. citrinellus from Lake Nicaragua and from Lake Managua showed a SNP density in miRNA target sites of 0.248% and 0.252%, respectively, whereas the SNP density in 3′-UTR nontarget regions was found to be 0.331% and 0.314% (randomized average target SNP density: 0.294% for A. citrinellus Lake Nicaragua; 0.288% for A. citrinellus Lake Managua). In Lake Xiloá, SNP density of miRNA targets and 3′-UTR nontarget regions was 0.269% and 0.358% for A. amarillo and 0.264% and 0.332% for A. sagittae (randomized target SNP density: 0.317% for A. amarillo; 0.302% for A. sagittae). In these four species, the null hypothesis of similarity between miRNA target and nontarget regions was rejected by the randomization approach described above (which randomly “shuffles” SNPs along the 3′-UTR; p < 0.05, see also observed and average simulated target density above). Finally, the Lake Apoyo species pair showed the lowest difference between SNP density in miRNA targets (0.178% for A. astorquii; 0.270% for A. zaliosus) and 3′-UTR nontarget regions (0.231% for A. astorquii; 0.284% for A. zaliosus). The null hypothesis that targets and nontarget regions have the same SNP density was not rejected for these two species (p > 0.05), where the randomized miRNA target SNP density (on an average, 0.198% for A. astorquii, 0.266% for A. zaliosus) was statistically similar to the observed data (fig. 3). SNP density in the whole data set of 8,232 3′-UTRs, including also the subset with no SNP, was 0.171% when all the six species’ reads were combined. The SNP density for the data set including both polymorphic and nonpolymorphic 3′-UTRs computed for each species separately had the following values: Amphilophus citrinellus Lake Nicaragua 0.059%; A. citrinellus Lake Managua 0.052%; A. amarillo 0.082%; A. sagittae 0.061%; A. astorquii 0.014%; A. zaliosus 0.041% (all the SNP density values, observed and simulated, are summarized in supplementary table S2, Supplementary Material online; the percentage difference in SNP density between miRNA target and 3′-UTR nontarget regions in each species is graphically shown in supplementary fig. S2, Supplementary Material online).
Fig. 2.—

SNP density in the Midas 3′-UTR calculated in the miRNA binding sites (green bar) and in the upstream and downstream flanking regions (gray bars). The flanking regions are here defined as the upstream and downstream sequences adjacent to the miRNA targets. The total length of the flanking regions is twice the length of the corresponding miRNA target (≈22 nt) in both 3′ and 5′ direction (each gray bar corresponds then to a ≈22 nt region). In case of overlapping flanking regions (occurrence: <3%), we considered each twice; when a flanking region of one miRNA target also contained another miRNA target (occurrence: <5%), we gave priority to the miRNA target, trimming a portion of the flank (these criteria were applied only for the graphical representation, whereas the SNP calculations and the simulations were performed in all 3′-UTR nontarget regions). The dashed red line represents the observed SNP density in 3′-UTR nontarget regions. The dotted black line represents the randomized average miRNA target SNP density obtained through 1,000 simulations. The whiskers represent the 95% confidence interval of the simulated SNP density in target regions (so that when the SNP density in the target falls outside the confidence interval, it is deemed “significantly different” to the SNP density under the null hypothesis of neutral evolution; see Materials and Methods for details).
Fig. 3.—

SNP density in the 3′-UTR calculated for each of the six species independently. The observed density in the miRNA binding sites (green bar) and in the upstream and downstream flanking regions (gray bars) are shown. The dashed red line represents the observed SNP density in 3′-UTR nontarget regions. The dotted black line represents the randomized average miRNA target SNP density obtained through 1,000 simulations, whereas the whiskers represent the 95% confidence interval of the simulated SNP density in target regions (see legend of fig. 2 and Materials and Methods for further details).
Using a similar simulation approach (shuffling the observed SNPs to random positions with the same trinucleotide among the 3′-UTRs of different species), we statistically tested—in a pairwise fashion—the null hypothesis of no difference between species in miRNA target SNP density relative to nontarget SNP density. In all tests, the null hypothesis was not rejected, except for A. zaliosus, the limnetic species from Lake Apoyo, where in four out of five pairwise comparisons the p value was <0.05 (table 1).
Table 1.
p Values Obtained by Testing the Null Hypothesis That the Ratio Between Observed SNP Density in the Targets and the Randomized Average miRNA Target SNP Density Obtained Through 1,000 Simulations is the Same Across Different Species
| Amphilophuscitrinellus (L. Nicaragua) | A. citrinellus (L. Managua) | A. astorquii | A. zaliosus | A. amarillo | |
|---|---|---|---|---|---|
| A. citrinellus (L. M) | 0.292 | ||||
| A. astorquii | 0.493 | 0.332 | |||
| A. zaliosus | 0.018 | 0.154 | 0.0491 | ||
| A. Amarillo | 0.431 | 0.23 | 0.277 | 0.007 | |
| A. sagittae | 0.333 | 0.456 | 0.359 | 0.041 | 0.256 |
Note.—Among all pairwise comparisons, only A. zaliosus shows significant differences with other species.
Within species, the average of the selection coefficients was always negative suggesting that purifying selection is generally acting on Midas miRNA binding sites. Amphilophus citrinellus from the great lakes Nicaragua (−0.324) and Managua (−0.277), and the species pair from Lake Xiloá (A. amarillo: −0.396; A. sagittae: −0.314) showed the lowest average values of “s”. The highest average values of s, indicating lower levels of purifying selection, were found in the Lake Apoyo species pair (A. astorquii: −0.109; A. zaliosus: −0.198) (table 2). A PCA analysis performed on the s values detected a strong phylogenetic signal where the species cluster by lake of origin (fig. 4). The loading of each 3′-UTR on the PCA axes highlighted a potential signature of divergent selection in the Lake Apoyo species pair, the ones showing the lowest values of s (relaxation of purifying selection). In fact, there was no overlap in the 3′-UTRs with the lowest values of s suggesting that selection on different genes reflects adaptation to different ecological niches.
Table 2.
Selection Acting on miRNA Target Sites Calculated as in Hiard et al. (2010)
| Species | Amphilophuscitrinellus (L. Nicaragua) | A. citrinellus (L. Managua) | A. astorquii | A. zaliosus | A. amarillo | A. sagittae |
|---|---|---|---|---|---|---|
| Selection value (s) | −0.324 | −0.277 | −0.109 | −0.193 | −0.396 | −0.314 |
Note.—Negative values of “s” indicate purifying selection.
Fig. 4.—
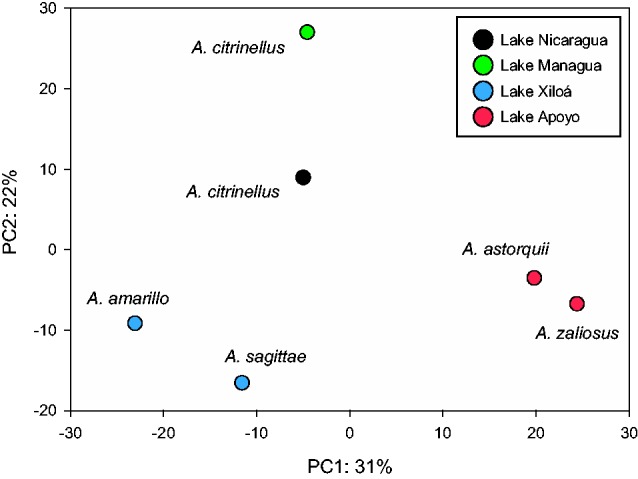
Principal component analysis (PCA) based on the selection values “s” calculated following the formula described in Hiard et al. (2010). The input raw data matrix includes all “s” values for each 3′-UTR for each species.
SNP Density in Coding Regions
Following the pipeline described in the Materials and Methods section, we identified 19,139 genes in the Midas genome, spanning 26,364,466 bp of coding DNA.
As for miRNA genes and 3′-UTRs, population genomics data of the six Midas species were used to calculate SNP density in these annotated coding regions. When the reads of all species were combined, 22,819 SNPs passing quality filters were called in coding regions, resulting in a SNP density of 0.086%. When the analysis was run on each of the six species independently, SNP density was found to be: 0.036% in A. citrinellus Lake Nicaragua; 0.026% in A. citrinellus Lake Managua; 0.045% in A. amarillo; 0.037% in A. sagittae; 0.008% in A. astorquii; 0.028% in A. zaliosus) (number of called SNPs and SNP density per species are reported in supplementary tables S1 and S2, Supplementary Material online).
Analysis of Genomic Divergence
For the two crater lakes, the average genome-wide differentiation was relatively low for the comparisons between the two species from Lake Xiloá, A. Amarillo vs. A. sagittae (FST = 0.1254), and for the two species from Lake Apoyo, A. astorquii vs. A. zaliosus (FST = 0.1179). Genetic divergence was slightly lower in the coding regions in both crater lake species pairs (Lake Xiloá: FST = 0.1273; Lake Apoyo: FST = 0.1083). On the one end, similar levels of divergence for miRNA targets and the rest of 3′-UTRs were observed in Lake Xiloá (miRNA target sites: FST = 0.1309; 3′-UTR nontarget regions: FST = 0.1309). On the other hand, different divergence patterns in these regions emerged in the Lake Apoyo species pair, with higher FST in miRNA targets (miRNA binding sites: FST = 0.1461; 3′-UTR nontarget: FST = 0.1217) (FST values for each genomic region in each species pair comparison are showed as boxplots in supplementary fig. S3, Supplementary Material online).
Discussion
Gene regulatory networks could play an important role in the rapid establishment of reproductive isolation between incipient species (Tautz 2000; Wittkopp et al. 2008). Gene expression changes could likely facilitate population divergence and thus promote adaptation to different ecological niches and ultimately speciation (Abzhanov et al. 2004; Martinez-Fernandez et al. 2010; Pavey et al. 2010). Despite the fact that the machinery of miRNAs have been acknowledged as powerful regulators of gene expression and potential drivers of phenotypic diversification (Giraldez et al. 2005; Berezikov 2011; Li et al. 2012; Powder et al. 2012), studies addressing these topics are still scarce in general and lacking in cichlid fish (but see Loh et al. 2011; Brawand et al. 2014).
Using population genomic data from six Midas species, the recently assembled (de novo) Midas genome, genomic resources available in public databases (e.g., teleost precursor and mature miRNAs from miRBase, and teleost 3′-UTRs from NCBI database), and bioinformatic analyses, we were able to predict 236 miRNA genes and 201 mature miRNAs that are potentially active in this cichlid group. These results are in line with other studies that have reported comparable numbers of miRNAs (Chen et al. 2005; Li et al. 2010; Brawand et al. 2014).
In general, we show that purifying selection is acting on the miRNA target sites of these Nicaraguan cichlids. However, we find weaker levels of purifying selection in the species pair living in Lake Apoyo, the oldest of the crater lakes where sympatric speciation has been reported (Barluenga et al. 2006). The latter might suggest that relaxed levels of purifying selection in the miRNA target sites has allowed regulatory networks to evolve faster and thus contribute to the sympatric differentiation of Midas cichlids. It is important to note that we used a very conservative pipeline, based on the different level of conservation between putative functional (miRNA targets) and neutrally (nontarget) evolving regions, to detect selection acting on miRNA targets. In fact, assuming that the nontarget 3′-UTR sequence space evolves neutrally, this could have led to our underestimation of the functional constraint of some of these regions that act as binding sites of other regulatory noncoding cis-elements (Chan et al. 2005).
We recovered a high level of sequence similarity in the Midas miRNA genes among the six focal species analyzed here. This is not surprising as miRNAs have been found to be extremely conserved even among distantly related taxa (He and Hannon 2004; Ha and Kim 2014). Further, because we relied on homology searches using miRNAs from other teleost fishes to infer the Midas miRNAs, our analyses could have underestimated the real number of Midas miRNAs and also somewhat inflated our inferences of high functional constraints and sequence conservation. Yet, it has recently been shown that this in silico procedure allows capturing most of a species’ miRNAome (Gomes et al. 2013). Another reason why miRNA genes showed levels of conservation higher than what we observed in protein-coding sequences is that they are known to evolve under strong functional constraints that are related to miRNA biogenesis and function. For correct processing, pri-miRNAs need to form exact hairpin structures. Mutations in this structure could lead to preferential incorporation of either the −5p or the −3p miRNA in the silencing complex (i.e., either strand of the hairpin) which could have totally different functions (Winter et al. 2009). These constraints due to miRNA biogenesis and the fact that genes can be regulated by many miRNAs (the mutation in one target does not necessarily alter gene function, this resulting in a reduced level of constraint in miRNA targets) could explain why miRNA genes are more conserved than their targets.
We also uncovered interesting patterns of sequence diversification in Midas miRNA binding sites. We found that purifying selection is acting on miRNA binding sites that generally showed a significantly lower SNP density than was detected in the 3′-UTR nontarget regions. Given the high level of conservation of miRNAs at different taxonomic levels (He and Hannon 2004; Griffiths-Jones et al. 2006; Ha and Kim 2014), and the fact that this pattern has also been found in other intensively studied model species (e.g., human and mouse: Hiard et al. 2010), such a result may be expected. However, using a bioinformatic pipeline similar to the one used in this study, Loh et al. (2011) reported a different result in African cichlids. In fact, Loh et al. (2011) found a significantly higher level of SNP density in miRNAs binding sites, suggesting that positive selection could actually act on these regions making it one of the mechanisms promoting the spectacular phenotypic diversity of Lake Malawi cichlids. The discrepancy between our results and those obtained in the African cichlid study could be attributed to two main nonmutually exclusive factors. First, in the Malawi cichlid adaptive radiations miRNA regulation might have had a prominent role in species diversification, whereas in the Nicaraguan Midas cichlid radiations the role of miRNA regulation has perhaps been less important. This hypothesis could be tested through comparisons of the Malawian radiation to other African adaptive radiations that share a more similar demographic history than our Neotropical Midas system does. A second more parsimonious explanation is also possible. The radiation of Midas cichlids is very young. Lake Apoyo, the oldest of the crater lakes, was colonized ∼22,000 years ago, and Lake Xiloà only 6,000 (Elmer, Kusche, et al. 2010). In contrast, the five Malawian species targeted by Loh and colleagues have had a comparatively longer time to diverge, ∼1–2 Ma (Meyer et al. 1990; Friedman et al. 2013; Loh et al. 2013), and might have had enough time to evolve other regulatory mechanisms that facilitated their adaptation. This hypothesis is corroborated by the different patterns that emerged from our Lake Apoyo species pair when the analysis of each species was conducted independently.
We found that purifying selection is acting on miRNA binding sites in A. citrinellus from the great lakes Nicaragua and Managua and in the species pair from Lake Xiloà (A. amarillo and A. sagittae), whereas SNP density at miRNA target sites do not differ from that of the 3′-UTR nontarget regions (matching neutral expectations) in A. astorquii and A. zaliosus from crater Lake Apoyo. Although gene flow is likely still occurring between the crater lake species (unpublished data), selective pressures have had more time to act and were strong enough to break down the conserved miRNA regulation mechanisms relaxing the purifying selection observed in the other Midas species. This is further supported by the finding that there is no difference between species in target SNP density relative to nontarget SNP density. Specifically, out of all pairwise comparisons involving the six Midas morphs, we were able to reject the null hypothesis only for comparisons involving A. zaliosus. This is a limnetic species that presumably underwent deeper genetic reorganization in comparison to A. astorquii, the Apoyo benthic form (the common ancestor of A. zaliosus and A. astorquii was likely a benthic species resembling the extant A. citrinellus from Lake Nicaragua). Moreover, the species pair from Lake Apoyo showed lower levels of purifying selection—see Material and Methods—measured as in (Hiard et al. 2010), acting on miRNA binding sites.
Finally, another indication of the potential contribution of miRNA regulation to the differentiation between the limnetic and benthic species from Lake Apoyo comes from the analysis of relative sequence divergence. Here miRNA targets showed higher genetic divergence, as measured by FST, compared to other genomic regions (nontarget portions of the 3′-UTR and protein-coding regions) in the Lake Apoyo species pair, whereas similar values were observed in the Lake Xiloà species pair. In other words, it is entirely possible that purifying selection typically acts on the target sites, as has been observed in many organisms, including in the populations of the great lakes in this study. Then, during rapid divergence, positive selection acts on the target sites, but in the first phases (divergence between benthic and limnetic species in the younger lake Xiloà) it cannot be distinguished from purifying selection. As positive selection on the target sites is acting over a more extended period of time (older divergence in Lake Apoyo), this is recognizable as an absence of purifying selection (matching neutral expectations of no difference in SNP density between target and 3′-UTR nontarget regions). When positive selection acts for an even longer time, as could be the cases in cichlids from Lake Malawi, this might result in the target SNP density being higher than the SNP density in the 3′-UTR nontarget regions.
This study opens new doors for future integrated studies on determining how selection is acting on natural populations of divergent cichlid morphs. By identifying the potential role of selection on miRNA binding sites in the diversification of species, we provide the foundation for studies exploring miRNA regulation processes at different levels. This study provides a genome-scale overview of the sequence evolution rate and selection acting on miRNA binding sites, but experimental validation is required before specific genes can be implicated as critical to phenotypic divergence. Indeed, it has been recently demonstrated that false positive rates in computational miRNA target predictions is high (Fan and Kurgan 2015). As we focussed here on miRNA binding sites and relied on miRNA molecules described in other teleost fish, the obvious next step is to sequence and characterize the complete miRNAome in the Midas system using next-generation sequencing. This would allow us to confirm the patterns we obtained here with miRNAs predicted in silico using miRNAs for which we have proof of activity/presence in the cells. The sequencing of Midas miRNAs will also allow us to identify novel Midas-specific miRNAs and to compare their expression levels to the ones of conserved miRNAs in other organisms. Further examination of miRNA molecular evolution will allow us to gain new insights on the role of these regulatory elements during species diversification.
Supplementary Material
Supplementary files S1–S5, tables S1 and S2 and figs. S1–S3 are available at Genome Biology and Evolution online (http://www.gbe.oxfordjournals.org/).
Acknowledgments
This work was supported by the Deutsche Forschungsgemeinschaft (DFG15957314) to P.F., a China Scholarship Council fellowship (201306380094) to P.X., a Marie Curie Intra-European Fellowships (“PlasticitySpeciation” 15986812) to C.F. and by a European Research Council grant (ERC advanced grant “GenAdap” 293700) to A.M. The University of Konstanz is thanked for its support of the Meyer laboratory and the GeCKo (University of Konstanz Genomic Center). The comments of the associate editor and three anonymous reviewers were helpful in revising the original manuscript and their input is very much appreciated and explicitly acknowledged.
Literature Cited
- Abzhanov A, Protas M, Grant BR, Grant PR, Tabin CJ. 2004. Bmp4 and morphological variation of beaks in Darwin’s finches. Science 305:1462–1465. [DOI] [PubMed] [Google Scholar]
- Altschul SF, Gish W, Miller W, Myers EW, Lipman DJ. 1990. Basic local alignment search tool. J Mol Biol. 215:403–410. [DOI] [PubMed] [Google Scholar]
- Arif S, et al. 2013. Evolution of mir-92a underlies natural morphological variation in Drosophila melanogaster. Curr Biol. 23:523–528. [DOI] [PMC free article] [PubMed] [Google Scholar]
- Barluenga M, Meyer A. 2004. The Midas cichlid species complex: incipient sympatric speciation in Nicaraguan cichlid fishes? Mol Ecol. 13:2061–2076. [DOI] [PubMed] [Google Scholar]
- Barluenga M, Meyer A. 2010. Phylogeography, colonization and population history of the Midas cichlid species complex (Amphilophus spp.) in the Nicaraguan crater lakes. BMC Evol Biol. 10:326.. [DOI] [PMC free article] [PubMed] [Google Scholar]
- Barluenga M, Stolting KN, Salzburger W, Muschick M, Meyer A. 2006. Sympatric speciation in Nicaraguan crater lake cichlid fish. Nature 439:719–723. [DOI] [PubMed] [Google Scholar]
- Bartel DP. 2004. MicroRNAs: genomics, biogenesis, mechanism, and function. Cell 116:281–297. [DOI] [PubMed] [Google Scholar]
- Berezikov E. 2011. Evolution of microRNA diversity and regulation in animals. Nat Rev Genet. 12:846–860. [DOI] [PubMed] [Google Scholar]
- Bolger AM, Lohse M, Usadel B. 2014. Trimmomatic: a flexible trimmer for Illumina sequence data. Bioinformatics 30: 2114–2120. [DOI] [PMC free article] [PubMed] [Google Scholar]
- Brawand D, et al. 2014. The genomic substrate for adaptive radiation in African cichlid fish. Nature 513:375–381. [DOI] [PMC free article] [PubMed] [Google Scholar]
- Britten RJ, Davidson EH. 1969. Gene regulation for higher cells – a theory. Science 165:349. [DOI] [PubMed] [Google Scholar]
- Carroll SB. 2008. Evo-devo and an expanding evolutionary synthesis: a genetic theory of morphological evolution. Cell 134:25–36. [DOI] [PubMed] [Google Scholar]
- Chan CS, Elemento O, Tavazoie S. 2005. Revealing posttranscriptional regulatory elements through network-level conservation. PLoS Comput Biol. 1:564–578. [DOI] [PMC free article] [PubMed] [Google Scholar]
- Chan YF, et al. 2010. Adaptive evolution of pelvic reduction in sticklebacks by recurrent deletion of a Pitx1 enhancer. Science 327:302–305. [DOI] [PMC free article] [PubMed] [Google Scholar]
- Chen K, Rajewsky N. 2006. Natural selection on human microRNA binding sites inferred from SNP data. Nat Genet. 38:1452–1456. [DOI] [PubMed] [Google Scholar]
- Chen PY, et al. 2005. The developmental miRNA profiles of zebrafish as determined by small RNA cloning. Genes Dev. 19:1288–1293. [DOI] [PMC free article] [PubMed] [Google Scholar]
- Cunningham F, et al. 2015. Ensembl 2015. Nucleic Acids Res. 43:D662–D669. [DOI] [PMC free article] [PubMed] [Google Scholar]
- DePristo MA, et al. 2011. A framework for variation discovery and genotyping using next-generation DNA sequencing data. Nat Genet. 43:491.. [DOI] [PMC free article] [PubMed] [Google Scholar]
- Elmer KR, Fan S, et al. 2010. Rapid evolution and selection inferred from the transcriptomes of sympatric crater lake cichlid fishes. Mol Ecol. 19:197–211. [DOI] [PubMed] [Google Scholar]
- Elmer KR, Kusche H, Lehtonen TK, Meyer A. 2010. Local variation and parallel evolution: morphological and genetic diversity across a species complex of neotropical crater lake cichlid fishes. Philos Trans R Soc B Biol Sci. 365:1763–1782. [DOI] [PMC free article] [PubMed] [Google Scholar]
- Elmer KR, et al. 2014. Parallel evolution of Nicaraguan crater lake cichlid fishes via non-parallel routes. Nat Commun. 5:5168. [DOI] [PubMed] [Google Scholar]
- Elmer KR, Meyer A. 2011. Adaptation in the age of ecological genomics: insights from parallelism and convergence. Trends Ecol Evol. 26:298–306. [DOI] [PubMed] [Google Scholar]
- Enright AJ, et al. 2004. MicroRNA targets in Drosophila. Genome Biol. 5:R1. [DOI] [PMC free article] [PubMed] [Google Scholar]
- Fan X, Kurgan L. 2015. Comprehensive overview and assessment of computational prediction of microRNA targets in animals. Brief Bioinformatics 16:780–794. [DOI] [PubMed] [Google Scholar]
- Franchini P, Fruciano C, Frickey T, Jones JC, Meyer A. 2014. The gut microbial community of midas cichlid fish in repeatedly evolved limnetic-benthic species pairs. PLoS One 9:e95027.. [DOI] [PMC free article] [PubMed] [Google Scholar]
- Franchini P, Fruciano C, Spreitzer, et al. 2014. Genomic architecture of ecologically divergent body shape in a pair of sympatric crater lake cichlid fishes. Mol Ecol. 23:1828–1845. [DOI] [PubMed] [Google Scholar]
- Friedman M, et al. 2013. Molecular and fossil evidence place the origin of cichlid fishes long after Gondwanan rifting. Proc R Soc B Biol Sci. 280:20131733. [DOI] [PMC free article] [PubMed] [Google Scholar]
- Friedman RC, Farh KKH, Burge CB, Bartel DP. 2009. Most mammalian mRNAs are conserved targets of microRNAs. Genome Res. 19: 92–105. [DOI] [PMC free article] [PubMed] [Google Scholar]
- Gerstberger S, Hafner M, Tuschl T. 2014. A census of human RNA-binding proteins. Nat Rev Genet. 15:829–845. [DOI] [PMC free article] [PubMed] [Google Scholar]
- Giraldez AJ, et al. 2005. MicroRNAs regulate brain morphogenesis in zebrafish. Science 308:833–838. [DOI] [PubMed] [Google Scholar]
- Gomes CP, et al. 2013. A review of computational tools in microRNA discovery. Front Genet. 4:81.. [DOI] [PMC free article] [PubMed] [Google Scholar]
- Grabherr MG, et al. 2011. Full-length transcriptome assembly from RNA-Seq data without a reference genome. Nature Biotechnol. 29:644–652. [DOI] [PMC free article] [PubMed] [Google Scholar]
- Griffiths-Jones S, Grocock RJ, van Dongen S, Bateman A, Enright AJ. 2006. miRBase: microRNA sequences, targets and gene nomenclature. Nucleic Acids Res. 34:D140–D144. [DOI] [PMC free article] [PubMed] [Google Scholar]
- Gupta A, Gartner JJ, Sethupathy P, Hatzigeorgiou AG, Fraser NW. 2006. Anti-apoptotic function of a microRNA encoded by the HSV-1 latency-associated transcript. Nature 442:82–85. [DOI] [PubMed] [Google Scholar]
- Ha M, Kim VN. 2014. Regulation of microRNA biogenesis. Nat Rev Mol Cell Biol. 15:509–524. [DOI] [PubMed] [Google Scholar]
- Hausser J, Zavolan M. 2014. Identification and consequences of miRNA-target interactions – beyond repression of gene expression. Nat Rev Genet. 15:599–612. [DOI] [PubMed] [Google Scholar]
- He L, Hannon GJ. 2004. MicroRNAs: small RNAs with a big role in gene regulation. Nat Rev Genet. 5:522.. [DOI] [PubMed] [Google Scholar]
- Hiard S, Charlier C, Coppieters W, Georges M, Baurain D. 2010. Patrocles: a database of polymorphic miRNA-mediated gene regulation in vertebrates. Nucleic Acids Res. 38:D640–D651. [DOI] [PMC free article] [PubMed] [Google Scholar]
- Hogan GJ, Brown PO, Herschlag D. 2015. Evolutionary conservation and diversification of Puf RNA binding proteins and their mRNA targets. PLoS Biol. 13:e1002307. [DOI] [PMC free article] [PubMed] [Google Scholar]
- Jovelin R, Cutter AD. 2014. Microevolution of nematode miRNAs reveals diverse modes of selection. Genome Biol Evol. 6:3049–3063. [DOI] [PMC free article] [PubMed] [Google Scholar]
- Kautt AF, Elmer KR, Meyer A. 2012. Genomic signatures of divergent selection and speciation patterns in a natural experiment, the young parallel radiations of Nicaraguan crater lake cichlid fishes. Mol Ecol. 21:4770–4786. [DOI] [PubMed] [Google Scholar]
- Ketley A, et al. 2013. The miR-30 MicroRNA family targets smoothened to regulate hedgehog signalling in zebrafish early muscle development. PLoS One 8:e65170. [DOI] [PMC free article] [PubMed] [Google Scholar]
- King M, Wilson A. 1975. Evolution at two levels in humans and chimpanzees. Science 188:107–116. [DOI] [PubMed] [Google Scholar]
- Kocher TD. 2004. Adaptive evolution and explosive speciation: the cichlid fish model. Nat Rev Genet. 5:288–298. [DOI] [PubMed] [Google Scholar]
- Kofler R, Pandey RV, Schlotterer C. 2011. PoPoolation2: identifying differentiation between populations using sequencing of pooled DNA samples (Pool-Seq). Bioinformatics 27:3435–3436. [DOI] [PMC free article] [PubMed] [Google Scholar]
- Kozomara A, Griffiths-Jones S. 2011. miRBase: integrating microRNA annotation and deep-sequencing data. Nucleic Acids Res. 39:D152–D157. [DOI] [PMC free article] [PubMed] [Google Scholar]
- Lagos-Quintana M, Rauhut R, Lendeckel W, Tuschl T. 2001. Identification of novel genes coding for small expressed RNAs. Science 294: 853–858. [DOI] [PubMed] [Google Scholar]
- Langmead B, Salzberg SL. 2012. Fast gapped-read alignment with Bowtie 2. Nat Methods 9:357–U354. [DOI] [PMC free article] [PubMed] [Google Scholar]
- Li H, et al. 2009. The Sequence Alignment/Map format and SAMtools. Bioinformatics 25:2078– 2079. [DOI] [PMC free article] [PubMed] [Google Scholar]
- Li H. 2011. A statistical framework for SNP calling, mutation discovery, association mapping and population genetical parameter estimation from sequencing data. Bioinformatics 27:2987–2993. [DOI] [PMC free article] [PubMed] [Google Scholar]
- Li J, Zhang Z. 2013. miRNA regulatory variation in human evolution. Trends Genet. 29:116–124. [DOI] [PubMed] [Google Scholar]
- Li JJ, et al. 2012. Evidence for positive selection on a number of MicroRNA regulatory interactions during recent human evolution. PLoS Genet. 8:e1002578. [DOI] [PMC free article] [PubMed] [Google Scholar]
- Li SC, et al. 2010. Discovery and characterization of medaka miRNA genes by next generation sequencing platform. BMC Genomics 11:S8.. [DOI] [PMC free article] [PubMed] [Google Scholar]
- Loh YH, Yi SV, Streelman JT. 2011. Evolution of microRNAs and the diversification of species. Genome Biol Evol. 3:55–65. [DOI] [PMC free article] [PubMed] [Google Scholar]
- Loh YHE, et al. 2013. Origins of shared genetic variation in African cichlids. Mol Biol Evol. 30:906–917. [DOI] [PMC free article] [PubMed] [Google Scholar]
- Lu J, Clark AG. 2012. Impact of microRNA regulation on variation in human gene expression. Genome Res. 22:1243–1254. [DOI] [PMC free article] [PubMed] [Google Scholar]
- Martinez-Fernandez M, Bernatchez L, Rolan-Alvarez E, Quesada H. 2010. Insights into the role of differential gene expression on the ecological adaptation of the snail Littorina saxatilis. BMC Evol Biol. 10:356.. [DOI] [PMC free article] [PubMed] [Google Scholar]
- Meyer A. 1993. Phylogenetic-relationships and evolutionary processes in east-African cichlid fishes. Trends Ecol Evol. 8:279–284. [DOI] [PubMed] [Google Scholar]
- Meyer A, Kocher TD, Basasibwaki P, Wilson AC. 1990. Monophyletic origin of Lake Victoria cichlid fishes suggested by mitochondrial DNA sequences. Nature 347:550–553. [DOI] [PubMed] [Google Scholar]
- Miller CT, et al. 2007. cis-Regulatory changes in Kit ligand expression and parallel evolution of pigmentation in sticklebacks and humans. Cell 131:1179–1189. [DOI] [PMC free article] [PubMed] [Google Scholar]
- Pavey SA, Collin H, Nosil P, Rogers SM. 2010. The role of gene expression in ecological speciation. Year Evol Biol. 1206:110–129. [DOI] [PMC free article] [PubMed] [Google Scholar]
- Pertea M, et al. 2015. StringTie enables improved reconstruction of a transcriptome from RNA-seq reads. Nature Biotechnol 33:290–295. [DOI] [PMC free article] [PubMed] [Google Scholar]
- Peterson KJ, Dietrich MR, McPeek MA. 2009. MicroRNAs and metazoan macroevolution: insights into canalization, complexity, and the Cambrian explosion. Bioessays 31:736–747. [DOI] [PubMed] [Google Scholar]
- Powder KE, et al. 2012. A cross-species analysis of MicroRNAs in the developing avian face. PLoS One 7:e35111. [DOI] [PMC free article] [PubMed] [Google Scholar]
- Pritchard CC, Cheng HH, Tewari M. 2012. MicroRNA profiling: approaches and considerations. Nat Rev Genet. 13:358–369. [DOI] [PMC free article] [PubMed] [Google Scholar]
- Quinlan AR, Hall IM. 2010. BEDTools: a flexible suite of utilities for comparing genomic features. Bioinformatics 26:841–842. [DOI] [PMC free article] [PubMed] [Google Scholar]
- Romero IG, Ruvinsky I, Gilad Y. 2012. Comparative studies of gene expression and the evolution of gene regulation. Nat Rev Genet. 13:505–516. [DOI] [PMC free article] [PubMed] [Google Scholar]
- Seehausen O, et al. 2014. Genomics and the origin of species. Nat Rev Genet. 15:176–192. [DOI] [PubMed] [Google Scholar]
- Sethupathy P, Megraw M, Hatzigeorgiou AG. 2006. A guide through present computational approaches for the identification of mammalian microRNA targets. Nat Methods 3:881–886. [DOI] [PubMed] [Google Scholar]
- Shapiro MD, et al. 2004. Genetic and developmental basis of evolutionary pelvic reduction in threespine sticklebacks. Nature 428:717–723. [DOI] [PubMed] [Google Scholar]
- Tautz D. 2000. Evolution of transcriptional regulation. Curr Opin Genet Dev. 10:575–579. [DOI] [PubMed] [Google Scholar]
- Trapnell C, Pachter L, Salzberg SL. 2009. TopHat: discovering splice junctions with RNA-Seq. Bioinformatics 25:1105–1111. [DOI] [PMC free article] [PubMed] [Google Scholar]
- Trapnell C, et al. 2010. Transcript assembly and quantification by RNA-Seq reveals unannotated transcripts and isoform switching during cell differentiation. Nature Biotechnol 28:511–515. [DOI] [PMC free article] [PubMed] [Google Scholar]
- Verheyen E, Salzburger W, Snoeks J, Meyer A. 2003. Origin of the superflock of cichlid fishes from Lake Victoria, East Africa. Science 300:325–329. [DOI] [PubMed] [Google Scholar]
- Villar D, Flicek P, Odom DT. 2014. Evolution of transcription factor binding in metazoans – mechanisms and functional implications. Nat Rev Genet. 15:221–233. [DOI] [PMC free article] [PubMed] [Google Scholar]
- Wilson AB, Noack-Kunnmann K, Meyer A. 2000. Incipient speciation in sympatric Nicaraguan crater lake cichlid fishes: sexual selection versus ecological diversification. Proc Biol Sci. 267:2133–2141. [DOI] [PMC free article] [PubMed] [Google Scholar]
- Winter J, Jung S, Keller S, Gregory RI, Diederichs S. 2009. Many roads to maturity: microRNA biogenesis pathways and their regulation. Nat Cell Biol. 11:228–234. [DOI] [PubMed] [Google Scholar]
- Wittkopp PJ, Haerum BK, Clark AG. 2008. Regulatory changes underlying expression differences within and between Drosophila species. Nat Genet. 40:346–350. [DOI] [PubMed] [Google Scholar]
- Wittkopp PJ, Williams BL, Selegue JE, Carroll SB. 2003. Drosophila pigmentation evolution: divergent genotypes underlying convergent phenotypes. Proc Natl Acad Sci U S A. 100:1808–1813. [DOI] [PMC free article] [PubMed] [Google Scholar]
- Wu TD, Watanabe CK. 2005. GMAP: a genomic mapping and alignment program for mRNA and EST sequences. Bioinformatics 21:1859–1875. [DOI] [PubMed] [Google Scholar]
- Zuker M. 2003. Mfold web server for nucleic acid folding and hybridization prediction. Nucleic Acids Res. 31:3406–3415. [DOI] [PMC free article] [PubMed] [Google Scholar]
Associated Data
This section collects any data citations, data availability statements, or supplementary materials included in this article.