Abstract
Purpose
To compare the MRI findings of benign and malignant solitary hypovascular hepatic nodules and identify the differentiating features.
Materials and methods
A total of 135 patients with solitary hypovascular hepatic lesions up to 3 cm (mass forming intrahepatic cholangiocarcinoma, n=29; metastases, n=26; inflammatory pseudotumors and solitary necrotic nodule, n=48; and hemangioma, n=32) were assessed. MRI findings were analyzed, and lesions were scored for peripheral and intratumoral appearance and enhancement patterns.
Results
Univariate and multivariate analyses showed that the most common findings for benign lesions were subcapsular, sharp margin, homogeneous, marked high signal on T2WI, mild hyperintensity on T2WI, increasing intensity of peripheral globular enhancement, and persistent central septum-like linear enhancement on delayed phase (P<0.05). An area under the curve of 0.955 was obtained for differentiating malignant from benign nodules using the combined imaging features of ill-defined margins, heterogeneity, decreasing intensity of peripheral rim-like enhancement, and central increasing intensity of patchy enhancement. Interobserver agreement was good, ranging from 0.72 to 1.00.
Conclusion
MRI may be a useful noninvasive method for determining whether hypovascular hepatic nodules are malignant or benign.
Keywords: cholangiocarcinoma, hepatic hemangioma, hypovascular hepatic nodule, liver cancer, MRI
Introduction
The liver is both a principal site of primary malignancies and a major target of metastatic disease from almost any primary malignant neoplasm 1. In addition, the incidence of benign hepatic lesions is high in the adult population 2–4. With remarkable advances in diagnostic imaging of the liver, small hepatic hypovascular lesions are increasingly being detected. These include malignant lesions, such as intrahepatic cholangiocellular carcinoma (ICC) and hepatic metastases (HM), as well as benign lesions, such as atypical hepatic hemangiomas (HG), inflammatory pseudotumors (IPT), and solitary necrotic nodules (SNN) of the liver. It is important to differentiate these lesions because the carcinoma and metastases are considered potentially fatal diseases that require prompt surgical or therapeutic attention, whereas benign lesions do not often require any intervention 5–8. Therefore, the ability to accurately differentiate between benign and malignant hypovascular hepatic lesions is increasingly a clinically important issue.
On the basis of our experience, hepatic hypovascular tumors are not uncommon. These four entities need to be distinguished, especially hemangioma and metastasis. Motosugi et al. 9 reported that bright signals on T2WI could be detected in both hemangiomas and hepatic metastases in 94–98% and 13–25% of cases, respectively.
In earlier studies, characteristics of large lesions (>3 cm) and multiple lesions were reported 4,10–14. However, to the best of our knowledge, the MRI features of small solitary hypovascular hepatic nodules (HHN) (≤3 cm) have not been reported so far. This retrospective study aimed to describe the MRI findings of hypovascular hepatic lesions as well as the diagnostic performance of MRI in differentiating malignant from benign hepatic lesions.
Materials and methods
Patients
This retrospective study was approved by the institutional review board and informed consent was waived. Between January 2005 and January 2014, 145 consecutive patients with 145 solitary hypovascular hepatic lesions (≤3 cm) were admitted to two medical centers. Patients with cirrhosis and cysts without associated enhancement were excluded from the study.
Study inclusion criteria were as follows: (a) patients with precontrast and contrast agent enhancement at multiple phases (e.g. no contrast enhancement, arterial phase, portal venous phase, delayed venous phase), (b) solitary hepatic lesions, (c) maximum diameter of any hepatic nodules up to 3 cm, and (d) hypovascular nodules, defined as nodules with large areas of hypointensity on the arterial and portal venous phases of dynamic enhancement, which was the same as or less than that of adjacent liver.
Imaging criteria used for the diagnosis of atypical hemangioma were as follows: (a) nodules with typical unenhanced features (high T2 signal, low T1 signal, and sharp borders), but atypical enhancement (central or peripheral nodular enhancement with no filling, rim-like enhancement); (b) no change for more than 1 year during the follow-up 15.
The criteria used to determine metastases were as follows: (a) lesions without radiofrequency ablation, chemoembolization or radioembolization, or other similar; (b) lesions first detected or 20% larger than the previous images using the same technique; and (c) follow-up imaging with any other primary malignant tumors (mean follow-up period of 8.65±3.18 months, range 3–12 months).
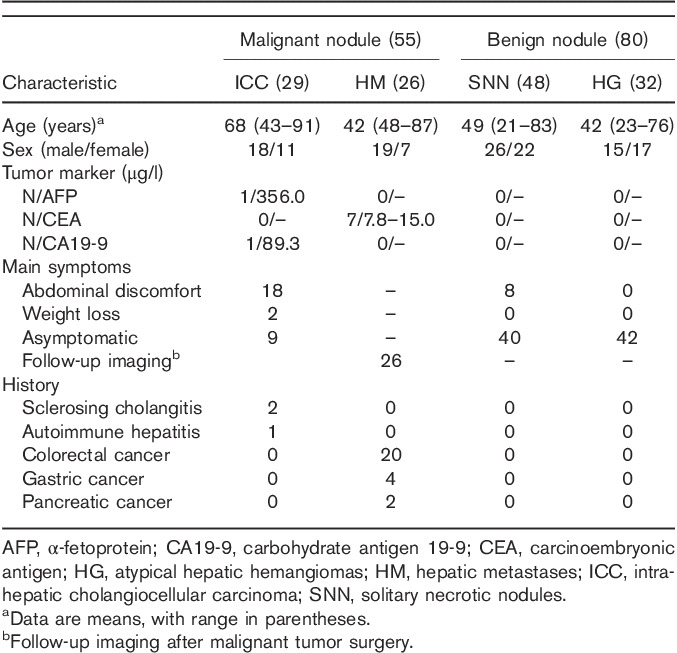
Overall, 135 patients were included in the final study population (57 women and 78 men; age range 21–91 years; mean age 56±13 years). The hepatic lesions included IPT and SNN (n=48), atypical HG (n=32), ICC (n=29), and HM (n=26). Symptoms and laboratory test results are summarized in Table 1. All IPT and SNN (n=48) were confirmed by surgical resection (n=28) or percutaneous biopsy (n=20). Thirty-two atypical HG were confirmed by percutaneous biopsy (n=8) or surgical resection (n=4) and follow-up imaging (n=20). Twenty-nine ICC were confirmed by surgical resection (n=26) and percutaneous biopsy (n=3). All HM were confirmed by surgical resection (n=7) or percutaneous biopsy (n=8) and imaging follow-up (n=11). The longest follow-up duration was 5 years.
Table 1.
Patient characteristics
MRI examination
MRI was performed using a 3 T scanner (Magnetom Trio; Siemens, Erlangen, Germany) with an eight-channel body phased-array coil. Baseline MRI images were acquired with the following parameters: breath-hold T1-weighted gradient-echo images; repetition time (TR), 220 ms; echo time (TE), 5.1 ms; flip angle (FA), 66°; matrix, 320×256; number of signals acquired, one; section thickness, 6 mm; intersectional gap, 1.0 mm; and acquisition time, 28 s. Navigator-triggered, fat-suppressed, and T2-weighted turbo spin echo images were acquired using the following parameters: TR, 4781 ms; TE, 81 ms; FA, 140°; matrix, 256×256; number of signals acquired, one; section thickness, 7 mm; intersectional gap, 1.0 mm; and acquisition time ∼90 s. T2-weighted half-Fourier acquisition single-shot turbo spin echo sequence (TR/TE, 4500/78 ms; FA 150°; matrix, 256×256; 6 mm slice thickness); and a breath-hold T1-weighted fast low angle shot sequence [TR, 172 ms; TE, 2.50 (in-phase)/1.22 ms (out-phase)]; FA 65°; matrix, 208×256; average of 1 and 2 acquisitions; 5 mm slice thickness). Dynamic imaging with a three-dimensional volumetric interpolated breath-hold examination sequence was obtained before (precontrast) and 20 s (arterial phase), 50 s (portal venous phases), and 3–5 min (delayed phases) after an intravenous administration of a gadolinium (Gd)-based contrast medium Gd–diethyltriaminepentaacetic acid (Primovist; Bayer Schering Pharma, Leverkusen, Germany) at a dose of 0.1 mmol/kg and 3.0 ml/s using a contrast enhancement autoinjector, followed by a 20 ml saline flush. Some delayed images were acquired at 10 min. All images were acquired in the transverse plane with a field of view of 370 mm to cover the entire liver. The average interval between MRI and surgery was 10 days (range 1–30 days).
Image interpretation
Two radiologists with 10 years of clinical experience in abdominal MRI, blinded to the pathologic and clinical findings, independently analyzed all images, described the characteristics, and then rated the likelihood of a malignant mass in each patient using a five-point scale as follows: 1, definitely benign; 2, probably benign; 3, indeterminate; 4, probably malignant; and 5, definitely malignant. Combined unenhanced and contrast-enhanced MRI images were randomly assigned to each observer. Each observer interpreted the MRI images independently and separately. All MRI images were evaluated on the picture archiving and communication system monitors.
All analyses were carried out by the location, margin (defined or ill-defined edge), signal intensity on T2WI, nodule homogeneity, capsular retraction, enhancement patterns and features, and vessel encasement. The enhancement patterns included globular or rim-like enhancement at the lesions’ edge, and patchy, septum-like linear or nodular enhancement in the center. The above-mentioned signs are evaluated for determining the nodules benign or malignant. The long diameter of each mass was also measured.
Statistical analysis
Either the χ2-test or the Fisher exact test was used to compare MRI findings. The statistically significant variables of the qualitative imaging features obtained from univariate analysis were used to carry out multivariate logistic regression analysis to determine the most predictable findings. These findings were used to differentiate malignant from benign nodules. Diagnostic performance for differentiating malignant from benign lesions was then assessed using the area under the receiver operating characteristic curve (Az). A difference with a P less than 0.05 was considered statistically significant for all tests. The κ statistic was used to evaluate interobserver agreement. A κ value less than 0.20 was considered to be poor, 0.21–0.4 as fair, 0.41–0.60 as moderate, 0.61–0.80 as good, and 0.81–1.00 as excellent. SPSS, version 17.0 software (IBM SPSS, Inc., Chicago, Illinois, USA) was used for statistical analysis.
Results
The mean diameter of the lesions examined was 1.8±0.7 cm (range 0.5–3.0 cm). The main imaging features are summarized in Tables 2–4. Univariate analysis indicated that there were significant differences between the malignant group and the benign group in terms of location, margin, T2-weighted signal intensity, nodule homogeneity, and type and degree of peripheral and intratumoral enhancement (P<0.05). Multivariate analysis showed that the statistically common findings for malignant hypovascular nodules were ill-defined borders (n=42, 76%, P<0.05); heterogeneity (n=29, 52%, P<0.05); rim-like enhancement at the periphery (n=51, 93%, P<0.05) with decreasing intensity on the delayed phase (n=47, 86%, P<0.05); and patchy enhancement centrally (n=24, 44%, P<0.05) with increasing intensity on delayed phase (n=27, 49%, P<0.05). The most common MRI finding for ICC (n=27) was peripheral enhancement in the arterial dominant phase with centripetal enhancement on delayed phases. Twenty-three ICC showed patchy enhancement on delayed phases and three showed patchy enhancement in the center with peripheral defects (Fig. 2e). Twenty of 26 hepatic metastases were because of colorectal carcinoma. The most common MRI finding for HM (n=23) was peripheral rim enhancement (Fig. 3d–f).
Table 2.
Unenhanced MRI findings for malignant and benign hepatic hypovascular nodules
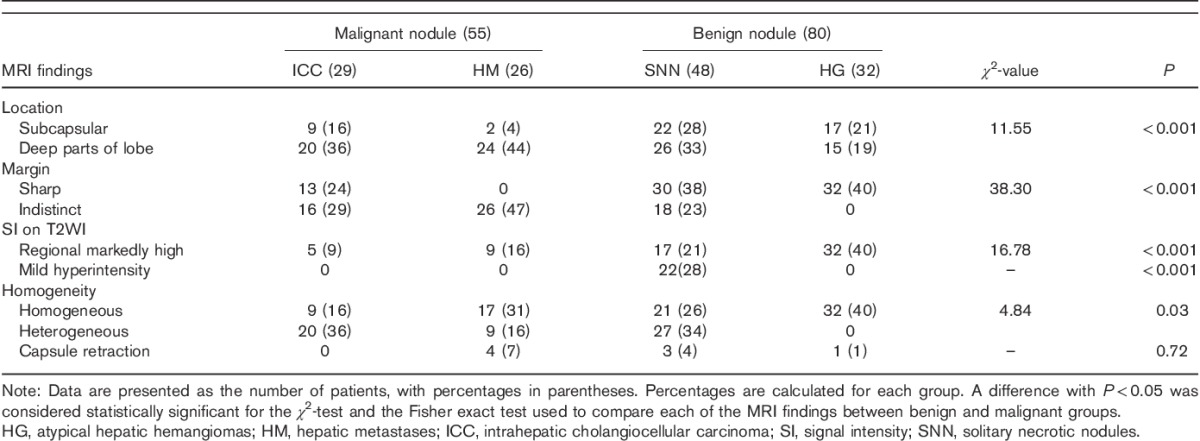
Table 4.
Results of multivariate logistic regression analysis

Fig. 2.
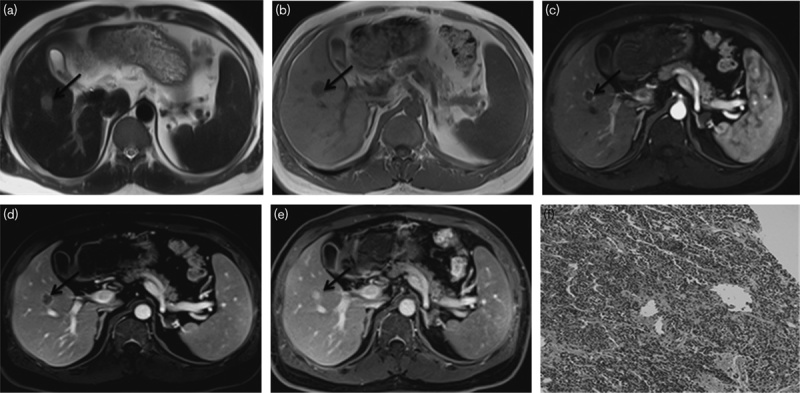
Peripheral nodule cholangiocarcinoma in a 68-year-old man (a–f). (a, b) MRI images of the nodule in segment V. The nodule is about 17 mm in diameter; by transverse T1WI, the nodule is hypointense relative to the liver parenchyma; by transverse T2WI, the nodule is slightly hyperintense relative to the liver parenchyma. (c–e) The arterial, portal phase, and delayed phase show that the nodule has rim enhancement surrounding a hypoenhancing centre. (f) Histological examination was diagnostic of cholangiocarcinoma (hematoxylin–eosin-stained section, original magnification, ×100).
Fig. 3.
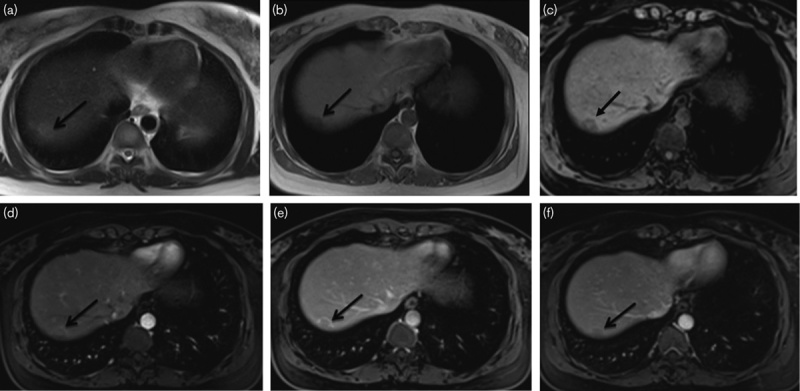
Hepatic metastasis in a 76-year-old man 6 months after the rectal cancer surgery (a–f). (a–c) MRI images of the nodule in segment VII. The nodule is about 18 mm in diameter; by transverse T1WI and T1-VIBE, the nodule is hypointense relative to the liver parenchyma; by transverse T2WI, the nodule is slightly hyperintense relative to the liver parenchyma with indistinct margin. (d–f) The arterial phase shows that the nodule has no significantly enhanced portion. The nodule has a markedly peripheral rim-like enhancement in the portal phase. The degree of the peripheral rim-like enhancement was weakened in the delayed phase.
Table 3.
Dynamic contrast-enhanced MRI findings for malignant and benign hepatic hypovascular nodules
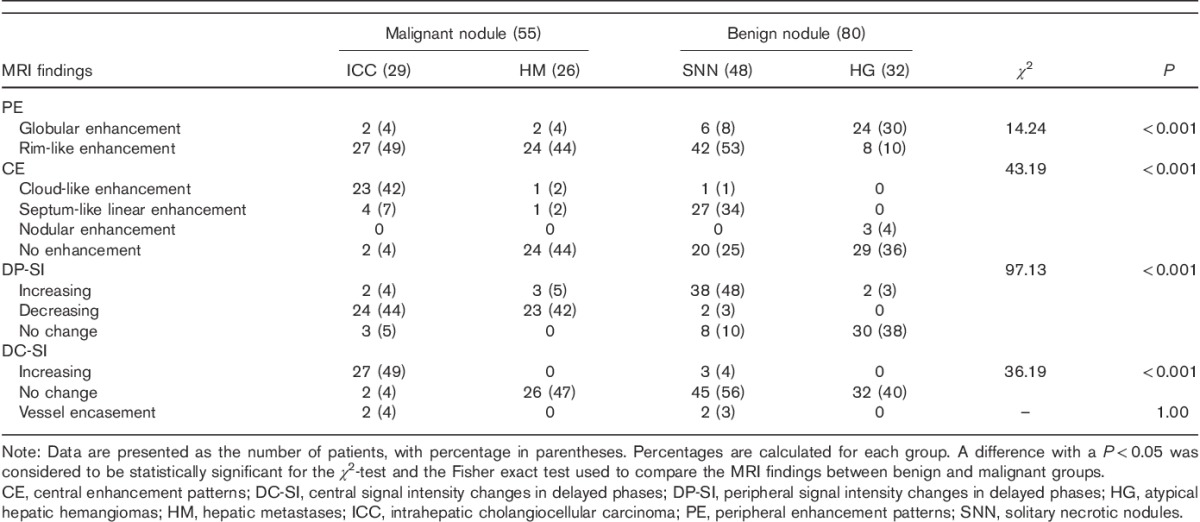
Statistically, the most common findings for benign nodules were subcapsular (n=39, 49%, P<0.05), defined borders (n=62, 78%, P<0.05), marked high-signal intensity on T2WI (n=49, 61%, P<0.05), mild hyperintensity on T2WI (n=22, 28%, P<0.05), HG (n=53, 66%, P<0.05), peripheral nodular enhancement (n=30, 38%, P<0.05) and increasing intensity (n=40, 51%, P<0.05) on delayed phase, and central septum-like linear enhancement (n=27, 34%, P<0.05) and persistence in the delayed phase (n=77, 96%, P<0.05). Large area of atypical HG was a persistent low signal intensity on the three routine phases, but the enhancing area was slightly enlarged like an enhancing dot even at 10 min of delay (n=24; Fig. 4d–f). Twenty-seven cases of IPT and SNN showed thin and rim-like enhancement at the periphery (Fig. 5c–e).
Fig. 4.
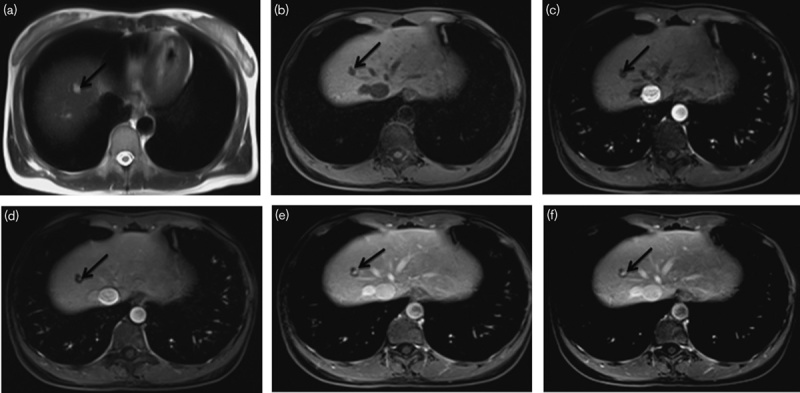
Small hepatic hemangioma in a 40-year-old woman (a–f). (a, b) MRI images of the nodule in segment VIII. The nodule is about 9 mm in diameter; by transverse T1WI, the nodule is hypointense and markedly hyperintense by transverse T2WI with distinct margin. (c–f) The arterial phase shows that the nodule has no significantly enhanced portion. The portal phase shows an enhancing dot in the nodule. The enhancement area is slightly enlarged 10 min after the injection of contrast material; however, a large area of persistent hypointensity remains. After 18 months, with the same acquisition time, the nodule has the same appearance as shown in (e).
Fig. 5.
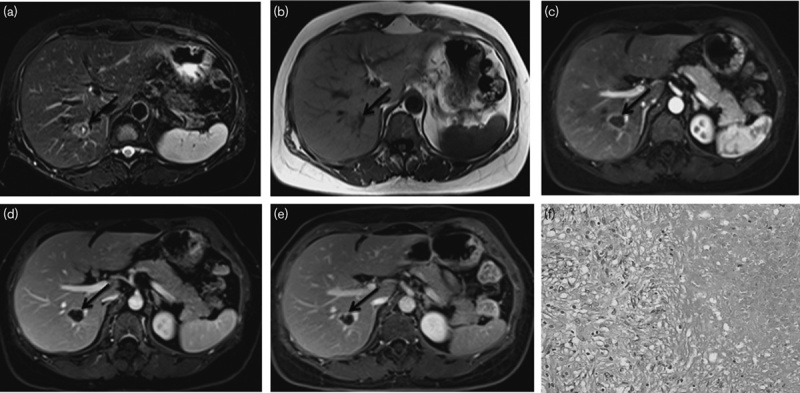
A solitary necrotic nodule in a 23-year-old man (a–f). (a, b) MRI images of the nodule in segment VIII. The nodule is about 23 mm in diameter and on T2WI, There was a central fluid-like space with a thin hypointense band, surrounding which there was moderate T2 hyperintensity relative to the normal liver parenchyma. On T1WI, the SNN is hypointensity relative to liver parenchyma. (c–e) In the arterial and portal phase, the nodule shows peripheral rim-like enhancement. The delayed-phase images clearly show the strengthened septa and peripheral capsule relative to the portal phase. (f) Histological examination was diagnostic of SNN with coagulation necrosis surrounded by a fine fibrous capsule with infiltrating lymphocytes, plasma cells, and eosinophilic granulocytes (hematoxylin–eosin-stained section, original magnification, ×100). SNN, solitary necrotic nodules.
As Fig. 1 shows, the Az values for MRI diagnostic performance in differentiating malignant from benign nodules was 0.955, sensitivity was 96.4%, and specificity was 83.8%, which were determined using combined imaging features of poor-definition, heterogeneity, decreasing intensity of rim-like enhancement at the periphery, and increasing intensity of cloud-like enhancement centrally. The κ values for the two reviewers ranged from 0.72 to 1.00. The interobserver agreement was good.
Fig. 1.
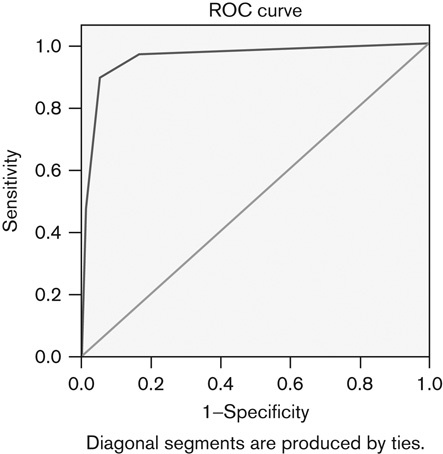
Receiver operating characteristics curves for the diagnostic performance of MRI differentiating malignant from benign nodules by means of statistically common MRI findings. The area under the curve (Az) for differentiating malignant nodules was 0.955, sensitivity was 96.4%, and specificity was 83.8%.
Discussion
HHN can be classified into benign and malignant in etiologies, including ICC, HM, HG, IPT, SNN, etc. 1–4,9,10,16–20. Malignant nodules usually appear with advanced age, immune liver disease, history of malignancy, etc. However, these clinical features may be insufficient indicators for differentiation. Therefore, MRI examination, because of its superior soft-tissue contrast, may play an important role in the diagnosis and differential diagnosis of solitary HHN.
Currently, ICC accounts for ∼15–20% of all primary liver cancers and is the second most common primary hepatic tumor worldwide 17,18. Histologically, ICC are adenocarcinomas emerging from the epithelial lining of the small intrahepatic bile ducts 19,20. When visualized by MRI, because of the similarity of ICC to some benign lesions, it may lead to delayed cholangiocarcinoma diagnosis. The most common enhancement feature of ICC was a peripheral rim enhancement pattern during the arterial phase, followed by progressive and concentric filling with contrast material and patchy enhancement on delayed phases. This pattern was observed in 23 cases, corresponding well with the results of Kim et al. 21.
The cancers from the gastrointestinal tract often metastasize to the liver by the portal vein. HM develop during the course of the disease in up to 50% of colorectal cancer patients 3,22. For surveillance of liver metastases, MRI plays a major role because of its superior diagnostic sensitivity and specificity when evaluating liver lesions 23,24. Yoon and Tanabe 25 and Choi et al. 26 reported that metastasis to the liver is the sole site of metastatic disease in 25–40% of colorectal cancer patients. In our study, 24 HM nodules showed peripheral enhancement such as HHN, which is in agreement with the report of Zech et al. 27.
Yun et al. 16 reported that 88% of HG smaller than 2 cm showed peripheral nodular enhancement with persistent hypodensity (even at 10 min) using two-phase spiral CT. Tiny enhancing dots in two-phase spiral CT corresponded well to the initial enhancing globules in dynamic MRI. Although the nodules were up to 3 cm, 75% of the nodules in this study showed the same enhancement pattern as described previously 16. In addition, central nodular enhancement, progressive range, and intensity of enhancement on delayed phase were observed in three HG, probably because of replacement of parts of the central sinusoids by fibrous tissue.
IPT and SNN can also present as HHN. Twenty-seven IPT and SNN in our study appeared to be heterogeneous, with mixed or patchy high signals on T2WI, which resulted from liquefaction or fibrosis in the nodule 11. In our study, mild hyperintensity appeared only in IPT and SNN. Diverse enhancement patterns for IPT and SNN following the administration of Gd–diethyltriaminepentaacetic acid have been reported. Most reported IPT and SNN have been hypovascular, with limited or no appreciable enhancement at the arterial phase. Peripheral enhancement with a central nonenhancing core is a commonly reported morphological enhancement pattern 28,29. Other morphological enhancement features may include nodular enhancement of the central core, thick irregular septations, and ‘stalactite’ marginal enhancement 30. In this study, peripheral rim-like enhancement with central septum-like enhancement was observed in 27 cases, which was the most common enhancement pattern. In 20 cases, no enhancement of the central core was observed.
In our study, subcapsular nodules were more commonly observed in the benign group with HG, 17 cases, whereas IPT and SNN were observed in 22 cases. These observations are consistent with previous reports 31,32. By contrast, smaller ICCs were located in the more central parts of the liver, whereas HM had no particular location preference.
As typically expected for HG, all 32 HGs showed markedly high signals on T2WI, whereas regional high T2WI signals appeared in nine HMs. Small solitary metastases were often misdiagnosed as HG. Motosugi et al. 9 reported that a bright signal on T2WI (94–98% in HG, and 13–25% in metastasis) and ring-like enhancement (4% in HG and 58–60% in metastasis) were the independent findings suggesting HG and metastasis, respectively.
According to our data, 24 HG showed peripheral nodular enhancement. Yun et al. 16 reported that persistently hypoattenuating small HG visualized by two-phase spiral CT should be considered tumors with large vascular spaces. In this study, 42 IPT and SNN showed peripheral enhancement, 38 cases of which had increasing enhancement in the delayed phase. Venkataraman et al. 33 used microscopy to show that this change in MRI appearance was because of expansion of the portal tracts by fibrosis and occlusive phlebitis of the large-sized and medium-sized veins caused by granulation tissue. These findings were visualized as periportal soft-tissue infiltration.
Kitajima et al. 34 found that HM contained central necrosis, an enhanced area of active tumor cells and a zone of peritumoral edema and congestion. These results explain the fact that HM nodules are often ill defined, with rim-like enhancement and decreased intensity of peripheral enhancement. In our study, a similar enhancement pattern appeared in 23 HM and 24 ICC. Several previous reports have described infiltration of the edges of lesions by tumor cells, resulting in the ICC enhancement pattern 6,8,13.
Zen et al. 31 reported that venous encasement in the nodule was frequently observed in SNN. Kim et al. 35 reported that 53% of ICC also showed venous encasement. We also found that two cases in the ICC group showed portal vein encasement. This encasement was likely because of infiltration of the tumor into hepatic vessels.
However, there are some limitations in our study. First, because it was a retrospective study, some inherent selection bias was present. Second, a precise correlation between imaging findings and histological composition was not made because of the lack of pathologic rereview and lack of surgical specimens from all patients. Third, surgical correlations were not available for all of our study patients. Many cases of benign nodules required no further invasive procedures or surgery. However, in these cases, we had a firm clinical diagnosis and imaging follow-up.
In conclusion, nodular lesions with imaging findings of subcapsularity, sharp margins, homogeneity, marked high signal intensity on T2WI, mild hyperintensity on T2WI, increasing intensity of peripheral globular enhancement, and persistence of central septum-like linear enhancement on delayed phase should be considered benign. The most common findings for malignant nodules were ill-defined margins, heterogeneity, decreasing intensity of peripheral rim-like enhancement, and centrally increasing intensity of patchy enhancement.
Acknowledgements
Authors contributions: Shihong Li contributed equally to this work as the co-first author with Haizhen Qian. Haizhen Qian, data collection and processing, manuscript writing; Shihong Li, data collection and statistical analysis, manuscript writing; Ming Ji, data collection; Guangwu Lin, supervisor, project development, manuscript revision and submission.
Conflicts of interest
There are no conflicts of interest.
Footnotes
Shihong Li and Haizhen Qian contributed equally to the work of this article.
References
- 1.Rummeny E, Weissleder R, Stark DD, Saini S, Compton CC, Bennett W, et al. Primary liver tumors: diagnosis by MR imaging. Am J Roentgenol 1989; 152:63–72. [DOI] [PubMed] [Google Scholar]
- 2.Baron RL. Detection of liver neoplasms: techniques and outcomes. Abdom Imaging 1994; 19:320–324. [DOI] [PubMed] [Google Scholar]
- 3.Baker ME, Pelley R. Hepatic metastases: basic principles and implications for radiologists. Radiology 1995; 197:329–337. [DOI] [PubMed] [Google Scholar]
- 4.Tajima T, Akahane M, Takao H, Akai H, Kiryu S, Imamura H, et al. Detection of liver metastasis: is diffusion-weighted imaging needed in Gd–EOB–DTPA-enhanced MR imaging for evaluation of colorectal liver metastases? Jpn J Radiol 2012; 30:648–658. [DOI] [PubMed] [Google Scholar]
- 5.Liu LX, Zhang WH, Jiang HC. Current treatment for liver metastases from colorectal cancer. World J Gastroenterol 2003; 9:193–200. [DOI] [PMC free article] [PubMed] [Google Scholar]
- 6.Lieser MJ, Barry MK, Rowland C, Ilstrup DM, Nagorney DM. Surgical management of intrahepatic cholangiocarcinoma: a 31-year experience. J Hepatobiliary Pancreat Surg 1998; 5:41–47. [DOI] [PubMed] [Google Scholar]
- 7.Roayaie S, Guarrera JV, Ye MQ, Thung SN, Emre S, Fishbein TM, et al. Aggressive surgical treatment of intrahepatic cholangiocarcinoma: predictors of outcomes. J Am Coll Surg 1998; 187:365–372. [DOI] [PubMed] [Google Scholar]
- 8.Valverde A, Bonhomme N, Farges O, Sauvanet A, Flejou JF, Belghiti J. Resection of intrahepatic cholangiocarcinoma: a Western experience. J Hepatobiliary Pancreat Surg 1999; 6:122–127. [DOI] [PubMed] [Google Scholar]
- 9.Motosugi U, Ichikawa T, Onohara K, Sou H, Sano K, Muhi A, Araki T. Distinguishing hepatic metastasis from hemangioma using gadoxetic acid-enhanced magnetic resonance imaging. Invest Radiol 2011; 46:359–365. [DOI] [PubMed] [Google Scholar]
- 10.Ijuin H, Ono N, Koga K, Yoshida T, Ohnishi H, Miyazaki S, et al. Inflammatory pseudotumor of the liver – MR imaging findings. Kurume Med J 1997; 44:305–313. [DOI] [PubMed] [Google Scholar]
- 11.Wang LX, Liu K, Lin GW, Zhai RY. Solitary necrotic nodules of the liver: histology and diagnosis with CT and MRI. Hepat Mon 2012; 12:e6212. [DOI] [PMC free article] [PubMed] [Google Scholar]
- 12.Soyer P, Bluemke DA, Sibert A, Laissy JP. MR imaging of intrahepatic cholangiocarcinoma. Abdom Imaging 1995; 20:126–130. [DOI] [PubMed] [Google Scholar]
- 13.Choi BI, Han JK, Shin YM, Baek SY, Han MC. Peripheral cholangiocarcinoma: comparison of MRI with CT. Abdom Imaging 1995; 20:357–360. [DOI] [PubMed] [Google Scholar]
- 14.Koh DM, Brown G, Meer Z, Norman AR, Husband JE. Diagnostic accuracy of rim and segmental MRI enhancement of colorectal hepatic metastasis after administration of mangafodipir trisodium. Am J Roentgenol 2007; 188:W154–W161. [DOI] [PubMed] [Google Scholar]
- 15.Bartolotta TV, Taibbi A, Galia M, Lo Re G, La Grutta L, Grassi R, Midiri M. Centrifugal (inside-out) enhancement of liver hemangiomas: a possible atypical appearance on contrast-enhanced US. Eur J Radiol 2007; 64:447–455. [DOI] [PubMed] [Google Scholar]
- 16.Yun EJ, Choi BI, Han JK, Jang HJ, Kim TK, Kim AY, Lee KY. Hepatic hemangiomas: contrast enhancement patterns on two-phase spiral CT. J Korean Radiol Soc 1998; 38:93–98. [Google Scholar]
- 17.Patel T. Increasing incidence and mortality of primary intrahepatic cholangiocarcinoma in the United States. Hepatology 2001; 33:1353–1357. [DOI] [PubMed] [Google Scholar]
- 18.Shaib Y, El-Serag HB. The epidemiology of cholangiocarcinoma. Semin Liver Dis 2004; 24:115–125. [DOI] [PubMed] [Google Scholar]
- 19.Vilgrain V. Staging cholangiocarcinoma by imaging studies. HPB (Oxford) 2008; 10:106–109. [DOI] [PMC free article] [PubMed] [Google Scholar]
- 20.Huppertz A, Haraida S, Kraus A, Zech CJ, Scheidler J, Breuer J, et al. Enhancement of focal liver lesions at gadoxetic acid-enhanced MR imaging: correlation with histopathologic findings and spiral CT – initial observations. Radiology 2005; 234:468–478. [DOI] [PubMed] [Google Scholar]
- 21.Kim SH, Lee CH, Kim BH, Kim WB, Yeom SK, Kim KA, Park CM. Typical and atypical imaging findings of intrahepatic cholangiocarcinoma using gadolinium ethoxybenzyl diethylenetriamine pentaacetic acid-enhanced magnetic resonance imaging. J Comput Assist Tomogr 2012; 36:704–709. [DOI] [PubMed] [Google Scholar]
- 22.Weiss L, Grundmann E, Torhorst J, Hartveit F, Moberg I, Eder M, et al. Haematogenous metastatic patterns in colonic carcinoma: an analysis of 1541 necropsies. J Pathol 1986; 150:195–203. [DOI] [PubMed] [Google Scholar]
- 23.Niekel MC, Bipat S, Stoker J. Diagnostic imaging of colorectal liver metastases with CT, MR imaging, FDG PET, and/or FDG PET/CT: a meta-analysis of prospective studies including patients who have not previously undergone treatment. Radiology 2010; 257:674–684. [DOI] [PubMed] [Google Scholar]
- 24.Martin DR, Danrad R, Hussain SM. MR imaging of the liver. Radiol Clin North Am 2005; 43:861–886. [DOI] [PubMed] [Google Scholar]
- 25.Yoon SS, Tanabe KK. Surgical treatment and other regional treatments for colorectal cancer liver metastases. Oncologist 1999; 4:197–208. [PubMed] [Google Scholar]
- 26.Choi EA, Lei H, Maron DJ, Mick R, Barsoum J, Yu QC, et al. Combined 5-fluorouracil/systemic interferon-beta gene therapy results in long-term survival in mice with established colorectal liver metastases. Clin Cancer Res 2004; 10:1535–1544. [DOI] [PubMed] [Google Scholar]
- 27.Zech CJ, Herrmann KA, Reiser MF, Schoenberg SO. MR imaging in patients with suspected liver metastases: value of liver-specific contrast agent Gd–EOB–DTPA. Magn Reson Med Sci 2007; 6:43–52. [DOI] [PubMed] [Google Scholar]
- 28.Yan FH, Zhou KR, Jiang YP, Shi WB. Inflammatory pseudotumor of the liver: 13 cases of MRI findings. World J Gastroenterol 2001; 7:422–424. [DOI] [PMC free article] [PubMed] [Google Scholar]
- 29.Abehsera M, Vilgrain V, Belghiti J, Flejou J-F, Nahum H. Inflammatory pseudotumor of the liver: radiologic–pathologic correlation. J Comput Assist Tomogr 1995; 19:80–83. [DOI] [PubMed] [Google Scholar]
- 30.Ganesan K, Viamonte B, Peterson M, Kono Y, Santillan C, Middleton M, Sirlin C. Capsular retraction: an uncommon imaging finding in hepatic inflammatory pseudotumour. Br J Radiol 2009; 82:e256–e260. [DOI] [PMC free article] [PubMed] [Google Scholar]
- 31.Zen Y, Fujii T, Sato Y, Masuda S, Nakanuma Y. Pathological classification of hepatic inflammatory pseudotumor with respect to IgG4-related disease. Mod Pathol 2007; 20:884–894. [DOI] [PubMed] [Google Scholar]
- 32.Kim T, Federle MP, Baron RL, Peterson MS, Kawamori Y. Discrimination of small hepatic hemangiomas from hypervascular malignant tumors smaller than 3 cm with three-phase helical CT. Radiology 2001; 219:699–706. [DOI] [PubMed] [Google Scholar]
- 33.Venkataraman S, Semelka RC, Braga L, Danet IM, Woosley JT. Inflammatory myofibroblastic tumor of the hepatobiliary system: report of MR imaging appearance in four patients. Radiology 2003; 227:758–763. [DOI] [PubMed] [Google Scholar]
- 34.Kitajima K, Kuwata Y, Hayashi M, Imanaka K, Kaji Y, Sugimura K. Ring enhancement on T1-weighted GRE images after ferucarbotran administration for hepatic metastasis: comparison with pathological findings: case report. Radiat Med 2005; 23:75–79. [PubMed] [Google Scholar]
- 35.Kim YK, Han YM, Kim CS. Comparison of diffuse hepatocellular carcinoma and intrahepatic cholangiocarcinoma using sequentially acquired gadolinium-enhanced and resovist-enhanced MRI. Eur J Radiol 2009; 70:94–100. [DOI] [PubMed] [Google Scholar]


