

Abstract
Specially designed optoelectronic and data postprocessing methods are described that permit electromyography (EMG) of muscle activity simultaneous with functional MRI (fMRI). Hardware characterization and validation included simultaneous EMG and event‐related fMRI in 17 healthy participants during either ankle (n = 12), index finger (n = 3), or wrist (n = 2) contractions cued by visual stimuli. Principal component analysis (PCA) and independent component analysis (ICA) were evaluated for their ability to remove residual fMRI gradient‐induced signal contamination in EMG data. Contractions of ankle tibialis anterior and index finger abductor were clearly distinguishable, although observing contractions from the wrist flexors proved more challenging. To demonstrate the potential utility of simultaneous EMG and fMRI, data from the ankle experiments were analyzed using two approaches: 1) assuming contractions coincided precisely with visual cues, and 2) using EMG to time the onset and offset of muscle contraction precisely for each participant. Both methods produced complementary activation maps, although the EMG‐guided approach recovered more active brain voxels and revealed activity better in the basal ganglia and cerebellum. Furthermore, numerical simulations confirmed that precise knowledge of behavioral responses, such as those provided by EMG, are much more important for event‐related experimental designs compared to block designs. This simultaneous EMG and fMRI methodology has important applications where the amplitude or timing of motor output is impaired, such as after stroke. Hum Brain Mapp 2006. © 2006 Wiley‐Liss, Inc.
Keywords: fMRI, electromyography, motor behavior, component analysis, numerical simulation
INTRODUCTION
Functional MRI (fMRI) using blood oxygenation level‐dependent (BOLD) contrast is a noninvasive tool that relies on neurovascular coupling to detect neural activity. Its invention ∼15 years ago has dramatically altered and accelerated neuroscience research. Despite this success, an aspect of fMRI that requires ongoing development is the quantification of behavior that underlies brain activity. In particular, recent clinically focused fMRI studies that investigate mechanisms of stroke recovery [Johansen‐Berg et al., 2002; Staines et al., 2002; Ward et al., 2003] have motivated the need for measurement of motor and other behavior during scanning, beyond what can be derived from the simple “on‐off” timing of task patterns. This motivates the need to perform noninvasive surface electromyography (EMG), the measurement of biopotentials due to muscle contraction, during fMRI studies. The EMG signal provides timing and amplitude information from individual muscles during dynamic or isometric contractions, making it more versatile than kinematic data. In addition, EMG is a useful clinical tool suitable for diagnosis of impaired motor performance by providing precise timing information across different muscle groups [Kautz and Brown, 1998].
Few studies have focused on combining EMG and fMRI [Dimitrova et al., 2003; Liu et al., 2000; Toma et al., 1999; van Duinen et al., 2005]. With one exception [van Duinen et al., 2005], these studies have been qualitative or have employed interleaved acquisitions that separate EMG and fMRI signal collection in time. This strategy has been adopted because time‐varying gradient fields throughout an fMRI experiment induce signals that typically saturate EMG preamplifiers and introduce a predominating source of structured noise in the EMG data [Allen et al., 2000]. One example of an interleaved technique provided 200 ms of dead time for EMG during fMRI conducted with a 2.5‐s repetition time [Liu et al., 2000]. This strategy is useful but suboptimal because it reduces fMRI temporal resolution and significantly reduces the duty cycle available for EMG.
It has recently been demonstrated that EMG measurements can be made continuously during fMRI [van Duinen et al., 2005], a methodological development that borrows from the successes of simultaneous electroencephalography (EEG) and fMRI [Allen et al., 2000]. The EMG signals are often larger in amplitude than EEG (0.1–2 mV compared to 5–200 μV, respectively), but the two signals have different spectral and temporal characteristics. Whereas time‐locked evoked potentials from the brain exhibit frequencies ranging from ∼0–50 Hz, the predominant EMG frequency bandwidth is wider (10–160 Hz). The EMG signal is intrinsically stochastic, attributed to transient ionic potentials that occur among activated motor units, and their firing frequency [Clancy et al., 2002]. The standard deviation of this stochastic signal is a function of the number of active motor units. Consequently, the separation of EMG signals from a contaminating fMRI‐induced signal is analogous to the separation of a random signal of interest from a structured noise component. Compared to the brief (∼1 s) muscle activity bursts, structured noise due to fMRI is expected to be the dominant source of variance in the data, whereas residual electronic noise can be minimized through careful hardware design. Signal separation is consequently amenable both to filtering at the hardware level and established signal detection techniques at the postprocessing level.
At the hardware level, one approach is to develop simultaneous EMG and fMRI by modifying and optimizing customized electronics designed for EEG, such as slew‐rate and bandwidth limited nonmagnetic preamplifiers [Ives et al., 1993]. The slew‐rate is the ability of an EMG amplifier to track changes in voltage that occur on a rapid time scale. Hence, slew‐rate limited amplifiers suppress high‐frequency voltage changes. At the postprocessing level, although adaptive noise canceling, artifact subtraction methods [Allen et al., 1998], and filtering techniques [Hoffmann et al., 2000] have been used to improve EEG data acquired during fMRI, the increasing applications of component analysis techniques suggest that they may be useful for EMG data. Principal component analysis (PCA) is a data‐driven feature extraction and data reduction technique that has been used to reduce fMRI‐induced signal contamination in EEG data [Negishi et al., 2004], but not yet in EMG data. Data are decomposed into orthogonal principal components (PCs), ranked according to the amount they explain the total variance. A further data‐driven processing step is independent component analysis (ICA) [McKeown and Radtke 2001], which attempts to represent data as linearly independent components (ICs) for the purpose of feature extraction, sometimes referred to as blind source separation. Both PCA and ICA rely on redundancy across trials or across sampling sources to separate signals. It is hypothesized that both PCA and ICA can be used separate the stochastic EMG muscle signals from the structured fMRI‐induced signal contamination.
Developing simultaneous EMG and fMRI capability is of critical importance for investigation of impaired motor behavior in patient studies, such as those that aim to improve understanding of deficits due to stroke and stroke recovery [Ward et al., 2003; Zemke et al., 2003]. The addition of a simultaneous EMG measurement to fMRI studies of stroke would provide unambiguous, individualized, task‐relevant information about the specific abnormal muscle activation patterns. One obvious application is in longitudinal stroke studies [Ward et al., 2003] where recovery and brain reorganization are expected to occur. EMG can be used to quantify differences in muscle contraction patterns, both in timing and amplitude, within the same patient as a function of time. Compared to kinematic measurements or visual observation, EMG is the most suitable technique to screen for disturbed motor control, such as mirror movements with the opposite limb during a unilateral task. Another example is co‐contraction, a well‐established clinical phenomenon in hemiparetic stroke patients [Knutsson and Richards, 1979], whereby firing from the antagonist muscle impedes voluntary movement [Lamontagne et al., 2000]. Co‐contraction exists when patients have difficulty engaging a weak agonist muscle while inhibiting the antagonist muscle at the same time [Hammond et al., 1988]. A recent study of chronic stroke survivors involving EMG outside the MRI scanner and subsequent fMRI experiments found that movement disorders are likely to confound interpretation of clinical fMRI [Luft et al., 2005].
Preliminary to such clinical fMRI applications, the current work describes initial implementation and validation of prototypical simultaneous EMG and fMRI. Data were acquired for three different muscles (ankle, wrist, and finger) and different postprocessing strategies were evaluated. An additional representative demonstration of simultaneous EMG and fMRI during ankle dorsiflexion among a cohort of healthy participants was used to illustrate how EMG data can help to inform interpretation of brain activity. These improved fMRI results are supported by numerical simulations that help to characterize the influence of onset and duration of the motor task on fMRI statistics over a range of experimental designs.
MATERIALS AND METHODS
Aspects of the methodology were tested in three parts. 1) Components were assembled to enable EMG recording from within an MRI scanner using optoelectronics. It was identified that the most critical component within this apparatus was the preamplifier. Therefore, experiments using a phantom were performed to test performance characteristics of three different preamplifiers. 2) Simple visually cued, motor event‐related fMRI experiments of the human ankle (n = 12), hand (n = 3), and wrist (n = 3) were performed to assess the quality of EMG during fMRI, and to determine the best EMG postprocessing strategy. Using the ankle EMG and fMRI data, an analysis was performed to determine whether timing information provided by EMG was useful for augmenting fMRI analysis. 3) Simulations were performed to determine the effect of i) task onset and ii) task duration on the statistical significance of an fMRI voxel time series. The simulations were performed to investigate the importance of characterizing the timing of behavioral responses for a variety of task durations, and particularly to provide broader context on the usefulness of EMG‐derived timing information for event‐related fMRI experiments involving motor function.
Experiments
Part 1: Preamplifier characterization
Surface EMG electrodes (active, ground, and reference) were connected to a preamplifier, multiplexer, and electro‐optic conversion unit positioned inside the MRI room. The unit was positioned on foam to minimize the effects of vibration on the internal electronics at high magnetic field. Fiber optic signals passed through a waveguide out of the magnet room, where secondary amplification and low‐pass filtering occurred (high‐frequency cut‐off: 80 Hz). Three slew‐rate and band‐limited preamplifiers (INA126EA, Texas Instruments, Dallas, TX) were designed by an engineer experienced with fMRI‐compatible EEG equipment fabrication (J.R.I.) and subsequently tested within the overall apparatus (preamplifier #1, bandwidth 0.5–80 Hz, gain 1440; preamplifier #2, bandwidth 15–80 Hz, gain 880; and preamplifier #3, bandwidth 33–80 Hz, gain 780). These bandwidth characteristics were altered by changing the capacitance values for a second stage operational amplifier (LT2079CS, Linear Technology, Milpitas, CA; 0.33 μF, 0.01 μF, 0.0047 μF, for preamplifiers 1, 2, and 3, respectively). Outside the magnet room the optical signals were de‐multiplexed and converted back to voltage values and digitized at 1,000 Hz, using custom LabVIEW software (National Instruments, Austin, TX) capable of 333 kilo‐samples/s (16 bit) and absolute accuracy of 0.8 mV for 5 V range. Although the current work focuses on “single‐channel EMG” based on three electrodes, the entire system was configured for 8‐channel recording.
To characterize the preamplifier designs, the EMG electrodes were placed in a phantom (saline bath) and positioned along the midline of the MRI scanner bed. Baseline EMG signal contamination due to the fMRI acquisition was measured at sequential z distances along the scanner bed away from the isocenter position, z = 0 cm. During preliminary testing, changing the lateral placement of electrodes (i.e., in the x direction) had no effect on signal contamination levels. Standard deviations of the signal recordings were calculated based on four repeated measurements at z = 75, 85, 95, 105, 115, and 125 cm from the isocenter, representing the approximate range of locations for measuring EMG from muscles of the hand, finger, or foot. Because all three preamplifiers inherently had different gain and bandwidth ranges, standard deviation values were normalized for gain as measured from a reference 40 Hz sine wave. Scan parameters were the same as those for ankle dorsiflexion fMRI (see below).
Part 2: Simultaneous EMG and fMRI experiments
Ankle dorsiflexion
Using an established event‐related paradigm [MacIntosh et al., 2004], 12 volunteer participants (seven men, five women, age range: 21–35 years, mean: 26 years) performed right ankle dorsiflexion, during which surface EMG was measured with a pair of electrodes located over the tibialis anterior (TA) and the ground electrode located over the tibia bone. The preamplifier was positioned between the legs. Participants received a visual cue that instructed them to perform a unilateral dynamic contraction for 1 s at ∼50% of their maximum voluntary contraction. The experiment was 310 s in duration and consisted of 15 muscle contractions occurring at intervals of 20 s. Three participants were tested twice using two preamplifiers, whereas the remaining participants were tested only once, for a total of 15 fMRI sessions involving the 12 participants. Prior to fMRI scanning the quality of the EMG signal was assessed; participants practiced making brief contractions and performed a maximum voluntary contraction for reference. To ensure data synchronization, EMG acquisition software triggered the scanner.
Index finger abduction
Using the same paradigm and method as above, three participants performed abduction of the right index finger for 1 s while EMG signals were measured from the first dorsal interosseous, labeled here as index abductor (IA).
Wrist maximum flexion
Using the analogous paradigm and method, two participants (two men, ages: 25, 27) performed a maximum (100%) right wrist flexion for 1 s while EMG measured muscle activity from the flexor digitorum (FD). One participant was tested twice using different preamplifier configurations for a total of three fMRI sessions involving these participants. During IA and FD sessions the preamplifier unit was placed on the patient bed on the right side of each participant.
In all cases fMRI experiments involving humans were performed with approval from the research ethics board at Sunnybrook Health Sciences Centre and with the informed consent of the participants.
EMG Postprocessing: Component Analysis Denoising Techniques
A major contribution to contamination in EEG signals arising from fMRI occurs at frequencies that correspond to the imaging repetition time (TR) and its harmonics [Hoffmann et al., 2000]. Bandpass or notch filtering techniques are insufficient to remove these frequency components from the data. Guided by this insight and with the goal of maximizing EMG muscle signals, two alternative component analysis techniques were investigated to separate fMRI‐induced contamination from EMG muscle signals of interest: 1) PCA, and 2) ICA “seeded” by PCA, as is performed customarily.
Component analysis on EMG data was performed after separating the recording into its constituent 15 trials of 20 s duration, time‐locked to the fMRI acquisition. The multiple trials were treated as repeated measures, creating the redundancy requirement essential for feature extraction techniques. Using a PCA‐equivalent singular value decomposition (Matlab, MathWorks, Natick, MA), 15 ranked PCs were generated. From visual inspection of the PCs it was clear that either the first two or three PCs contained the highly structured fMRI‐induced signal contamination that explained a significant portion of the data variance. EMG data were reconstructed after using an automated power spectrum calculation to select those PCs that reflected the signal contamination (see below). A fast ICA algorithm [Hyvarinen and Oja, 2000] was subsequently used to represent the data as 15 linearly independent components, using the PCA result as the starting input.
In either case, PCs or ICs associated with EMG signal content were selected automatically. The mean power and standard deviation were calculated for each component and expressed as a ratio. If this ratio was less than the average across all the components by an amount greater than 1 SD, then the component was removed. The remaining components were then used to reconstruct the EMG data. This technique is suitable for separation of highly periodic components from the muscle EMG signals of interest, because muscle EMG signals are stochastic and have much broader power spectra compared to highly repetitive and structured fMRI‐induced signal contamination, which resembles a comb‐function in frequency space.
Subsequent to component analysis (ICA or PCA), EMG data were rectified and filtered using a second‐order low‐pass Butterworth filter (5 Hz). The effectiveness of PCA and ICA was evaluated by computing the contrast ratio (CR) for each participant, defined as the average EMG signal during the movement period divided by the average value during the rest period. Raw CR values for unprocessed data provided a means to characterize the potential improvements associated with using either component analysis technique. Larger CR values indicated better differentiation between task and baseline periods.
MRI Acquisitions and Analysis
The MRI data were collected using a research‐dedicated 3.0 T whole‐body scanner (3T94 hardware, VH3/M4 software, General Electric Healthcare, Waukesha, WI). For ankle fMRI, coronal anatomical images were collected using a T1‐weighted gradient echo acquisition with the following imaging parameters: TR/TE/FA/bandwidth = 7.1 ms/3.1 ms/15°/31.5 kHz. Coronal T2 *‐weighted functional images were collected using single‐shot spiral‐in, spiral‐out k‐space trajectories (spiral IO). As is described elsewhere [Glover and Thomason, 2004], spiral IO data with signal‐weighted averaging increases the signal‐to‐noise ratio appreciably compared to conventional spiral‐out sequences without sacrificing temporal resolution. The prescribed functional volume consisted of 14 slices, centered about the central sulcus, with a 5 mm slice thickness in the coronal plane with the following imaging parameters: TR/TE/FA = 1000 ms/30 ms/50°, 64 × 64 matrix size after regridding, field‐of‐view (FOV) = 20 cm. Identical scan parameters were used for finger and wrist fMRI experiments, although in these cases axial slices were prescribed.
Reconstructed fMRI data were coregistered and inspected for excessive head motion using freely available software, AFNI [Cox, 1996]. Plots of estimated head motion suggested that no participants moved more than 1 mm during the course of data collection. Images were filtered in time using a 3‐point median filter followed by spatial smoothing using a Gaussian kernel with a full‐width at half‐maximum of 4 mm.
For the ankle dorsiflexion experiment, activation maps were generated using two similar methods. The first method, referred to as Visual cue‐guided analysis, involved creating a hemodynamic reference waveform that was optimized for the maximum detection of neuronal activity (see Fig. 7A for gamma variate function; based on visual cue and one TR interval). The second method, referred to as EMG‐guided analysis, used a similar waveform but incorporated the average filtered EMG waveform to set the sub‐TR time values for the task onset and cessation, with temporal precision on the order of a tenth of a second. Therefore, the brain activity for each participant was modeled using personalized hemodynamic responses as specified by their average EMG burst information. Both waveform models were fitted separately to the fMRI time series data, on a voxel‐by‐voxel basis, with activation expressed as a t‐statistic. An activation threshold was set at t > 4.0 producing an uncorrected P‐value of 10−4. Based on Monte Carlo simulations provided within AFNI, the statistical threshold utilized corresponds to an estimated corrected P‐value of 0.002 with a cluster size of 4 voxels. The number and distribution, expressed as z‐scores, of voxels that reached significance was used to compare the two fMRI analysis methods.
Figure 7.

Part 3–fMRI simulation on effects of model shift and duration. A: A library of reference hemodynamic waveforms was generated by altering two model parameters, the model shift, d, and the Model Duration, Δ, and convolving the task waveform with a hemodynamic response function. Model Shifts varied between 0–3 s while Model Durations were 1, 2, 5, 10, and 20 s. B: Correlation coefficient, r, curves are plotted as a function Model Shift, δ (error bars denote standard deviation). The maximum r is dependent on the optimal onset time, δoptimal, and the curvature of the r curves illustrates the variability in sensitivity for the different Model Durations. Mismatch conditions, whereby the Model Duration is overestimated by 10% of the true duration are shown in gray. C: Evaluating r under the optimal condition (black) and under the mismatch condition (gray), i.e., 10% Δ mismatch and δ = δoptimal + 1 s, shows a reduction in the expected correlation coefficient for brief tasks, but no effect within error for longer, block‐design tasks.
To provide additional support for this methodology, the two reference waveforms were orthogonalized for each ankle dorsiflexion participant by means of singular value decomposition. This yielded first a “parallel” component waveform representing common features between the Visual cue and EMG‐guided model time series, and secondly an “orthogonal” component waveform representing their distinct features. As has been described elsewhere [Buchel et al., 1998], a general linear test was then used to characterize the effects of using the two different models.
Activation maps were transformed to Talairach coordinate space, then blurred to 6 mm and normalized to facilitate a mixed‐effects analysis of variance (ANOVA) group analysis. Group‐wise activation maps were generated using 1) Visual cue‐guided analysis; 2) EMG‐guided analysis; and 3) a contrast map to determine statistical differences between 1) and 2). A similar ANOVA was performed using the maps generated from the orthogonalized waveforms.
Numerical simulation
Using Matlab, simulated fMRI signals (see Fig. 7A) were generated by adding white and low‐frequency noise to a series of waveforms created from two‐parameter gamma‐variate hemodynamic responses (h(t) = t8.6exp(‐t/0.547)) [Cohen, 1997] and task durations of 1, 2, 5, 10, and 20 s. The simulated data were generated to be of similar quality as observed in the fMRI experiments described above. The time series were 310 s in duration with percent signal change of 1.2% on average (range: 0.85–2.23). Reference waveforms were first made by varying the Model Shift, δ (0–3 s) with respect to the fMRI signals generated, and then by varying the Model Duration, Δ, from 1 to 20 s. One thousand iterations were used to produce an average correlation coefficient, r, between the simulated voxel time series and the reference waveforms, with noise levels that ranged between 0.263–0.724%. Tests were performed to evaluate the influence of δ on r, for each Δ, to characterize the sensitivity of the model onset times for each of the task durations. Next, to evaluate the effect of delays in both task onset and offset, Δ was increased by 10% and the correlation curves, r vs. δ, were generated anew.
RESULTS
Part 1: Preamplifier Characterization
The EMG data measured from a saline bath during fMRI acquisition demonstrated that the signal contamination in each preamplifier strongly depended on z‐position. Figure 1 shows standard deviation values (normalized for gain) of the signal contamination as a function of z‐position. At z = 115 cm, an approximate location of the lower limb during TA EMG, all three preamplifiers showed minimal fMRI‐induced signal contamination. A marked difference was observed at locations that approximated wrist positions (75–85 cm away from isocenter): in particular, data from preamplifier 1 show an ∼260% increase in signal contamination compared to preamplifiers 2 and 3. Recording from multiple channels did not influence the EMG data quality (data not shown).
Figure 1.
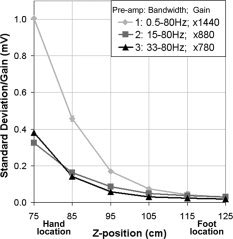
Preamplifier characterization. Gain‐normalized amplitude of fMRI‐induced signal contamination in EMG data as a function of distance from the magnet iso‐center (z = 0 cm) for the three preamplifier configurations. Error bars show the variance associated with four repeated measurements in a saline bath.
Part 2: Simultaneous EMG and fMRI Experiments
For all subsequent simultaneous EMG and fMRI experiments involving humans, the EMG data were processed using the methods previously described and average EMG burst onset and offset times, relative to the visual cue, were generated for each participant (Table I). The average EMG burst from all the participants and muscles began 1.0 ± 0.28 s after the visual cue and ceased 2.6 ± 0.58 s after the visual cue. Figure 2A shows excerpts of raw ankle, index finger, and wrist EMG muscle bursts during fMRI for one participant. The DC‐offset and EMG burst asymmetry reflects bias voltage of the preamplifier in the MRI environment. Structured fMRI‐induced noise is reduced significantly by postprocessing (Fig. 2B). For the ankle and wrist, average EMG data after ICA and rectification clearly illustrate the removal of fMRI‐induced signal contamination and the onset and cessation of the contraction. Data quality for the wrist was poorer in this example.
Table I.
Average electromyography (EMG) burst onset and offset after the visual cue for each participant, session, and muscle measurement
| EMG Burst | On (s) | Off (s) |
|---|---|---|
| TA1 | 0.5 | 2.5 |
| TA2 | 1.0 | 3.0 |
| TA3‐1 | 1.2 | 2.0 |
| TA3‐2 | 1.0 | 3.0 |
| TA4‐1 | 1.0 | 3.0 |
| TA4‐2 | 1.0 | 2.6 |
| TA5‐1 | 0.8 | 1.6 |
| TA5‐2 | 0.8 | 2.2 |
| TA6 | 1.1 | 3.1 |
| TA7 | 1.0 | 2.2 |
| TA8 | 1.4 | 2.8 |
| TA9 | 1.5 | 3.2 |
| TA10 | 1.4 | 3.2 |
| TA11 | 1.0 | 2.4 |
| TA12 | 0.8 | 2.0 |
| IA1 | 0.5 | 2.3 |
| IA2 | 1.0 | 2.1 |
| IA3 | 0.8 | 1.7 |
| FD1 | 1.5 | 4.0 |
| FD2‐1 | 1.0 | 2.6 |
| FD2‐2 | 1.1 | 2.8 |
| Mean | 1.0 | 2.6 |
| Std | 0.28 | 0.58 |
TA, tibialis anterior; IA, index abductor; FD, flexor digitorum. The average task duration was 1.6 ± 0.64 s. Some participants participated in two fMRI sessions.
Figure 2.
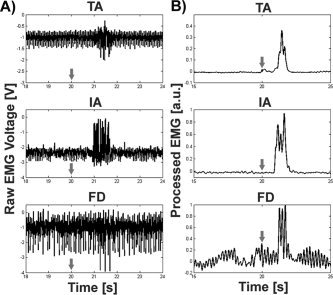
EMG during fMRI. A: Sample EMG time series excerpt from three muscle groups: right tibialis anterior (TA, top), right index abductor (IA, middle), right flexor digitorum (FD, bottom). fMRI‐induced noise is evident in all three traces to varying amounts, and is a function of multiple parameters including distance of the leads from the isocenter, electrode placement, and skin impedance. B: Processed EMG data for the same three muscles after PCA, rectification, and low‐pass filtering clearly delineates muscle burst for TA and IA, whereas results for FD are poorer. Each row represents data from a different participant. The arrows represent the timing for the visual cue.
Considering the ankle EMG data, Figure 3 shows a significant improvement in the CR across participants between raw CR and PCA CR values (P < 0.0002). The next processing step from PCA to ICA produced a small but still significant difference in CR values (P < 0.02). The PCA method removed 88 ± 9.0% of the variance and kept 12 ± 0.38%, whereas ICA removed an additional 2.2 ± 0.60% after PCA and kept 9.8 ± 0.77%. Although fewer participants performed index abduction, both PCA and ICA methods appear to provide an analogous improvement in CR value. In agreement with Figure 2, EMG data for the wrist were not salvageable over three measurements.
Figure 3.
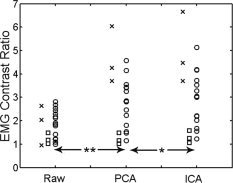
Contrast ratio (CR) for raw and processed EMG signals. Significant incremental improvement in EMG signal contrast was observed when the raw EMG signals were processed with both principal component analysis (PCA) and independent component analysis (ICA). Data points represent individual participants (symbols: circle = TA, square = FD, x = IA; **P < 0.0002, *P < 0.02).
The TA EMG and fMRI data were used to perform a more extensive fMRI analysis examining the utility of the EMG data for improving interpretation of brain activity. In agreement with previous studies [MacIntosh et al., 2004; Sahyoun et al., 2004], areas of activation observed by fMRI included M1/S1, SMA, SII, as well as contralateral thalamus, putamen, and ipsilateral cerebellum. For example, Figure 4 shows an activation map and the corresponding EMG data for a single participant. For comparison with the EMG data, BOLD percent signal change time series data are also shown for the contralateral SMA, SII, M1, and ipsilateral cerebellum. The hemodynamic responses for these regions vary in their peak amplitudes, but are coupled tightly with EMG muscle bursts.
Figure 4.
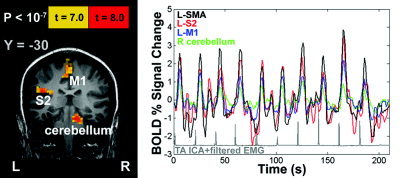
EMG and fMRI results from a representative participant. Left: fMRI results show areas activated as a result of brief ankle dorsiflexion movements. Right: associated BOLD fMRI time series data from four regions of interest. Processed EMG data (ICA + rectification + low‐pass filter) are shown below in gray. SMA: supplementary motor area; SII: secondary somatosensory cortex; M1: primary motor cortex.
T‐statistic activation maps from all the TA ankle fMRI sessions were converted to Z‐score using AFNI. Figure 5 shows the average, significant whole‐brain Z‐score histograms. The two curves illustrate the difference between the Visual cue‐guided and the EMG‐guided methods of fMRI analysis. The 95% confidence intervals for each curve demonstrate the overall benefit of incorporating behavioral information into the fMRI analysis, namely, that the voxel count increases significantly. In more detail, Figure 6 shows the results of a mixed‐effect ANOVA contrast between the two fMRI analysis methods. The EMG‐guided analysis recovered more of the underlying brain activity in several regions: ipsilateral cerebellum, bilateral secondary somatosensory cortex (SII), supplementary motor area (SMA), ipsilateral thalamus (P < 0.0002), and bilateral insula (P < 0.002). Conversely, there were no regions identified with the Visual cue‐guided > EMG‐guided contrast. Group results from the orthogonal waveform activation maps produced significant regions that were comparable to those shown in Figure 6, namely: bilateral SII, right thalamus, and right insula (P < 0.01; data not shown). The implication is that these brain regions are more sensitive to small timing issues that are not captured in the Visual cue‐guided approach.
Figure 5.
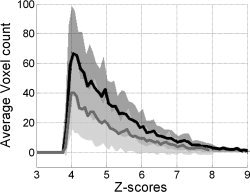
Average Z‐score histograms across participants and sessions during ankle dorsiflexion fMRI (Z > 3.951, P < 0.01; EMG‐guided, solid black; Visual cue‐guided, solid gray). Dark and light gray fills correspond to the 95% confidence intervals for EMG‐guided and Visual cue‐guided analysis, respectively.
Figure 6.
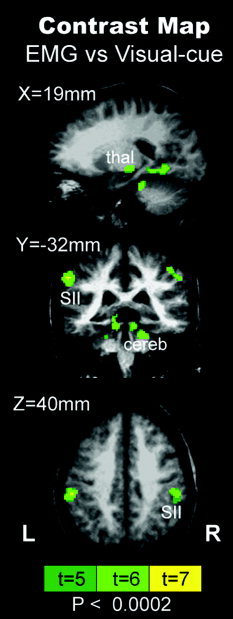
Mixed‐effect ANOVA group contrast map between EMG‐guided and Visual cue‐guided fMRI analysis (P < 0.0002). Regions such as bilateral secondary somatosensory cortices (SII), cerebellum (cereb), and right thalamus (thal) were detected more readily using EMG‐derived information. No significant voxels were found for the reverse contrast.
Numerical Simulation
To place the observed voxel count improvements associated with the EMG‐guided analysis method in better context, the results of numerical simulations are shown in Figure 7. The family of curves in Figure 7B shows the average correlation coefficient, r, calculated between the simulated fMRI time series data and a model of the hemodynamic response (Fig. 7A) for Model Duration Δ ranging from event‐related design to block design. Black curves show how r varies if the Model Shift, δ of the behavioral response is estimated incorrectly. Within error, each of these curves exhibit maxima for δ = 1 s, the true task onset reflected in the simulated fMRI data. Due to the presence of noise, the maximal r value increases as Δ increases. An additional feature of these curves is that the dependence of r on δ is much more “peaked” for short duration tasks, whereas for Δ = 20 s, varying δ has no influence on the correlation coefficient, within error. Next, the gray curves show the combined effect of a mismatch in both δ and Δ, for a 10% discrepancy between the duration of the modeled behavioral response and that reflected in the simulated fMRI data. The mismatch in Δ results primarily in a shift of the local maximum in r to smaller values of δ. This effect occurs because the modeled hemodynamic response (Fig. 7A) has an asymmetric shape, with a faster rise time and a slower decay. In Figure 7C, the black symbols and error bars indicate the improvement in r that is obtained with increasing Δ for the case where both Model Shift and Model Duration are estimated appropriately. The gray symbols and error bars show the effect of 1‐s error in Model Shift coupled with a 10% error in Model Duration. In particular, the datum shown for Δ = 1 s approximates the situation observed experimentally when analyzing the ankle dorsiflexion fMRI data using the visual cue‐guided approach. In Figure 7B,C there are marked differences in the black and gray curves and symbols, respectively, for Δ less than ∼2 s (event‐related designs), whereas there are no differences within error for larger Δ values (including block designs).
DISCUSSION
Methods have been designed, developed, and validated for performing EMG and fMRI simultaneously. A careful, multifaceted approach was undertaken to address the difficult problem of fMRI‐induced signal contamination in EMG data. First, optoelectronic hardware was assembled to enable effective signal transmission without generating radiofrequency interference during fMRI. Second, appropriate preamplifiers were selected to minimize fMRI‐induced signal contamination, with the EMG system's highpass cut‐off providing the most effective means to reduce contamination. Third, it was shown that the signal contamination is positional and depends on the longitudinal (z) distance from the magnet isocenter. Fourth, component analysis approaches were shown to improve the quality of the EMG data for ankle and index finger movement, providing further evidence of diverse applications of either PCA [Benar et al., 2003; Negishi et al., 2004] or ICA [Srivastava et al., 2005] for denoising biopotential signals during fMRI. Finally, this work adds to the emerging technology, recently described by others [van Duinen et al., 2005], that attempts to use EMG to improve motor fMRI experiments. Research that is pertinent includes the evaluation of the relaxation phases in dynamic motor tasks [Toma et al., 1999] and muscle fatigue [Liu et al., 2003].
Regarding postprocessing of the EMG data, the use of component analysis techniques as reported in this work is relatively novel. Typically, component analysis techniques attempt to isolate structured features in the data from noise sources [Martel et al., 2001; Thomas et al., 2002]. Here, it was recognized that stochastic EMG muscle signals could be isolated from fMRI‐induced structured noise (i.e., the opposite goal). This is achievable with the current fMRI‐compatible EMG system because it operates with low background white noise. The preamplifier was positioned close to the muscle of interest (∼15 cm). The short lead wires reduced fMRI‐induced signal EMG contamination and minimized motion artifact in the EMG data. During ankle dorsiflexion fMRI, the fast PCA algorithm removed the majority of the structured noise in the EMG time series variance (89%) effectively. ICA removed an additional 2% of the overall variance.
EMG CR values increased incrementally in all participants through the use of PCA and then ICA. However, we did observe variability in performance across muscle groups and participants. This is likely explained by the relative contribution of muscle activity and fMRI‐induced signal contamination in the EMG recordings. Both component analysis techniques are less effective at low values of CR (when the structured noise component is very large). Across muscle groups, variability in CR is explained primarily by the z‐positional dependence of the EMG measurement. Across participants, the variability is a reflection of differences in limb lengths, electrode placement, and impedance differences between participants.
Our automated component analysis EMG denoising technique is comparable to the average subtraction method first presented by Allen et al. [2000]. The PCA method transforms the EMG data matrix into ranked orthogonal time series vectors. In the current work, removing the first few PCs that are dominated by fMRI‐induced signal contamination likely has a similar effect as removing the average artifact signal, a procedure that works for both EEG [Allen et al., 2000] and EMG data [van Duinen et al., 2005]. Unfortunately, in the current work imaging acquisition triggers were not collected, but are necessary to time‐lock the EMG data to the fMRI and remove the average artifact signal. In addition, the Allen et al. method relies on electrophysiological data collection at a high sampling rate (i.e., 5 kHz). The EMG sampling rate of 1 kHz used in the current work is not likely to sample the complex fMRI‐induced signal contamination with sufficient precision to provide a useful subtraction.
The EMG signal provides a reasonably direct measurement of muscle motor units as part of the peripheral nervous system. It is considered the gold standard for assessment of movement disorders, which explains why others have used EMG prior to fMRI of stroke patients to characterize better patient behavior [Loubinoux et al., 2003], such as mirror movements or co‐contraction. EMG muscle timing can also be used in fMRI analysis to improve detection of neuronal activity. Activation shown in Figure 5 reflects an overall increase in sensitivity to the motor network for voluntary unilateral ankle dorsiflexion. This observation is complementary to a primate study in which primary motor cortex (M1) EEG signals were found to be strongly correlated with that which would be predicted post‐hoc by the EMG output [Morrow and Miller, 2003].
We observed that the detection of neural activity in the ipsilateral cerebellum was significantly improved by use of EMG timing information. One possibility to explain this result lies in the idea that cerebellum activity is tightly coupled to movement timing. Complementary findings come from a study that demonstrated that firing rates from populations of Purkinje cells were coupled to movement durations during eye movements in monkeys [Thier et al., 2000]. Furthermore, another region of interest that was better revealed when making use of EMG information was the secondary somatosensory cortex, SII. Others have found that SII is sensitive to attention [Steinmetz et al., 2000] and this is a potential explanation for why precise knowledge of movement execution increases the level of significance of SII activation.
Results from numerical simulations investigating the influence of Model Shift and Model Duration provided additional insight regarding how knowledge of behavior is likely to influence event‐related fMRI designs, such as those described here, compared to the more common block fMRI designs. Although the simulations involve calculation of the average correlation coefficient, a statistical parameter that does not entirely reflect the observed differences in voxel counts for Visual cue‐guided and EMG‐guided analysis (Figs. 5, 6), the simulations are nevertheless informative. The combined effect of a 1‐s discrepancy between the actual onset of motor behavior and the Model Shift time, and a 10% discrepancy between the actual duration of motor behavior and the Model Duration produced a sizable drop in the correlation value for brief tasks, i.e., 1 or 2 s, but showed no effect for longer task durations. These effects are expected, given that modeling errors arising from failing to account for reaction time are significant on the time scale of hemodynamic responses generated in event‐related experiments, but are much less important for the more lengthy elevations in fMRI signal generated in block designs. EMG is a useful independent measurement to quantify such behavior, especially during movements that may be complicated and involve coordination of multiple muscles.
It is also worth noting that the use of EMG measurements to refine fMRI analysis does not “create brain activity where none existed” but rather helps to reveal more aspects of the underlying neuronal activity contained within the fMRI signals. Furthermore, methods used to refine the fMRI design matrix are not restricted to EMG. Other independent measurements have been used to help characterize behavior and improve interpretation of fMRI results, such as measuring eye motion [Connolly et al., 2002], limb position [MacIntosh et al., 2004], or reaction time. Differences in reaction times on the order of just 100 ms were used to modify the hemodynamic reference waveform for a decision task and to improve fMRI activation maps [Bellgowan et al., 2003].
The developed system has the capability to provide additional behavioral measures by making use of all 8 parallel channels for multiple muscle readings or other biopotentials. Indeed, some preliminary work has been conducted to augment the current system with the addition of a skin conductance response (SCR) channel, since this psycho‐physiological correlate of attention, arousal, and effort may be relevant in motor‐learning studies [Mraz et al., 2005] or in studies of impaired motor behavior involving stroke patients with hemiparesis.
Future applications of this system include addressing basic science questions as well as questions that are clinically motivated. For instance, making use of the multiple muscle measurement capability there is the potential to refine somatotopic mapping by using the EMG information to set the temporal boundaries in tasks that involve sequential movements, such as initiating flexion then extension about a joint. Second, EMG can be used potentially as a form of biofeedback to the participant to affect the temporal and spatial features of the fMRI signal.
Finally, this system will be particularly useful in stroke recovery fMRI studies [Johansen‐Berg et al., 2002; Staines et al., 2001; Ward et al., 2003]. Although the present study focused primarily on the benefits of timing information obtained from EMG in event‐related fMRI, EMG amplitude information can also assist in the interpretation of fMRI signals generated in the presence of stroke‐related symptoms such as mirror movements, co‐contraction, and excessive muscle tone. The fMRI‐compatible EMG system described in this work is likely to be feasible for stroke patients that are able to generate a sizeable EMG burst. However, the ability to detect smaller amplitude muscle signals during fMRI is important since weakness also characterizes many hemiparetic patients. Further work to assess the range of EMG activity is warranted both to investigate stroke patients and issues of intersubject variability.
Acknowledgements
The authors thank Fred Tam for helpful discussion and Dr. Gary Glover for the spiral in/out pulse sequence used in this work.
REFERENCES
- Allen PJ, Polizzi G, Krakow K, Fish DR, Lemieux L ( 1998): Identification of EEG events in the MR scanner: the problem of pulse artifact and a method for its subtraction. Neuroimage 8: 229–239. [DOI] [PubMed] [Google Scholar]
- Allen PJ, Josephs O, Turner R ( 2000): A method for removing imaging artifact from continuous EEG recorded during functional MRI. Neuroimage 12: 230–239. [DOI] [PubMed] [Google Scholar]
- Bellgowan PS, Saad ZS, Bandettini PA ( 2003): Understanding neural system dynamics through task modulation and measurement of functional MRI amplitude, latency, and width. Proc Natl Acad Sci U S A 100: 1415–1419. [DOI] [PMC free article] [PubMed] [Google Scholar]
- Benar C, Aghakhani Y, Wang Y, Izenberg A, Al‐Asmi A, Dubeau F, Gotman J ( 2003): Quality of EEG in simultaneous EEG‐fMRI for epilepsy. Clin Neurophysiol 114: 569–580. [DOI] [PubMed] [Google Scholar]
- Buchel C, Holmes AP, Rees G, Friston KJ ( 1998): Characterizing stimulus‐response functions using nonlinear regressors in parametric fMRI experiments. Neuroimage 8: 140–148. [DOI] [PubMed] [Google Scholar]
- Clancy EA, Morin EL, Merletti R ( 2002): Sampling, noise‐reduction and amplitude estimation issues in surface electromyography. J Electromyogr Kinesiol 12: 1–16. [DOI] [PubMed] [Google Scholar]
- Cohen MS ( 1997): Parametric analysis of fMRI data using linear systems methods. Neuroimage 6: 93–103. [DOI] [PubMed] [Google Scholar]
- Connolly JD, Goodale MA, Menon RS, Munoz DP ( 2002): Human fMRI evidence for the neural correlates of preparatory set. Nat Neurosci 5: 1345–1352. [DOI] [PubMed] [Google Scholar]
- Cox RW ( 1996): AFNI: software for analysis and visualization of functional magnetic resonance neuroimages. Comput Biomed Res 29: 162–173. [DOI] [PubMed] [Google Scholar]
- Dimitrova A, Kolb FP, Elles HG, Maschke M, Forsting M, Diener HC, Timmann D ( 2003): Cerebellar responses evoked by nociceptive leg withdrawal reflex as revealed by event‐related FMRI. J Neurophysiol 90: 1877–1886. [DOI] [PubMed] [Google Scholar]
- Glover GH, Thomason ME ( 2004): Improved combination of spiral‐in/out images for BOLD fMRI. Magn Reson Med 51: 863–868. [DOI] [PubMed] [Google Scholar]
- Hammond MC, Fitts SS, Kraft GH, Nutter PB, Trotter MJ, Robinson LM ( 1988): Co‐contraction in the hemiparetic forearm: quantitative EMG evaluation. Arch Phys Med Rehabil 69: 348–351. [PubMed] [Google Scholar]
- Hoffmann A, Jager L, Werhahn KJ, Jaschke M, Noachtar S, Reiser M ( 2000): Electroencephalography during functional echo‐planar imaging: detection of epileptic spikes using post‐processing methods. Magn Reson Med 44: 791–798. [DOI] [PubMed] [Google Scholar]
- Hyvarinen A, Oja E ( 2000): Independent component analysis: algorithms and applications. Neural Netw 13: 411–430. [DOI] [PubMed] [Google Scholar]
- Ives JR, Warach S, Schmitt F, Edelman RR, Schomer DL ( 1993): Monitoring the patient's EEG during echo planar MRI. Electroencephalogr Clin Neurophysiol 87: 417–420. [DOI] [PubMed] [Google Scholar]
- Johansen‐Berg H, Rushworth MF, Bogdanovic MD, Kischka U, Wimalaratna S, Matthews PM ( 2002): The role of ipsilateral premotor cortex in hand movement after stroke. Proc Natl Acad Sci U S A 99: 14518–14523. [DOI] [PMC free article] [PubMed] [Google Scholar]
- Kautz SA, Brown DA ( 1998): Relationships between timing of muscle excitation and impaired motor performance during cyclical lower extremity movement in post‐stroke hemiplegia. Brain 121: 515–526. [DOI] [PubMed] [Google Scholar]
- Knutsson E, Richards C ( 1979): Different types of disturbed motor control in gait of hemiparetic patients. Brain 102: 405–430. [DOI] [PubMed] [Google Scholar]
- Lamontagne A, Richards CL, Malouin F ( 2000): Coactivation during gait as an adaptive behavior after stroke. J Electromyogr Kinesiol 10: 407–415. [DOI] [PubMed] [Google Scholar]
- Liu JZ, Dai TH, Elster TH, Sahgal V, Brown RW, Yue GH ( 2000): Simultaneous measurement of human joint force, surface electromyograms, and functional MRI‐measured brain activation. J Neurosci Methods 101: 49–57. [DOI] [PubMed] [Google Scholar]
- Liu JZ, Shan ZY, Zhang LD, Sahgal V, Brown RW, Yue GH ( 2003): Human brain activation during sustained and intermittent submaximal fatigue muscle contractions: an FMRI study. J Neurophysiol 90: 300–312. [DOI] [PubMed] [Google Scholar]
- Loubinoux I, Carel C, Pariente J, Dechaumont S, Albucher JF, Marque P, Manelfe C, Chollet F ( 2003): Correlation between cerebral reorganization and motor recovery after subcortical infarcts. Neuroimage 20: 2166–2180. [DOI] [PubMed] [Google Scholar]
- Luft AR, Forrester L, Macko RF, McCombe‐Waller S, Whitall J, Villagra F, Hanley DF ( 2005): Brain activation of lower extremity movement in chronically impaired stroke survivors. Neuroimage 26: 184–194. [DOI] [PubMed] [Google Scholar]
- MacIntosh BJ, Mraz R, Baker N, Tam F, Staines WR, Graham SJ ( 2004): Optimizing the experimental design for ankle dorsiflexion fMRI. Neuroimage 22: 1619–1627. [DOI] [PubMed] [Google Scholar]
- Martel AL, Moody AR, Allder SJ, Delay GS, Morgan PS ( 2001): Extracting parametric images from dynamic contrast‐enhanced MRI studies of the brain using factor analysis. Med Image Anal 5: 29–39. [DOI] [PubMed] [Google Scholar]
- McKeown MJ, Radtke R ( 2001): Phasic and tonic coupling between EEG and EMG demonstrated with independent component analysis. J Clin Neurophysiol 18: 45–57. [DOI] [PubMed] [Google Scholar]
- Morrow MM, Miller LE ( 2003): Prediction of muscle activity by populations of sequentially recorded primary motor cortex neurons. J Neurophysiol 89: 2279–2288. [DOI] [PMC free article] [PubMed] [Google Scholar]
- Mraz R, MacIntosh BJ, Ives J, Graham SJ ( 2005): Utility of an MR‐compatible skin conductance measurement system during fMRI of a difficult motor task. Proc 13th Annual Meeting ISMRM, Miami, FL.
- Negishi M, Abildgaard M, Nixon T, Todd Constable R ( 2004): Removal of time‐varying gradient artifacts from EEG data acquired during continuous fMRI. Clin Neurophysiol 115: 2181–2192. [DOI] [PubMed] [Google Scholar]
- Sahyoun C, Floyer‐Lea A, Johansen‐Berg H, Matthews PM ( 2004): Towards an understanding of gait control: brain activation during the anticipation, preparation and execution of foot movements. Neuroimage 21: 568–575. [DOI] [PubMed] [Google Scholar]
- Srivastava G, Crottaz‐Herbette S, Lau KM, Glover GH, Menon V ( 2005): ICA‐based procedures for removing ballistocardiogram artifacts from EEG data acquired in the MRI scanner. Neuroimage 24: 50–60. [DOI] [PubMed] [Google Scholar]
- Staines WR, McIlroy WE, Graham SJ, Black SE ( 2001): Bilateral movement enhances ipsilesional cortical activity in acute stroke: a pilot FMRI study. Neurology 56: 401–404. [DOI] [PubMed] [Google Scholar]
- Staines WR, Black SE, Graham SJ, McIlroy WE ( 2002): Somatosensory gating and recovery from stroke involving the thalamus. Stroke 33: 2642–2651. [DOI] [PubMed] [Google Scholar]
- Steinmetz PN, Roy A, Fitzgerald PJ, Hsiao SS, Johnson KO, Niebur E ( 2000): Attention modulates synchronized neuronal firing in primate somatosensory cortex. Nature 404: 187–190. [DOI] [PubMed] [Google Scholar]
- Thier P, Dicke PW, Haas R, Barash S ( 2000): Encoding of movement time by populations of cerebellar Purkinje cells. Nature 405: 72–76. [DOI] [PubMed] [Google Scholar]
- Thomas CG, Harshman RA, Menon RS ( 2002): Noise reduction in BOLD‐based fMRI using component analysis. Neuroimage 17: 1521–1537. [DOI] [PubMed] [Google Scholar]
- Toma K, Honda M, Hanakawa T, Okada T, Fukuyama H, Ikeda A, Nishizawa S, Konishi J, Shibasaki H ( 1999): Activities of the primary and supplementary motor areas increase in preparation and execution of voluntary muscle relaxation: an event‐related fMRI study. J Neurosci 19: 3527–3534. [DOI] [PMC free article] [PubMed] [Google Scholar]
- van Duinen H, Zijdewind I, Hoogduin H, Maurits N ( 2005): Surface EMG measurements during fMRI at 3T: accurate EMG recordings after artifact correction. Neuroimage 27: 240–246. [DOI] [PubMed] [Google Scholar]
- Ward NS, Brown MM, Thompson AJ, Frackowiak RS ( 2003): Neural correlates of motor recovery after stroke: a longitudinal fMRI study. Brain 126: 2476–2496. [DOI] [PMC free article] [PubMed] [Google Scholar]
- Zemke AC, Heagerty PJ, Lee C, Cramer SC ( 2003): Motor cortex organization after stroke is related to side of stroke and level of recovery. Stroke 34: e23–28. [DOI] [PubMed] [Google Scholar]