

Abstract
Aims
To compare characteristics of individuals participating in randomized control trials (RCTs) of treatments of substance use disorder (SUD) with individuals receiving treatment in usual care settings, and to provide a summary quantitative measure of differences between characteristics of these two groups of individuals using propensity score methods.
Design
Analyses using data from RCT samples from the National Institute of Drug Abuse Clinical Trials Network (CTN) and target populations of patients drawn from the Treatment Episodes Data Set-Admissions (TEDS-A).
Settings
Multiple clinical trial sites and nationwide usual SUD treatment settings in the United States.
Participants
A total of 3,592 individuals from 10 CTN samples and 1,602,226 individuals selected from TEDS-A between 2001 and 2009.
Measurements
The propensity scores for enrolling in the RCTs were computed based on the following nine observable characteristics: sex, race/ethnicity, age, education, employment status, marital status, admission to treatment through criminal justice, intravenous drug use, and the number of prior treatments.
Findings
The proportion of those with ≥12 years of education and the proportion of those who had full-time jobs were significantly higher among RCT samples than among target populations (in seven and nine trials, respectively, at p<.001). The pooled difference in the mean propensity scores between the RCTs and the target population was 1.54 standard deviations and was statistically significant at p<.001.
Conclusions
In the USA, individuals recruited into randomized control trials (RCT) of substance use disorder treatments appear to be very different from individuals receiving treatment in usual care settings. Notably, RCT participants tend to have more years of education and a greater likelihood of full-time work compared with people receiving care in usual care settings.
Introduction
Randomized controlled trials (RCTs) are generally considered the gold standard for establishing the effectiveness of new interventions. Decision making for health policies and for clinical practice relies heavily on findings of RCTs. Furthermore, RCTs provide confidence in causal attribution of the effects of new interventions through eliminating threats to internal validity.
However, the study design of RCTs does not eliminate threats to external validity, which indicates how well findings from one particular setting can apply to the target population, i.e., “the group of persons for whom an intervention is planned.”(1) Lack of external validity is a concern when the RCT participants are different from the target population. Findings from recent studies have heightened these concerns by showing that RCT samples might not represent the types of patients encountered in usual clinical practice settings (2,3). In the context of substance use disorders (SUD), recent studies have shown that tight exclusion criteria commonly employed in RCTs might have resulted in RCT samples that are different with regard to sex and race distribution from the treatment-seeking populations in usual care settings (4–7).
Past research has mainly examined what proportion of a putative target population would be excluded from RCTs based on the formal eligibility criteria. One study found that commonly used exclusion criteria in the RCTs of alcohol use disorder treatments excludes approximately 20% to 33% of patients with these disorders (5). This study also found that commonly used exclusion criteria tend to exclude more female and African American patients. Another study found that common eligibility criteria in cannabis treatment RCTs would exclude 80% of patients with cannabis dependence (7). These findings indicate substantial selection bias in RCT samples.
Yet, past studies have rarely compared the characteristics of actual RCT participants and the intended target populations. In addition to exclusion criteria, refusal to participate in RCTs impacts representativeness. Refusal to participate in RCTs is especially a concern in SUD treatment studies as a large proportion of clients are referred to treatment from the criminal justice system and are not voluntarily seeking treatment. Direct comparisons of RCT samples with the target populations for whom the treatments are intended could provide guidance as to the potential threats to the generalizability of findings of RCTs. To our knowledge, no previous studies have directly compared the RCT samples and target populations in the context of SUD treatments.
Recruiting representative samples of target populations into RCTs can be challenging (8). Participation decisions may vary across different socio-demographic groups. Individuals with more education and higher socioeconomic status might hold a more positive attitude toward scientific research and be more willing to participate in RCTs (9,10). It may also be difficult to enroll individuals who have jobs, and thus have higher opportunity costs of participation in RCTs than the unemployed (11). Importantly, these characteristics are likely to be associated with attrition and treatment outcomes (12–15).
This study compared differences in characteristics of individuals who participated in a number of RCTs of SUD treatments with those drawn from target populations for whom these treatments are intended. The aims of this study were two-fold:
To perform a pairwise comparison of socio-demographic characteristics between each RCT sample and its corresponding target population; and
To estimate differences between the RCT samples and target populations by calculating propensity scores based on nine measured characteristics of participants in each RCT and its corresponding target population.
Methods
Data source
The NIDA CTN studies are multisite clinical trial projects to evaluate the efficacy of treatments for SUD. At the time of this study, data from 27 CTN RCTs were publically available (16).
The TEDS-A is part of a national census data system collecting data on admissions to SUD treatment facilities annually. All States that receive public funds for SUD treatment programs are required to provide the data to the TEDS-A. The TEDS-A compiles annual national data on more than 1.5 million patients aged 12 and older, thus providing a relevant target population for samples recruited to specific RCTs. We identified a separate target population drawn from TEDS-A for each RCT based on the characteristics of the patients who were the target of the intervention for that RCT. We considered age and the target substance in defining the target populations. Age was considered because some interventions were specifically intended for young adults. We also attempted to draw samples from TEDS-A for the years corresponding to each RCT. For example, the target population for the CTN00010, an RCT of Buprenorphine/Naloxone facilitated rehabilitation for heroin addicted adolescents and young adults aged 14-21 recruited between July 2003 and December 2005, was drawn from the population of patients in TEDS-A 2003-2006 who were between 14 and 21 years old and received SUD treatment for opioid use disorders. If an RCT was clearly intended for a more specific target population (e.g., pregnant women), we identified the corresponding target population according to these additional criteria. eTable 1 (online supplement) provides descriptions of corresponding target populations for each CTN RCT.
We could not define target populations for all 27 CTN datasets available in The CTN database at the time of this study because of limited information available in TEDS-A. For instance, TEDS-A does not contain information regarding HIV status. Therefore, we could not define target populations for CTN studies involving HIV-positive patients. This study utilizes ten CTN RCTs for which TEDS-A target populations could be matched based on the RCT inclusion criteria.
Five of these ten studies assessed the effectiveness of Buprenorphine/Naloxone detoxification (Bup/Nx-Detox) for opioid dependence either in inpatient (CTN0001(17)) or outpatient settings (CTN0002(17), CTN0003(18), CTN0010(19), CTN0030(20)). Most focused on Bup/Nx-Detox in adults aged ≥18 years (CTN0001, CTN0002, CTN0030). One study included those aged ≥15 years (CTN0003); another included youth aged 14-21 only (CTN0010). Three studies aimed to assess the effectiveness of motivational enhancement/interviewing (MEI) for SUD in outpatient settings (CTN0004(21), CTN0005(22), CTN0013(23)). While CTN0004 and CTN0005 targeted men and women aged ≥18 years, CTN0013 targeted only pregnant women. The other two studies aimed to assess the effectiveness of motivational incentives (Incentives) for current cocaine, methamphetamine or amphetamine use among adults aged ≥18 in outpatient settings (CTN0006(24), CTN0007(25)).
Assessments
Baseline characteristics of the CTN RCT patients were assessed at the time of enrollment. In TEDS-A, patients' information was collected at treatment onset. Nine comparable variables were recorded both in the RCT samples and the TEDS-A: sex, race-ethnicity (White, Black, Hispanic, and other), age (recoded into 12-14, 15-17, 18-20, 21-24, 25-30, 31-34, 35-40, 41-44, 45-50, 51-54, ≥55 years), education (<8 years, 9-11, 12, 13-15, ≥16 years), employment (full-time, part-time, out of labor force (students, homemakers, and those without jobs not looking for work), and unemployed (those without jobs who are actively looking for work)), marital status (never married, married, separated, divorced/widowed), admission through criminal justice, intravenous drug use, and the number of prior treatments for SUD.
Statistical Analysis
We first compared each RCT sample with its corresponding target population with regard to the baseline characteristics noted. There was a non-negligible amount of missing data, particularly in the TEDS-A. eTable 2 (online supplement) presents the percentage of missing observations in each RCT and target population. Missing values ranged from 0.1% for sex in the TEDS-A target populations for CTN0001 and CTN00030 RCTs and for intravenous drug use in the TEDS-A target population for CTN0004 RCT to 70.5% for the number of prior treatments in the CTN0001 RCT. We applied multiple imputation techniques with the ice command in STATA, version 13 (Stata Corp) to create 50 imputations for each trial. All the nine variables described above were included for imputation models except for the number of prior treatments for CTN0001 (see below) and employment, criminal justice admission, IV drug use and number of prior treatments in the analyses of CTN0010 because they were not available for that study. Multiple imputation relies on the assumption that the missing data are missing at random—i.e., the missingness can be fully explained by the variables included in the imputation models and is not related to unobserved factors (26). Deviations from this assumption would have a greater impact on imputed values of variables with a larger proportion of missing data. The percentage of missing data regarding the number of prior treatments in TEDS-A was particularly large among those who were admitted to inpatient treatment settings. CTN0001 was the only study that targeted patients in inpatient settings. Considering the high percentage of missingness in number of prior treatments of the target population for CTN0001, we did not use this variable in the imputation of CTN0001 data and its corresponding TEDS-A data.
Using the imputed datasets, we calculated propensity scores modelling being enrolled in each RCT based on the characteristics of the RCT and target population; the propensity score is the conditional probability of an individual being in the RCT. We computed the propensity score-based index ∆p, introduced by Stuart et al. (27) to aid researchers in assessing the representativeness of RCT samples compared to target populations. ∆p is defined as the difference between the average propensity scores of the RCT and the target population. Divided by the pooled standard deviation of the propensity scores, the standardized ∆p provides a summary index of differences between samples with regard to all variables used for computing the propensity scores In the context of observational studies (28,29), propensity score mean values that differ by more than 0.25 standard deviations (standardized ∆p) indicate significant differences between the samples, requiring a large amount of extrapolation (30,31). Other investigators have adopted a more stringent value of 0.1 and larger as indicating significant differences (32). In this study we computed both ∆p and standardized ∆p. In addition, we conducted two-sample t-tests for comparison of the propensity scores.
We used the non-parametric random forests approach to calculate the propensity scores (33,34). The R package “randomForest”(35) was used for these analyses. Random forests have several advantages over a parametric approach, including higher predictive accuracy (36) and the ability to reduce misclassification error through bootstrap resampling methods, which is especially useful when comparing class-imbalanced data, such as the present case, where target populations are much larger than the RCT samples (37). Through this bootstrap resampling method, the same number of balance the sizes of the groups. This down-sampling of the majority class has been shown to work well for class-imbalanced data (38).
Because 50 imputations were generated, we obtained 50 different sets of propensity scores for each comparison. The variances of the mean propensity scores were estimated using the formula introduced by Rubin (39) in order to take into account both within- and between-imputation variance.
We used meta-analytic techniques to compute pooled ∆p's for the three groups of different SUD treatment studies (Bup/Nx-Detox, MEI, and Incentives) included in the sample and to compare these values across the study groups. Additionally, heterogeneity in ∆p's was assessed among individual studies using I2 which is defined as the percentage of total variation across studies that is due to heterogeneity rather than chance (40). An I2 of 75% is considered to indicate a high level of heterogeneity among studies. The metan (41) command of STATA 13 was used for these calculations.
Role of the funding source
The funding organizations had no role in the design and conduct of the study; collection, management, analysis, and interpretation of the data; preparation, review, or approval of the manuscript; or decision to submit the manuscript for publication.
Results
Comparison of characteristics of RCT samples and target populations
For all ten RCTs examined, RCT participants were more likely to have ≥12 years of education than target populations (Table 1). The proportion with ≥12 years of education was significantly higher among RCT-enrolled patients than among patients in target populations in seven of the ten trials.
Table 1. Comparison of baseline characteristics (%) of the samples in ten National Institute of Drug Abuse Clinical Trial Network (CTN) studies and target samples from the Treatment Episodes Data-Admission (TEDS-A).
| Buprenorphine/Naloxone (Bup/Nx) Detoxification | Motivational enhancement/interviewing | Motivational incentives | ||||||||||||||||||
|---|---|---|---|---|---|---|---|---|---|---|---|---|---|---|---|---|---|---|---|---|
| CTN0001 | CTN0002 | CTN0003 | CTN0010 | CTN0030 | CTN0004 | CTN0005 | CTN0013 | CTN0006 | CTN0007 | |||||||||||
| RCT | TEDS | RCT | TEDS | RCT | TEDS | RCT | TEDS | RCT | TEDS | RCT | TEDS | RCT | TEDS | RCT | TEDS | RCT | TEDS | RCT | TEDS | |
| Total number | 113 | 3,111 | 230 | 57,959 | 516 | 157,619 | 154 | 22,588 | 653 | 260,754 | 461 | 520,636 | 423 | 258,887 | 200 | 57,526 | 454 | 213,869 | 388 | 49,277 |
| Sex | ||||||||||||||||||||
| Female | 39.81 | 25.9 | 28.3 | 38.2 | 32.8 | 39.4 | 41.6 | 32.4 | 39.9 | 44.3 | 29.1 | 35.6 | 42.1 | 35.4 | 100.0 | 100.0 | 54.9 | 38.7 | 45.1 | 40.8 |
| Race | ||||||||||||||||||||
| White | 55.8 | 52.5 | 40.0 | 53.2 | 71.1 | 57.6 | 70.1 | 69.4 | 91.0 | 68.5 | 42.0 | 62.9 | 71.9 | 62.2 | 37.2 | 58.0 | 35.7 | 54.4 | 24.9 | 50.4 |
| Black | 19.5 | 15.9 | 36.5 | 29.6 | 10.9 | 26.0 | 0.0 | 17.4 | 2.9 | 21.3 | 42.2 | 25.8 | 9.5 | 26.3 | 32.7 | 23.2 | 42.5 | 33.4 | 51.1 | 33.5 |
| Hispanic | 15.9 | 30.1 | 20.0 | 15.7 | 6.8 | 5.6 | 23.4 | 11.9 | 4.1 | 8.2 | 10.7 | 8.0 | 2.8 | 8.0 | 18.1 | 13.4 | 13.0 | 8.9 | 16.4 | 15.5 |
| Age | ||||||||||||||||||||
| 12-17 | 0.0 | 0.0 | 0.0 | 0.0 | 0.0 | 5.8 | 4.5 | 49.7 | 0.0 | 0.0 | 0.0 | 0.0 | 0.0 | 0.0 | 0.0 | 0.0 | 0.0 | 0.0 | 0.0 | 0.0 |
| 18-29 | 28.3 | 30.9 | 22.2 | 33.8 | 31.6 | 32.3 | 95.5 | 50.3 | 44.1 | 39.8 | 30.6 | 38.6 | 38.5 | 37.4 | 74.5 | 68.1 | 21.6 | 32.6 | 8.0 | 26.4 |
| 30-39 | 26.6 | 38.4 | 22.6 | 29.8 | 28.7 | 27.2 | 0.0 | 0.0 | 28.0 | 26.0 | 29.7 | 33.3 | 30.7 | 35.2 | 22.5 | 26.8 | 41.9 | 38.6 | 26.6 | 36.1 |
| 40-49 | 35.4 | 24.8 | 37.8 | 26.7 | 27.1 | 24.4 | 0.0 | 0.0 | 18.2 | 21.1 | 31.2 | 23.1 | 23.4 | 22.7 | 3.0 | 4.6 | 31.3 | 24.4 | 43.3 | 30.1 |
| 50 and over | 9.7 | 5.9 | 17.4 | 9.7 | 12.6 | 10.3 | 0.0 | 0.0 | 9.7 | 13.0 | 8.5 | 5.0 | 7.4 | 4.7 | 0.0 | 0.5 | 5.3 | 4.4 | 22.1 | 7.4 |
| Education | ||||||||||||||||||||
| ≥12 years | 87.6 | 63.0 | 73.5 | 63.5 | 84.3 | 61.8 | 51.9 | 28.5 | 84.4 | 66.7 | 80.5 | 63.4 | 76.4 | 62.7 | 54.5 | 54.4 | 66.5 | 62.2 | 64.5 | 61.3 |
| Employment | ||||||||||||||||||||
| Full-time | 58.0 | 5.6 | 54.3 | 22.5 | 58.9 | 18.6 | -- | -- | 63.1 | 16.1 | 58.8 | 24.3 | 57.4 | 25.5 | 32.5 | 8.6 | 48.2 | 20.6 | 31.7 | 14.6 |
| Marital Status | ||||||||||||||||||||
| Married | 33.6 | 12.8 | 24.3 | 18.5 | 30.2 | 17.8 | 14.3 | 1.9 | 28.7 | 17.7 | 18.4 | 16.8 | 19.9 | 16.9 | 14.5 | 16.7 | 23.3 | 16.2 | 14.0 | 14.8 |
| Criminal justice admission | ||||||||||||||||||||
| Yes | 8.9 | 3.9 | 3.1 | 31.6 | 2.5 | 28.5 | -- | -- | 0.5 | 18.7 | 32.2 | 35.8 | 53.2 | 35.6 | 13.0 | 31.4 | 35.9 | 30.9 | 5.0 | 17.7 |
| IV drug use | ||||||||||||||||||||
| Yes | 31.1 | 18.5 | 26.7 | 26.0 | 26.3 | 29.7 | -- | -- | 3.4 | 36.8 | 6.0 | 20.0 | 16.3 | 20.5 | 2.8 | 16.3 | 9.3 | 22.2 | 35.6 | 52.5 |
| # prior treatments | ||||||||||||||||||||
|  ≥ 5 times | -- | -- | 15.4 | 6.1 | 20.4 | 7.7 | -- | -- | 4.1 | 11.6 | 24.1 | 13.6 | 9.0 | 13.9 | 11.4 | 7.3 | 19.1 | 14.6 | 42.6 | 23.0 |
Pearson chi-square test was conducted. Numbers written in bold letters indicate statistically significant differences between RCT and TEDS-A samples at p<.05.
Not included in the analyses as these variables were not available for CTN0010.
Not included in the analyses because of a large number of missing values for this variable in TEDS-A.
Patients in RCTs were also more likely to be employed full-time than patients in target populations. The proportion of those who had full-time jobs was significantly higher among patients enrolled in the RCTs than among patients in target populations in all nine trials in which employment status was measured.
Except for CTN0005 (MEI for SUD) and CTN0030 (Bup/Nx-Detox for prescription opioid dependence), patients who were enrolled in the RCTs were more likely to have had a larger number of prior treatments before entering the trials than patients in the target populations. The proportion of those with ≥5 prior treatments was significantly higher among RCT patients than those in target populations in six of the eight trials in which the number of prior treatments was available or used in the analyses.
Individual RCTs and their target populations also differed with regard to other characteristics. There were statistically significant differences in proportions of females, specific race-ethnicity groups, age groups, married individuals, admissions through criminal justice system and IV drug use between individual RCTs and target populations (Table 1).
Estimation of propensity scores
Table 2 presents the propensity scores associated with being enrolled in each RCT, based on observable characteristics. These propensity scores represent summary measures of differences in these characteristics between RCTs and target populations.
Table 2. Comparison of propensity scores between samples in 10 National Institute of Drug Use Clinical Trial Network (CTN) randomized controlled trials (RCTs) and target samples from the Treatment Episodes Data-Admission (TEDS-A).
| Study type | Study Number | Mean propensity score | ∆pa | Pooled standard deviation | Standardized ∆pb | t-test | p-value | |
|---|---|---|---|---|---|---|---|---|
| RCT | TEDS-A | |||||||
| Buprenorphine/Naloxone (Bup/Nx) Detoxification | CTN0001 | 0.69 | 0.19 | 0.50 | 0.25 | 2.07 | 22.94 | <0.001 |
| CTN0002 | 0.64 | 0.25 | 0.39 | 0.23 | 1.67 | 24.99 | <0.001 | |
| CTN0003 | 0.70 | 0.25 | 0.45 | 0.26 | 1.72 | 38.99 | <0.001 | |
| CTN0010 | 0.69 | 0.21 | 0.48 | 0.24 | 2.03 | 25.32 | <0.001 | |
| CTN0030 | 0.80 | 0.20 | 0.60 | 0.28 | 2.08 | 53.12 | <0.001 | |
| Motivational enhancement/interviewing | CTN0004 | 0.61 | 0.30 | 0.31 | 0.23 | 1.35 | 28.65 | <0.001 |
| CTN0005 | 0.57 | 0.33 | 0.24 | 0.23 | 1.06 | 21.74 | <0.001 | |
| CTN0013 | 0.65 | 0.27 | 0.38 | 0.23 | 1.63 | 21.19 | <0.001 | |
| Motivational incentives | CTN0006 | 0.57 | 0.32 | 0.25 | 0.21 | 1.20 | 25.23 | <0.001 |
| CTN0007 | 0.62 | 0.28 | 0.34 | 0.23 | 1.46 | 27.59 | <0.001 | |
| Pooled results | ||||||||
| Pooled standardized | 95% CI | Heterogeneity statistics | ||||||
| I2c | χ2 (df) | p-value | ||||||
| Overall | 1.54 | 1.49 – 1.60 | 94.6% | 165.45 (df = 9) | <0.001 | |||
| Buprenorphine/Naloxone(Bup/Nx) Detoxification | 1.90 | 1.81 – 1.98 | 79.6% | 19.57 (df = 4) | <0.001 | |||
| Motivational enhancement/interviewing | 1.28 | 1.18 – 1.37 | 89.2% | 18.51 (df = 2) | <0.001 | |||
| Motivational incentives | 1.31 | 1.21 – 1.42 | 83.3% | 5.97 (df = 1) | 0.02 | |||
∆p is difference between propensity scores of CTN RCT sample and TEDS-A samples.
Standardized ∆p is computed as ∆p divided by pooled standard deviation.
I2 is the percentage of observed total variation across studies that is due to heterogeneity rather than chance. It is calculated as I2 = 100% × (Q - df)/Q, where Q is Cochran's heterogeneity statistic and df the degrees of freedom (see text for further information).
Across all CTN studies examined, the estimated propensity scores for RCTs were significantly higher than for the target populations. The ∆p indices, computed as the difference between the two propensity scores, ranged from 0.25 to 0.60 and standardized ∆p indices ranged from 1.06 to 2.08 standard deviations (pooled average ∆p=1.54). The pooled ∆p's were larger for Bup/Nx-Detox studies (1.90, 95% CI=1.81-1.98) than for MEI studies (1.28, 95% CI=1.18-1.37) and Incentives studies (1.31, 95% CI=1.21-1.42) (test for comparison of groups of studies, c2= 121.40, df=2, p<.001). However, these differences should be interpreted with caution because of significant heterogeneity among studies within each of the three groups of studies as indicated by the high I2 values (Table 2, lower panel).
Figure 1 presents the density plots of propensity scores for each RCT and its target population. A larger overlapping area between the density plot for RCT and its target population indicates that the RCT sample had similar characteristics to the target population, whereas limited overlap indicates fewer similarities between the two. Studies that have relatively smaller standardized ∆p's (CTN0004, CTN0005, CTN0006, CTN0007), have larger overlapping areas between density plots of RCTs and the target populations. In contrast, studies that have relatively larger standardized ∆p's (CTN0001, CTN0010, CTN0030), have smaller overlapping areas.
Figure 1.
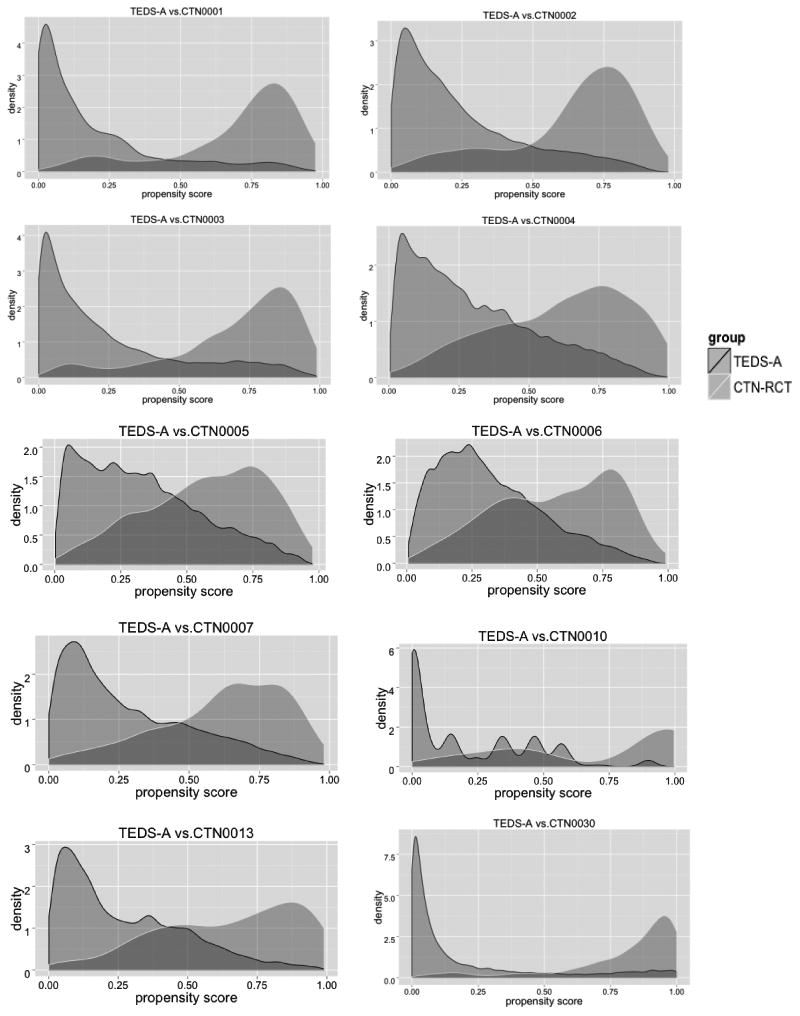
Density plots of propensity scores in 10 National Institute of Drug Use Clinical Trial Network (CTN) randomized controlled trials (RCTs) and target samples from the Treatment Episodes Data-Admission (TEDS-A).
Discussion
We found significant differences between patients participating in RCTs and the target populations of patients receiving SUD treatment in usual care settings. RCT patients had higher levels of education and were more likely to have full-time employment than those in the target populations. This is consistent with past research which suggests that those with higher socio-demographic status have greater trust in benefits of scientific research and more willingness to participate in trials (9,10). Moreover, except for one RCT, those who were included in the RCTs had larger numbers of prior treatments than the target populations, which could be due to greater reliance on the formal treatment service system or less successful experiences in previous treatments. The larger ∆p values for medication trials compared to behavioral trials may reflect more stringent eligibility criteria in medication trials. Even though pregnant or lactating women were excluded from the clinical trials, it was not always the case that women were underrepresented in these trials. There was also no systematic pattern of under-representation of racial/ethnic minorities, which is consistent with the intention of the CTN to recruit more racial/ethnic minorities into clinical trials. This was particularly the case in Incentives studies where the percentage of the non-White individuals was higher in the trial samples than the target populations, suggesting that these CTN studies successfully recruited more racial/ethnic minorities than other studies (42).
The differences between RCT and target population propensity scores (∆p) ranged from 1.06 to 2.08 standard deviations. These numbers far exceed the 0.25 standardized ∆p cutoff proposed by Stuart (31), indicating significant differences between samples. This point was confirmed by the density plots of the propensity scores for the RCTs and target samples, which showed large differences. The interpretation of the standardized ∆p is similar to the interpretation of Cohen's d effect size (43). A Cohen's d of 1.06 and 2.08 indicate a 59% and 29% probability assuming normal distributions, respectively, that the two groups will overlap.
The findings have implications for generalizability of treatment effects. For example, employed individuals with higher levels of education typically have more socioeconomic resources. Even though we could not directly assess attitude toward SUD treatment in this study, higher participation rate in the trials among individuals with higher levels of education and full-time jobs might be associated with more positive attitudes toward SUD treatment. Studies suggest that positive attitude toward SUD treatment might be associated with better outcome or more timely recovery (44). Furthermore, prior studies indicate that these characteristics may impact relapse and response to SUD treatment (12–15,45,46). Future research needs to empirically assess whether these differences between RCT samples and target populations indeed contribute to a more favorable response to experimental interventions delivered through RCTs. It may be feasible to adjust the analyses of trials using propensity score weights or flexible regression models in order to estimate effects in the target populations of interest, if the differences in the propensity scores between the trial samples and the target populations are relatively small (27,47). This weighting-based approach would presumably correct biases in estimated effects of treatments and improve generalizability of RCT results.
Several limitations should be considered when interpreting this study's findings. First, the number of variables that were available to assess for both RCTs and the TEDS-A were relatively small. The RCTs and target populations might differ on other characteristics. For example, presence of mental and physical disorders and severity of symptoms could influence the probability of RCT enrollment and impact treatment outcomes. More importantly, attitudes toward recovery and readiness for change may differ significantly between RCT participants and typical treatment populations. Furthermore, lack of information regarding HIV status and the presence of co-occurring mental disorders as well as substance use disorders could have biased the socioeconomic distribution of the trial samples because individuals with these disorders tend to have lower socioeconomic status (48,49). With a larger range of variables included in propensity score models, the differences between RCTs and TEDS-A would likely be even larger. Second, TEDS-A had a non-negligible number of missing observations that we addressed with multiple imputation, which could possibly bias the composition of the target populations if the missingness at random assumption is incorrect. Third, because of limitations in reported characteristics for TEDS-A participants, we could not delineate target populations a number of other CTN RCTs. The RCTs included were limited to studies of Bup/Nx-Detox, MEI and Incentives. The results may not generalize to other CTN trials or other interventions, which have different inclusion criteria.
In the context of these limitations, findings from this study provide a first glimpse into differences between participants of SUD treatment RCTs and target patient populations in usual care settings based on direct comparisons of these groups. The results support past research that compared the exclusion criteria of RCTs with characteristics of target populations(5), indicating that these RCTs are highly selective and do not represent the target populations adequately. In order to ensure generalizability of RCT findings to relevant target populations, future studies should examine the implications of these differences. Some differences between RCT and target populations may arise from the strict eligibility criteria for RCTs, leading to exclusion of many potential participants. Some of these eligibility criteria may be necessary and justifiable from a patient safety perspective, such as pregnancy and medication allergies. However, stringent eligibility criteria may exclude individuals who are less responsive to treatments, potentially leading to an overestimation of the effectiveness of the interventions. For example, comorbid mental disorders may be associated with lower educational attainment, which in turn is associated with a lower trial retention rate (50) and higher prevalence of substance use disorders (51).
Representativeness of the trial samples in future CTN trials should be carefully considered, particularly because the primary mission of the CTN was to improve the nationwide quality of drug abuse treatment. The findings also have implications for other trial networks, such as the National Cancer Institute (NCI) Clinical Trial Network Program (52). The movement toward “practical clinical trials” has produced important insights regarding the real-world effectiveness of psychiatric medications (53). These trials generally had less stringent exclusion criteria. A similar move toward less stringent exclusion criteria in SUD treatment trials might improve generalizability of these RCTs as well. The growing demand for comparative effectiveness data on SUD treatments from policy makers and program developers may motivate future moves toward more representative samples in SUD treatment RCTs.
Supplementary Material
Acknowledgments
This work was supported by grant R01 DA036520 from the National Institute on Drug Abuse (NIDA). The content is solely the responsibility of the authors and does not necessarily represent the official views of the National Institutes of Health.
Drs. Crum, Stuart and Mojtabai report grants from National Institute on Drug Abuse and National Institute of Mental Health during the conduct of the study. Dr. Mojtabai has received research funding and consulting fees from Bristol-Myers Squibb and Lundbeck Pharmaceuticals.
Footnotes
Declarations of competing interest: Dr. Susukida and Mr. Ebnesajjad have nothing to disclose.
References
- 1.Last JM. A Dictionary of Epidemiology. Oxford, United Kingdom: Oxford University Press; 1983. [Google Scholar]
- 2.Bartlett C, Doyal L, Ebrahim S, Davey P, Bachmann M, Egger M, et al. The causes and effects of socio-demographic exclusions from clinical trials. Heal Technol Assess. 2005;9(38):iii–iv. ix–x, 1–152. doi: 10.3310/hta9380. [DOI] [PubMed] [Google Scholar]
- 3.Bonell C, Oakley A, Hargreaves J, Strange V, Rees R. Assessment of generalisability in trials of health interventions: suggested framework and systematic review. BMJ. 2006;333(7563):346–9. doi: 10.1136/bmj.333.7563.346. [DOI] [PMC free article] [PubMed] [Google Scholar]
- 4.Blanco C, Olfson M, Goodwin RD, Ogburn E, Liebowitz MR, Nunes EV, et al. Generalizability of clinical trial results for major depression to community samples: results from the National Epidemiologic Survey on Alcohol and Related Conditions. J Clin Psychiatry. 2008;69(8):1276–80. doi: 10.4088/jcp.v69n0810. [DOI] [PubMed] [Google Scholar]
- 5.Humphreys K, Weingardt KR, Harris AH. Influence of subject eligibility criteria on compliance with National Institutes of Health guidelines for inclusion of women, minorities, and children in treatment research. Alcohol Clin Exp Res. 2007;31(6):988–95. doi: 10.1111/j.1530-0277.2007.00391.x. [DOI] [PubMed] [Google Scholar]
- 6.Humphreys K, Weisner C. Use of exclusion criteria in selecting research subjects and its effect on the generalizability of alcohol treatment outcome studies. Am J Psychiatry. 2000;157(4):588–94. doi: 10.1176/appi.ajp.157.4.588. [DOI] [PubMed] [Google Scholar]
- 7.Okuda M, Hasin DS, Olfson M, Khan SS, Nunes EV, Montoya I, et al. Generalizability of clinical trials for cannabis dependence to community samples. Drug Alcohol Depend. 2010;111(1-2):177–81. doi: 10.1016/j.drugalcdep.2010.04.009. [DOI] [PMC free article] [PubMed] [Google Scholar]
- 8.Treweek S, Pitkethly M, Cook J, Kjeldstrom M, Taskila T, Johansen M, et al. Strategies to improve recruitment to randomised controlled trials. Cochrane Database Syst Rev. 2010;(4):MR000013. doi: 10.1002/14651858.MR000013.pub5. [DOI] [PubMed] [Google Scholar]
- 9.Bak H. Education and public attitudes towards science: implications for the “‘deficit model’” of education and support for science and technology. Soc Sci Q. 2001;82(4):779–95. [Google Scholar]
- 10.Putnam RD. Tuning in, tuning out: The strange disappearance of social capital in America. PS Polit Sci Polit. 1995;28(04):664–83. [Google Scholar]
- 11.Groves RM. Survey errors and survey costs. Hoboken, New Jersey: John Wiley & Sons; 2004. [Google Scholar]
- 12.Aguiar P, Neto D, Lambaz R, Chick J, Ferrinho P. Prognostic factors during outpatient treatment for alcohol dependence: cohort study with 6 months of treatment follow-up. Alcohol Alcohol. 2012;47(6):702–10. doi: 10.1093/alcalc/ags097. [DOI] [PubMed] [Google Scholar]
- 13.Anderson IB, Kim-Katz SY, Dyer JE, Earnest GE, Lamb JP, Blanc PD. Area-level socioeconomic status in relation to outcomes in gamma-hydroxybutyrate intoxication. Clin Toxicol. 2009;47(1):48–57. doi: 10.1080/15563650802022839. [DOI] [PMC free article] [PubMed] [Google Scholar]
- 14.Greenfield SF, Sugarman DE, Muenz LR, Patterson MD, He DY, Weiss RD. The relationship between educational attainment and relapse among alcohol-dependent men and women: a prospective study. Alcohol Clin Exp Res. 2003;27(8):1278–85. doi: 10.1097/01.ALC.0000080669.20979.F2. [DOI] [PubMed] [Google Scholar]
- 15.Sayre SL, Schmitz JM, Stotts AL, Averill PM, Rhoades HM, Grabowski JJ. Determining predictors of attrition in an outpatient substance abuse program. Am J Drug Alcohol Abus. 2002;28(1):55–72. doi: 10.1081/ada-120001281. [DOI] [PubMed] [Google Scholar]
- 16.National Institute on Drug Abuse Clinical Trials Network. Clinical Trials Network (CTN): Research Studies [Internet] Available from: http://www.drugabuse.gov/about-nida/organization/cctn/ctn/research-studies.
- 17.Ling W, Amass L, Shoptaw S, Annon JJ, Hillhouse M, Babcock D, et al. A multi-center randomized trial of buprenorphine-naloxone versus clonidine for opioid detoxification: findings from the National Institute on Drug Abuse Clinical Trials Network. Addiction. 2005;100(8):1090–100. doi: 10.1111/j.1360-0443.2005.01154.x. [DOI] [PMC free article] [PubMed] [Google Scholar]
- 18.Ling W, Hillhouse M, Domier C, Doraimani G, Hunter J, Thomas C, et al. Buprenorphine tapering schedule and illicit opioid use. Addiction. 2009;104(2):256–65. doi: 10.1111/j.1360-0443.2008.02455.x. [DOI] [PMC free article] [PubMed] [Google Scholar]
- 19.Woody GE, Poole SA, Subramaniam G, Dugosh K, Bogenschutz M, Abbott P, et al. Extended vs short-term buprenorphine-naloxone for treatment of opioid-addicted youth: a randomized trial. JAMA. 2008;300(17):2003–11. doi: 10.1001/jama.2008.574. [DOI] [PMC free article] [PubMed] [Google Scholar]
- 20.Weiss RD, Potter JS, Fiellin DA, Byrne M, Connery HS, Dickinson W, et al. Adjunctive counseling during brief and extended buprenorphine-naloxone treatment for prescription opioid dependence: a 2-phase randomized controlled trial. Arch Gen Psychiatry. 2011;68(12):1238–46. doi: 10.1001/archgenpsychiatry.2011.121. [DOI] [PMC free article] [PubMed] [Google Scholar]
- 21.Ball SA, Martino S, Nich C, Frankforter TL, Van Horn D, Crits-Christoph P, et al. Site matters: multisite randomized trial of motivational enhancement therapy in community drug abuse clinics. J Consult Clin Psychol. 2007;75(4):556–67. doi: 10.1037/0022-006X.75.4.556. [DOI] [PMC free article] [PubMed] [Google Scholar]
- 22.Carroll KM, Ball SA, Nich C, Martino S, Frankforter TL, Farentinos C, et al. Motivational interviewing to improve treatment engagement and outcome in individuals seeking treatment for substance abuse: a multisite effectiveness study. Drug Alcohol Depend. 2006;81(3):301–12. doi: 10.1016/j.drugalcdep.2005.08.002. [DOI] [PMC free article] [PubMed] [Google Scholar]
- 23.Winhusen T, Kropp F, Babcock D, Hague D, Erickson SJ, Renz C, et al. Motivational enhancement therapy to improve treatment utilization and outcome in pregnant substance users. J Subst Abus Treat. 2008;35(2):161–73. doi: 10.1016/j.jsat.2007.09.006. [DOI] [PMC free article] [PubMed] [Google Scholar]
- 24.Petry NM, Peirce JM, Stitzer ML, Blaine J, Roll JM, Cohen A, et al. Effect of prize-based incentives on outcomes in stimulant abusers in outpatient psychosocial treatment programs: a national drug abuse treatment clinical trials network study. Arch Gen Psychiatry. 2005;62(10):1148–56. doi: 10.1001/archpsyc.62.10.1148. [DOI] [PubMed] [Google Scholar]
- 25.Peirce JM, Petry NM, Stitzer ML, Blaine J, Kellogg S, Satterfield F, et al. Effects of lower-cost incentives on stimulant abstinence in methadone maintenance treatment: a National Drug Abuse Treatment Clinical Trials Network study. Arch Gen Psychiatry. 2006;63(2):201–8. doi: 10.1001/archpsyc.63.2.201. [DOI] [PubMed] [Google Scholar]
- 26.Sterne JA, White IR, Carlin JB, Spratt M, Royston P, Kenward MG, et al. Multiple imputation for missing data in epidemiological and clinical research: potential and pitfalls. BMJ. 2009;338:b2393. doi: 10.1136/bmj.b2393. [DOI] [PMC free article] [PubMed] [Google Scholar]
- 27.Stuart EA, Cole SR, Bradshaw CP, Leaf PJ. The use of propensity scores to assess the generalizability of results from randomized trials. J R Stat Soc Ser A. 2011;174(2):369–86. doi: 10.1111/j.1467-985X.2010.00673.x. [DOI] [PMC free article] [PubMed] [Google Scholar]
- 28.Cochran WG, Rubin DB. Controlling bias in observational studies: A review. Sankhyā Indian J Stat Ser A. 1973;35(4):417–46. [Google Scholar]
- 29.Rubin DB. The use of matched sampling and regression adjustment to remove bias in observational studies. Biometrics. 1973;29(1):185–203. [Google Scholar]
- 30.Ho DE, Imai K, King G, Stuart EA. Matching as nonparametric preprocessing for reducing model dependence in parametric causal inference. Polit Anal. 2007;15(3):199–236. [Google Scholar]
- 31.Stuart EA. Matching methods for causal inference: A review and a look forward. Stat Sci. 2010;25(1):1–21. doi: 10.1214/09-STS313. [DOI] [PMC free article] [PubMed] [Google Scholar]
- 32.Mamdani M, Sykora K, Li P, Normand SL, Streiner DL, Austin PC, et al. Reader's guide to critical appraisal of cohort studies: 2. Assessing potential for confounding. BMJ. 2005;330(7497):960–2. doi: 10.1136/bmj.330.7497.960. [DOI] [PMC free article] [PubMed] [Google Scholar]
- 33.Breiman L. Random Forests. Mach Learn. 2001;45(1):5–32. [Google Scholar]
- 34.Lee BK, Lessler J, Stuart EA. Improving propensity score weighting using machine learning. Stat Med. 2010;29(3):337–46. doi: 10.1002/sim.3782. [DOI] [PMC free article] [PubMed] [Google Scholar]
- 35.Liaw a, Wiener M. Classification and Regression by randomForest. R news. 2002;2(December):18–22. [Google Scholar]
- 36.Strobl C, Malley J, Tutz G. An introduction to recursive partitioning: rationale, application, and characteristics of classification and regression trees, bagging, and random forests. Psychol Methods. 2009;14(4):323–48. doi: 10.1037/a0016973. [DOI] [PMC free article] [PubMed] [Google Scholar]
- 37.Anaissi A, Kennedy PJ, Goyal M, Catchpoole DR. A balanced iterative random forest for gene selection from microarray data. BMC Bioinformatics. 2013;14:261. doi: 10.1186/1471-2105-14-261. [DOI] [PMC free article] [PubMed] [Google Scholar]
- 38.Chen C, Liaw A, Breiman L. Using Random Forest to Learn Imbalanced Data. 2007 [Google Scholar]
- 39.Rubin DB. Multiple Imputation for Nonresponse in Surveys. New York: John Wiley & Sons Inc; 1987. [Google Scholar]
- 40.Higgins JPT, Thompson SG, Deeks JJ, Altman DG. Measuring inconsistency in meta-analyses. BMJ Br Med J. 2003;327(7414):557–60. doi: 10.1136/bmj.327.7414.557. [DOI] [PMC free article] [PubMed] [Google Scholar]
- 41.Harris RJ, Bradburn MJ, Deeks JJ, Altman DG, Harbord RM, Sterne JaC. Metan: Fixed- and random-effects meta-analysis. Stata J. 2008;8(1):3–28. [Google Scholar]
- 42.Burlew K, Larios S, Suarez-Morales L, Holmes B, Venner K, Chavez R. Increasing ethnic minority participation in substance abuse clinical trials: lessons learned in the National Institute on Drug Abuse's Clinical Trials Network. Cult Divers Ethn Minor Psychol. 2011;17(4):345–56. doi: 10.1037/a0025668. [DOI] [PMC free article] [PubMed] [Google Scholar]
- 43.Cohen J. Statistical power analysis for the behavioral sciences. 2nd. Hillsdale, NJ: Lawrence Erlbaum Associates; 1988. [Google Scholar]
- 44.Moradveisi L, Huibers M, Renner F, Arntz A. The influence of patients' preference/attitude towards psychotherapy and antidepressant medication on the treatment of major depressive disorder. J Behav Ther Exp Psychiatry. 2014;45(1):170–7. doi: 10.1016/j.jbtep.2013.10.003. [DOI] [PubMed] [Google Scholar]
- 45.Miech RA, Chilcoat H, Harder VS. The increase in the association of education and cocaine use over the 1980s and 1990s: evidence for a “historical period” effect. Drug Alcohol Depend. 2005;79(3):311–20. doi: 10.1016/j.drugalcdep.2005.01.022. [DOI] [PubMed] [Google Scholar]
- 46.Williams CT, Latkin CA. Neighborhood socioeconomic status, personal network attributes, and use of heroin and cocaine. Am J Prev Med. 2007;32(6 Suppl):S203–10. doi: 10.1016/j.amepre.2007.02.006. [DOI] [PMC free article] [PubMed] [Google Scholar]
- 47.Kern HL, Stuart EA, Hill J, Green DP. Assessing methods for generalizing experimental impact estimates to target populations. J Res Educ Eff. doi: 10.1080/19345747.2015.1060282. [DOI] [PMC free article] [PubMed] [Google Scholar]
- 48.Rabkin JG, McElhiney M, Ferrando SJ, Van Gorp W, Lin SH. Predictors of employment of men with HIV/AIDS: a longitudinal study. Psychosom Med. 2004;66(1):72–8. doi: 10.1097/01.psy.0000108083.43147.6d. [DOI] [PubMed] [Google Scholar]
- 49.Hudson CG. Socioeconomic status and mental illness: tests of the social causation and selection hypotheses. Am J Orthopsychiatry. 2005;75(1):3–18. doi: 10.1037/0002-9432.75.1.3. [DOI] [PubMed] [Google Scholar]
- 50.Friedberg JP, Lipsitz SR, Natarajan S. Challenges and recommendations for blinding in behavioral interventions illustrated using a case study of a behavioral intervention to lower blood pressure. Patient Educ Couns. 2010;78(1):5–11. doi: 10.1016/j.pec.2009.04.009. [DOI] [PubMed] [Google Scholar]
- 51.de Graaf R, Bijl RV, Smit F, Vollebergh WA, Spijker J. Risk factors for 12-month comorbidity of mood, anxiety, and substance use disorders: findings from the Netherlands Mental Health Survey and Incidence Study. Am J Psychiatry. 2002;159(4):620–9. doi: 10.1176/appi.ajp.159.4.620. [DOI] [PubMed] [Google Scholar]
- 52.National Cancer Institute. An Overview of NCI's National Clinical Trials Network [Internet] Available from: http://www.cancer.gov/research/areas/clinical-trials/nctn.
- 53.Wang PS, Ulbricht CM, Schoenbaum M. Improving mental health treatments through comparative effectiveness research. Heal Aff. 2009;28(3):783–91. doi: 10.1377/hlthaff.28.3.783. [DOI] [PubMed] [Google Scholar]
Associated Data
This section collects any data citations, data availability statements, or supplementary materials included in this article.