Abstract
We investigated how neural activity in the middle temporal area of the macaque monkey changes after three seconds of exposure to a visual stimulus and used this to gain insight into the assumptions underlying the fMRI adaptation method (fMRIa). We studied both changes in tuning curves following weak and strong motion stimuli (adaptation) and the differences between a first and second exposure to the same stimulus (repetition suppression). Typically, tuning curves had smaller amplitudes and narrower tuning widths after strong adaptation; this was true for single neurons, multi-unit activity, the evoked local field potential (LFP), as well as gamma band activity. Repetition typically led to reduced responses. This reduction was correlated with direction selectivity and not explained by neural fatigue.
Our data, however, warn against a simplistic view of the consequences of adaptation. First, a considerable fraction of neurons and sites showed response enhancements after adaptation, especially when probed with a stimulus that moved opposite to the direction of the adapting stimulus. Second, adaptation was stimulus selective only on a time scale of ~100 ms. Third, aggregate measures of neural activity (multi-unit activity, local field potentials) had substantially different adaptation effects. Fourth, there were qualitative differences between our findings in MT and earlier findings in IT cortex.
We conclude that selective adaptation effects in fMRIa are relatively easy to miss even when they exist (for instance by presenting stimuli for too long, or because neurons that enhance after adaptation cancel out the effect of neurons that suppress). Moreover, we argue that adaptation should be understood in the context of the computations that a neural circuit perform. Using fMRIa as a tool to uncover neural selectivity requires a better understanding of this circuitry and its consequences for adaptation.
Keywords: Motion, Adaptation, Local Field Potentials, Repetition Suppression, fMRIa, gamma band activity, multiunit activity
1. Introduction
The promise of fMRI adaptation (fMRIa) is that by comparing the response to repeated presentations of the same or different stimuli, one can infer functional characteristics of neural populations (Grill-Spector & Malach, 2001). Given the wide usage of fMRIa, it is important that the assumptions underlying these inferences are well understood and supported by experimental evidence.
The main premise of fMRIa is that in a population of neurons that is sensitive to a stimulus, its repeated presentation evokes a lesser response than its first presentation (i.e., repetition suppression). Early electrophysiological studies provided substantial experimental evidence to support this premise and have led to three (not mutually exclusive) models: fatigue, sharpening, and facilitation. We summarize those models here briefly. More detailed descriptions, including reviews of supporting and conflicting evidence are available (Grill-Spector, Henson, & Martin, 2006; Hegde, 2009; Krekelberg, Boynton, & Vanwezel, 2006).
In the fatigue model, neurons that respond vigorously to a stimulus fatigue and this causes their subsequent response to be suppressed. This suppression can be stimulus specific (some stimuli are suppressed more) or stimulus unspecific (all subsequent stimuli are suppressed equally). In the sharpening model, neurons maintain their (peak) firing rate, but they respond to fewer stimuli (i.e., they sharpen their tuning curve). Across a population of neurons with a wide range of stimulus preferences, such as might be contained in a single fMRI voxel, this would also result in a reduced response to repeated stimuli (repetition suppression), because fewer neurons respond to the repeated stimulus. In the facilitation model, repeated stimuli are processed faster. Because the BOLD signal relies on the total neural activity on a time scale of a few seconds, stimuli that lead to shorter burst of neural activity also generate less signal (i.e. repetition suppression).
We test these models using electrophysiological, intracranial recordings from the middle temporal area of the macaque monkey. Unlike previous work in this area that focused on the functional benefits and behavioral consequences of adaptation in these neurons (A. Kohn & Movshon, 2003, 2004; Krekelberg, van Wezel, & Albright, 2006; Priebe, Churchland, & Lisberger, 2002; Priebe & Lisberger, 2002), here we are mainly interested in using our intracranial recordings in animals to aid the interpretation of noninvasive recordings (such as fMRI, and electroencephalography) that can be obtained in humans. For this reason, we studied not only single neuron activity, but also multi-unit activity, evoked local field potentials, and gamma band signals related to the synchronous activation of large populations of neurons.
2. Materials and Methods
Two adult male rhesus monkeys (Macaca mulatta) participated in these experiments. Experimental and surgical protocols were approved by the Rutgers University Animal Care and Use Committee and complied with guidelines for the humane care and use of laboratory animals of the National Institutes of Health.
2.1. Surgical and recording procedures
All surgical procedures were conducted under sterile conditions using isoflurane anesthesia. Titanium head posts (Gray Matter Research) were attached to the skull using titanium bone screws. Custom made high-density polyethylene recording chambers were implanted normally to the skull, and dorsal to the expected location of MT.
At the beginning of each recording session, we accessed the cortex by puncturing the dura with a sharp, metal guide tube. The guide tube or one of the head screws served as the reference for the electrode signal. We used a micro-positioner (NAN Instruments, Nazareth, Israel) to lower parylene coated tungsten electrodes (~0.5–1.5 MΩ; FHC Inc., Bowdoin, ME) into the brain through the guide tube. The raw signal was sampled at 25 kHz and stored for offline analysis using Alpha Lab (Alpha-Omega Engineering, Nazareth, Israel). Eye position was recorded using an infrared eye tracker (Eyelink 2000; SR Research).
While lowering the electrode we listened for direction selective responses to a circular pathway stimulus (Krekelberg, 2008). This allowed us to rapidly position the electrode in area MT. We confirmed recording locations in area MT using structural magnetic resonance images obtained after implantation, and physiological criteria such as the high prevalence of direction selective responses, and the relatively small receptive fields (compared to the neighboring medial superior temporal area). These data were used online to ensure visual fixation, and stored for offline analysis (Hartmann, Bremmer, Albright, & Krekelberg, 2011).
2.2. Visual Stimuli
Visual stimulus generation was under the control of our in house software for visual experimentation: Neurostim (http://neurostim.sourceforge.net). Stimuli were presented on a CRT monitor (Sony GDM-520) spanning 30° × 40° at a resolution of 1024 × 768 pixels and a vertical refresh rate of 150 Hz.
All stimuli in the main experiment consisted of 700 anti-aliased dots (30 cd/m2, effective, anti-aliased diameter 1.5 pixels) on a 4 cd/m2 background, moving within a 5° radius circular aperture. In the random motion stimulus each dot moved in a randomly chosen direction, while all dots in the coherent motion stimulus moved in the same direction.
2.3. Experimental Paradigm
In each experiment, the monkey started a trial by bringing its gaze within an invisible 2° × 2° window surrounding a small red dot at the center of the screen. When eye position deviated outside this window, the trial was aborted and the data were not used in the analysis. At the end of the trial, the monkey was rewarded with apple juice for maintaining fixation throughout the trial.
In each recording session, we ran two preliminary mapping experiments to guide stimulus location and motion direction of the main experiment. First, we determined the preferred direction of the neuron using a full screen pattern of dots that moved along a circular path resulting in a uniform translational velocity (Krekelberg, 2008). Second, we determined the spatial receptive field using localized motion pulses in the preferred-direction in a matrix of 4×3 patches covering the screen (Krekelberg & Albright, 2005). In subsequent experiments, the stimuli were centered on the patch that elicited the maximum mean response.
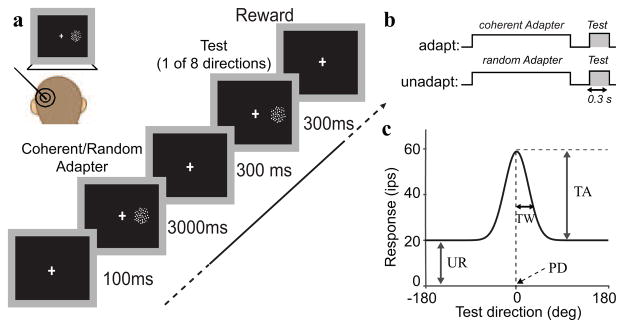
In the main experiment we used a 2×8 factorial design to measure the influence of an adapter (coherent or random motion; first factor) on the subsequent neural response to coherent motion in one of eight evenly spaced directions spanning the circle (second factor). The direction of motion for the coherent adapter was matched to a coarse estimate of the preferred direction of the neuron (see above). Each trial used the same stimulus sequence: a 3 s adapter stimulus followed by a 300 ms blank period in which only the fixation dot was visible, and then a 300 ms test stimulus (See Figure 1).
2.4. Data Analysis
2.4.1. Neural Activity Measures
We extracted three measures of neural activity from the raw potentials measured at the electrode tip. First, to extract single unit activity (SUA) we band-pass filtered the raw signal between 300 Hz and 6 KHz, applied a threshold equal to 4 standard deviations of the filtered signal to extract candidate spike wave forms and then used KlustaKwik (Harris, Henze, Csicsvari, Hirase, & Buzsaki, 2000) to cluster these waveforms into separate, well-isolated units (up to three units per recording depth). Second, we estimated the multi-unit activity envelope (MUAE). After band-pass filtering the raw signal between 700 and 5000 Hz to isolate spiking related activity, we applied full-wave rectification to include spikes with negative and positive potential deflections and then low-pass filtered with a cut-off at 500 Hz and resampled at 1 kHz to obtain a continuous estimate of average multi-unit spiking activity (Super & Roelfsema, 2005). For Figure 5, the MUAE for each site was normalized by dividing the raw MUAE value by the maximum MUAE value measured at that site. Third, we extracted the local field potential (LFP) from the raw signal by band-pass filtering between 1 and 120 Hz and sampling at 781.25 Hz. From this raw LFP we extracted further derivative measures such as the overall LFP power, or the power in certain temporal frequency bands (See Spectral Analysis).
2.4.2. Direction Selectivity and Repetition
To quantify direction selectivity, we first calculated the circular variance of the tuning curve (measured in the weakly adapted state) and then defined the direction selectivity index DSI as 1-variance. Higher DSI values correspond to more pronounced direction selectivity.
We defined the repetition suppression index (RSI) as the Michelson contrast (C−T)/(C+T) between the response in the first 300 ms following the coherent adapter (C) and the mean response to the test stimuli moving in the direction that matched the coherent adapter within 22.5 degrees (T). Positive RSIs correspond to suppression.
2.4.3. Temporal Response Properties
Estimating the total duration of a response is complicated by the fact that single unit responses typically outlast stimulus presentation. As a proxy for response duration, we therefore determined the center-of-mass of the response by defining post-stimulus bins (t⃗ the center of each bin between 0 and 300 ms in steps of 15 ms), and the mean response in each bin (r⃗), and then calculating the centroid c = r⃗ * t⃗/|r⃗|, where |r⃗| represents the sum of all responses.
2.4.4. Tuning Curves
Our primary interest was to determine how adaptation affected direction tuned responses. To estimate tuning curves, we averaged the neural activity measures (SUA, MUA, or gamma band activity; see below) during the 300 ms test interval and used a resampling based Bayesian method (Cronin, Stevenson, Sur, & Kording, 2010) to fit a circular Gaussian tuning curve (Figure 2). This procedure provided an estimate of the tuning amplitude (TA), tuning width (TW), the un-tuned response (UR), and preferred direction (PD). UR is the part of the response that does not vary with the direction of the test stimulus; conceptually the sum of the spontaneous, not visually-driven response, and the neuron’s response to any visual motion pattern. This method also provides estimates of the confidence limits of the parameters, and we used those estimates to assess statistical significance at the single unit (or single site) level.
When comparing the different adaptation conditions, coherent (strong) vs. random (weak), we restricted the data set to those neurons (SUA analyses) or sites (MUAE, LFP, gamma band analyses) with significant direction tuning.
2.4.5. Evoked LFP
For the average evoked LFP (Figure 7) we averaged across all recording sites. We observed two negative peaks, N1 (40–70 ms) and N2 (80–120ms) in the evoked potential and performed Wilcoxon signed rank tests to compare the mean signal in these bands across conditions.
2.4.6. Spectral analysis
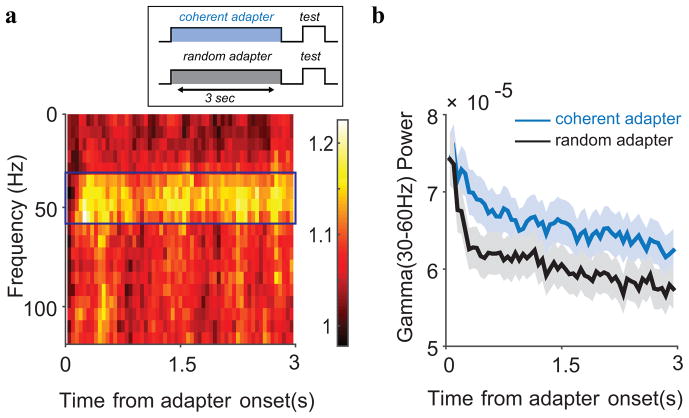
Multi-taper spectrograms in the range 1–120 Hz were estimated using used the Chronux software package (http://www.chronux.org) using two tapers, a window of 300 ms, and a time bandwidth product of 1. For Figure 9a, we first calculated the spectrograms during the presentation of the coherent adapter and random adapter, respectively for each recording site. We then calculated the ratio of these two spectrograms per site, averaged them across all sites and plotted the result in Figure 9a.
2.4.7. Statistics
The statistical significance of changes in tuning curve parameters at the single neuron or single site level was assessed using the confidence limits generated by the Bayesian estimation method (see above). We used standard parametric statistics (e.g. (paired) t-tests, analysis of variance) except when the sample size was small or a test of normality failed. In those cases we used a non-parametric alternative (e.g. Wilcoxon signed rank test). Some of our measures of correlation (e.g. RSI with the response during adaptation) relate two measures that are necessarily dependent. For such measures we repeatedly shuffled the (trial) labels and calculated the resulting null distribution of correlations. A measured correlation was considered significant if it was significantly larger than the 95th percentile of the null distribution.
3. Results
Neurons in the middle temporal area have a high degree of selectivity for the direction of visual motion and, like most sensory neurons (A Kohn, 2007), they adapt to the prolonged exposure of a visual stimulus. These two properties make them highly suitable to investigate the assumed relationship between stimulus selectivity and adaptation that underlies methods like fMRIa. We first present illustrative examples of changes at the single neuron level, but because our main focus here is to use intracortical electrophysiology to better understand the basis of fMRIa, we then turn to three measures of population activity (multi-unit activity envelope, visually evoked local field potentials, and gamma band activity).
We recorded at a total of 76 sites in area MT of monkeys’ N and M (N: 59, M: 17): each of these sites contributed to the multi-unit activity (MUA) and local field potential (LFP) analyses. From these recordings, we also isolated 107 single neurons (N: 84, M: 23) that contributed to the single unit activity (SUA) analyses.
In our experimental paradigm we induced different levels of adaptation and then measured the direction tuning of the neural response (Figure 1c). Specifically, in the first condition, adaptation was induced by exposing the neurons to a pattern of coherently moving dots. In the second condition, the neurons were exposed to a dot pattern in which each dot moved in a randomly chosen direction. The latter pattern generally induces weaker responses and adaptation in MT neurons than coherent motion patterns (Van Wezel & Britten, 2002), and we will refer to it as inducing a weakly adapted state. After the 3 s induction phase, we recorded the response to 300 ms of coherent motion in one of eight directions to map out the direction tuning curve (test phase).
Figure 1.
Experimental setup and procedure. (a) Experimental paradigm. On each trial a dot pattern (random or coherent motion) was presented for 3 s followed by a blank period of 300 ms, and then a 300 ms coherent dot pattern (moving in one of eight evenly spaced directions). Monkeys fixated a dot at the center of the monitor throughout the trial. (b) Paradigm schematic. The shaded regions mark the periods during which the tuning curve for the ‘adapt’ and ‘unadapt’ conditions were estimated. (c) Tuning curve definition. Each tuning curve was described with 4 parameter: the untuned response (UR), the tuning amplitude (TA), tuning width (TW), and the preferred direction (PD).
This experimental design allows three qualitatively different comparisons of neural activity that capture different aspects of adaptation. First, comparing neural activity in the induction phase (‘coherent’ vs. ‘random’) provides insight into the dynamics of adaptation and its dependence on the stimulus and the response it generates in the neurons. These adaptation induction analyses, however, include adaptation that is not specific to direction selective neurons. The second set of analyses controls for this: by comparing neural activity in the test phase (‘strongly adapted’ vs. ‘weakly adapted’), we subtract the component of adaptation that is the same for coherent and random motion patterns (e.g. contrast adaptation that could, for instance, be inherited from V1) and isolate coherent motion specific mechanisms of adaptation. Note, however, that because the test stimuli were separated from the adapters by a 300 ms blank screen, this analysis only captures the consequences of adaptation that last at least 300 ms, whereas the first analysis can also include shorter-lived effects. Third, by comparing the first 300 ms of the response to the coherent adapter and the response to test stimuli that moved in the same direction (within 22.5 degrees), we assess the influence of stimulus repetition most directly. We will refer to the latter comparisons as repetition suppression analyses. In the figures we use cartoons of the design to clarify which of three comparisons was used for a particular analysis.
3.1. Single Unit Activity
3.1.1. Tuning Curve Changes
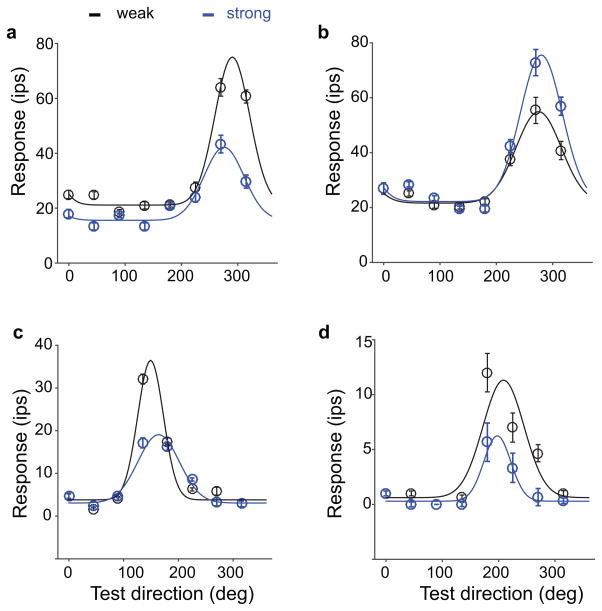
Figure 2 shows the motion tuning analysis for four example neurons. Panel a shows a single unit with a response amplitude that was significantly weaker after adaptation to coherent motion than after adaptation to random motion. Figure 2b shows the opposite behavior; the tuning curve amplitude was increased after adaptation to coherent motion compared to random motion. Panels c and d illustrate adaptation-induced changes in tuning widths. The tuning curve in panel c becomes broader; the tuning curve in panel d becomes sharper after adaptation to coherent compared to random motion.
Figure 2.
Direction-selective adaptation induced changes in single neuron tuning curves. Each panel shows the tuning curve for a single neuron after strong and weak adaptation. Error bars reflect the standard error in the mean, solid curves show the best fitting tuning curve. (a) A single unit that showed a clear peak decrease after strong adaptation. (b) Example of a peak increase. (c) A single unit in which strong adaptation led to a broadening of the tuning curve. (d) A single unit in which strong adaptation led to a narrowing of the tuning curve. This figure shows that, across the sample of neurons, there was considerable variability in the tuning curve changes.
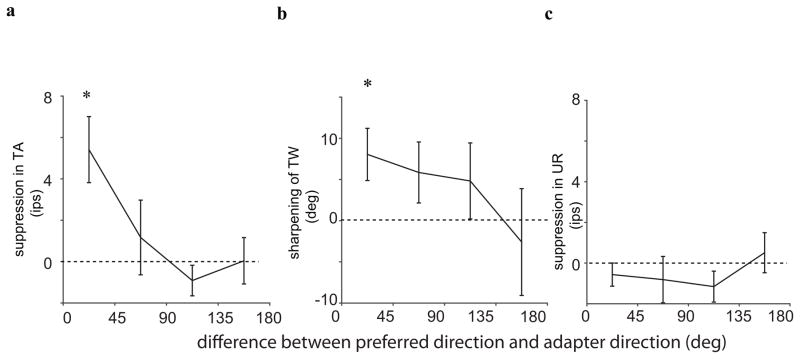
The difference between the tuning curves in Figure 2 shows that random motion and coherent motion led to different states of adaptation in the same neurons. We gain further insight into this stimulus selectivity by dividing the neurons in four groups based on the difference between the direction of the adapter and the preferred direction of the neuron. For each group we then determined the average change in tuning amplitude (Figure 3a), tuning width (Figure 3b), and the untuned response (UR; see Figure 1c for a definition).
Figure 3.
Average direction-selective adaptation-induced changes. (a) Average change in tuning amplitude with adaptation. On average, TA was suppressed by adaptation, and this effect was largest when the adapter moved in the (near) preferred direction. (b) Average change in tuning width with adaptation. On average, TW were sharper after adaptation. This effect was also largest for adapters near the preferred direction. ((c) Average adaptation-induced changes in untuned responses. On average, there was no significant change in the untuned response.
For adapter directions near the preferred direction, adaptation predominantly led to suppression and sharpening (panels a, and b). For adapter directions opposite the preferred direction, the mean effect was zero. Adaptation did not change the untuned response significantly (p>0.05) for any adapter direction (panel c). Together, these analyses confirm the stimulus selective nature of adaptation, with stronger suppression and more sharpening following exposure to the preferred stimulus. One additional change not shown in the figure is that adapter directions on the flank of the tuning led to attractive shifts in preferred direction (i.e., the preferred direction after adaptation was closer to the adapter (paired t-test; t(25) = 2.25, p=0.03), while adaptation near the preferred (t(53)=0.52; p = 0.59) or anti-preferred (t(14)=0.52; p =0.6) direction, did not change the preferred direction.
3.1.2. Repetition Suppression
To quantify the more general consequences of adaptation, including the effects that are not specific to coherent motion, we now turn to the repetition suppression analysis, which focuses on those trials in which the adapter and test stimulus moved in the same direction (within 22.5 degrees). Overall, repetition led to 7.1 ± 2.5 % suppression as quantified by the RSI (the fractional change in firing rate for a repeated stimulus, see Methods). This value was significantly larger than zero (t-test; p<0.001). We also analyzed the RSI separately using the same grouping of neurons as in Figure 3. This showed that the RSI decreased with distance between the adapter and the preferred direction (ANOVA; p<0.01) and only the group of neurons adapted near their preferred direction had significant suppression (RSI = 11 ± 4 %, p<0.01).
The different adapters did not necessarily generate the same firing rate, hence some of the differences we found could have been due to different levels of fatigue. We investigated the role of fatigue two ways. First, we looked at trial-by-trial variation of repetition suppression. If fatigue played an important role, one would expect trials with a high firing rate to result in more repetition suppression. The fatigue model predicts a positive correlation between the RSI in a trial and the mean response to the adapter in that same trial. In our sample, however, these correlations were not significantly more positive than expected by chance (p>0.5). (Note that this correlation was also not significant when comparing the raw instead of the fractional change in firing rate (p>0.5)). Second, we asked whether neurons with a high firing rate had more repetition suppression on average (by calculating the Spearman correlation across sites of the mean RSI and the mean response to the adapter). This correlation was also not significantly different from chance (r =−0.05, p>0.5).
Finally, we investigated whether repetition suppression was a good indicator of a neuron’s selectivity. We found a moderate, but statistically significant correlation between neurons’ direction selectivity index (DSI; see Methods) and RSI (Spearman correlation; r = 0.27; p<0.001). This shows that highly direction selective neurons displayed more repetition suppression, and hence the amount of repetition suppression was informative about the direction selectivity of the neurons.
3.1.3. Facilitation
Under the facilitation hypothesis of repetition suppression, adapted responses are shorter in duration (Grill-Spector et al., 2006). This leads to the prediction that the center of mass of the post-test stimulus response histogram (see Methods) shifts to earlier times after strong adaptation. Our data, however, do not support this view; the mean center of mass was not significantly different in the strongly and weakly adapted conditions (paired t-test; p>0.3)
3.2. Multi-Unit Activity
We used the multi-unit activity envelope (MUAE) to investigate adaptation in the spiking responses averaged over a large number of neurons in the vicinity of the electrode (Super & Roelfsema, 2005). At 51 out of 76 recorded sites, the MUAE was significantly tuned for direction (Rayleigh test: p<0.05).
3.2.1. Tuning Curve Changes
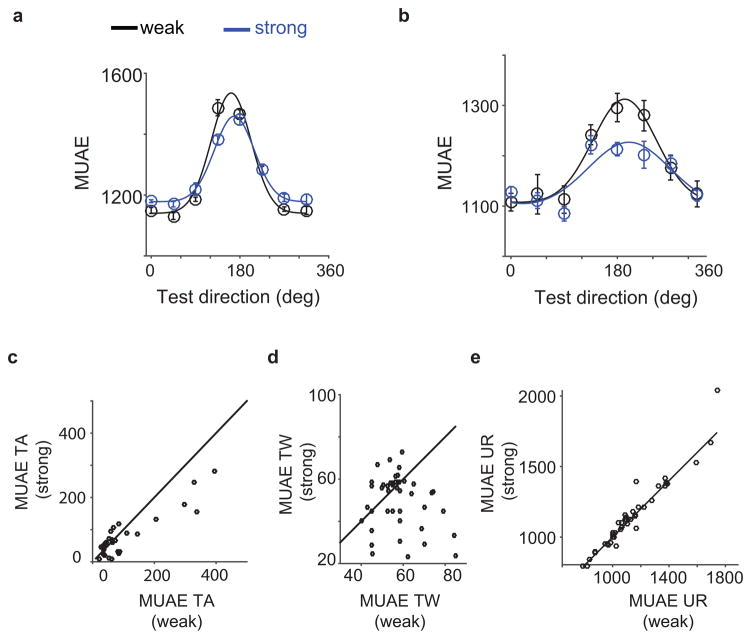
Figure 4a, and b show the strongly and weakly adapted MUAE tuning curve at two recording sites. After strong adaptation, the MUAE tuning amplitudes were suppressed, and the tuning curves modestly sharper than after weak adaptation. The scatter plots in Figure 4c-e show that -across sites- amplitude suppression was the norm (paired T-test, p<0.05), the tuning curve typically became sharper (paired T-test, p<0.05; ), and the untuned response stayed relatively constant (paired T-test, p>0.5). Even though suppression and sharpening was the norm, there were exceptions to this rule, with 6 sites showing individually significant enhancement and 1 showing significant broadening.
Figure 4.
Direction-selective adaptation induced changes in multiunit activity envelope (MUAE) tuning curve. (a) and (b) Strongly and weakly adapted tuning curves for two example sites. These two examples show a tuning peak decrease after adaptation. (c) Site-by-site comparison of TA. (d) Site-by-site comparison of TW. (d) Site-by-site comparison of UR. This figure shows that – although there are clear exceptions – the dominant/average effect of adaptation was to suppress MUAE tuning amplitude, and to make tuning widths narrower.
3.2.2. Repetition Suppression
Across all sites, the average suppression after repetition was not significantly different from zero (p>0.8), and even for sites where the preferred stimulus was repeated, suppression was only marginally larger than zero (RSI = 0.6 ± 0.4%, p=0.09). The RSI at sites adapted in other directions was not significantly different from zero (p>0.5). Trials or sites with high MUAE did not have higher RSIs (p>0.1), hence fatigue did not account for the (limited) repetition suppression in these data. Repetition suppression was marginally, but positively correlated with direction selectivity (r=0.2, p=0.07).
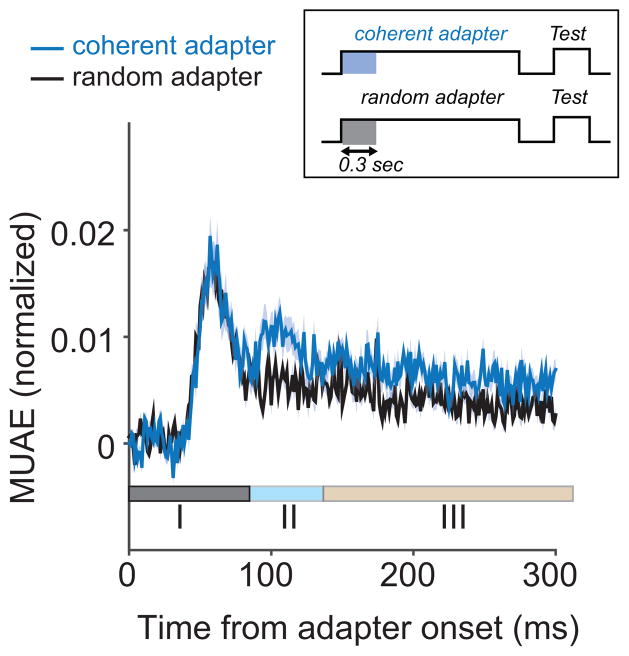
3.2.3. Adaptation Time Course
To quantify the adaptation time course, we first compared the MUAE response to the coherent motion pattern with the response to the random motion pattern (i.e., the two responses during the induction phase). Figure 5 shows the response averaged across all tuned (n= 51) sites. Based qualitatively on this mean MUAE response plot, we distinguish three phases. In the initial phase, the response was most vigorous, but the same for both input patterns. This phase lasted until ~80 ms post stimulus onset.
Figure 5.
Time course of MUAE adaptation. MUAE response to the coherent and random motion adapter averaged across all sites. Based on this curve, we distingtuish three phases; a stimulus independent response phase (I), a phase with stimulus dependent responses and stimulus dependent response changes (II), and a phase with a stimulus dependent response, but a stimulus independent response change.
After this rapid, direction-independent transient phase, the response became direction selective; a greater response to the coherent pattern than the random pattern (phase II: 80 ms to 140 ms). Over the latter half of this phase, the difference between the response to the coherent and random pattern declined towards a steady value. We quantified this by determining the slope of the MUAE decline. This slope was more negative for coherent patterns than for random patterns (paired t-test; t(51) = 2.42; p=0.01). In other words, the response to coherent patterns was suppressed more during this phase than the response to random patterns. Also, the slope of the MUAE decline was negatively correlated (r(51) = −0.42 p =0.0019) with the mean value of the MUAE in the same interval. This shows that there was more suppression for sites with larger MUAE.
In phase III (more than 120 ms post stimulus onset), both input patterns resulted in a MUAE response that steadily decreased over time. This decrease was approximately the same for the two patterns (i.e. there was no significant difference between the slopes for coherent and random motion in the period from 1 to 3 s after stimulus onset (pairwise T-test; p>0.5). Somewhat surprisingly, the slope in this phase also did not depend on the overall MUAE (no correlation between slope and mean MUAE: r=0.005; p>0.5). This shows that the adaptation in phase III was relatively independent of the stimulus as well as the ongoing activity.
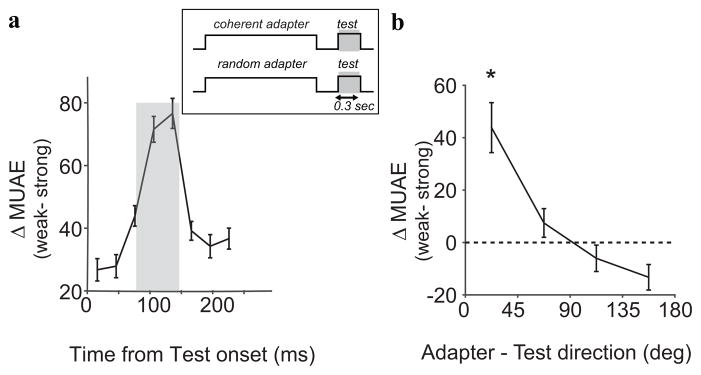
A similar picture emerges from looking at the time course of the test response. Specifically, we compared MUAE responses to test stimulus moving in the preferred direction following strong or weak adaptation. Figure 6a shows the difference in response, averaged across the tuned (n=51) sites. Here too the average effect is one of suppression (positive numbers indicate a lower response after adaption), and the suppression peaked briefly after the onset of the test stimulus (similar to phase II above). Figure 6b shows the relationship between direction-selective suppression and the choice of the test stimulus. Stimuli near the adapter direction resulted in the largest suppression (paired t-test; p = 0.002) and the suppression decreased as the mismatch between test and adapter direction increased. Nominally, test stimuli moving opposite to the adapter direction showed an enhanced response after adaptation (although, statistically, the enhancement was only a trend; paired t-test; p= 0.06).
Figure 6.
Direction selective MUAE adaptation. (a) Difference between the MUAE to the preferred stimulus in the weakly and strongly adapted state. Averaged over all sites, the largest differences occured in phase II (80–140 ms; shaded region). (b) Tuning. Change in MUAE as a function of the dfference between the coherent adaptation direction and the test direction. MUAE reduced significanctly (*) for test directions near the adaptation and was enhanced (non-significantly) for test directions opposite the adapter.
3.3. Evoked Potentials
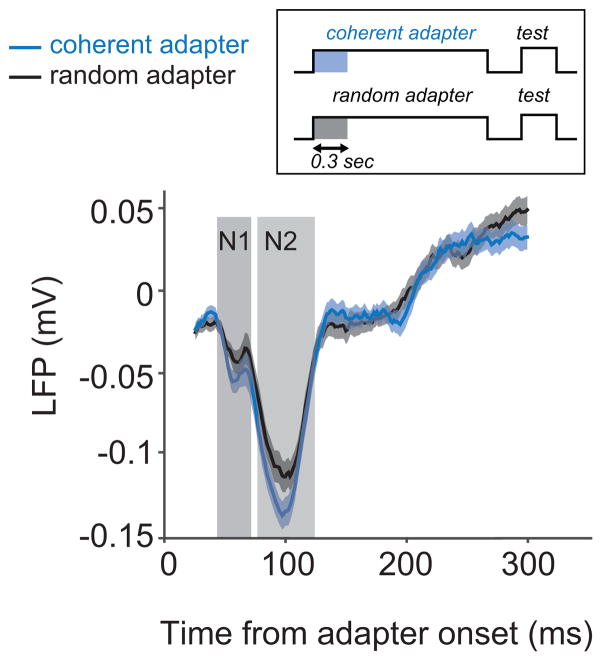
As a second measure of population activity we studied the evoked local field potentials. Figure 7 shows the average potential evoked by the coherent and random motion patterns. Significant differences (reflecting direction selective processing) were present in the first (N1) and second (N2) negativity. After the N2, the potentials slowly reverted back to zero, but this decline was independent of the stimulus (no significant difference between the slopes of the coherent and random pattern response; paired t-test; p 0.49).
Figure 7.
Visually evoked responses. The LFP evoked by a coherent and a random motion pattern (averaged over all sites). Differences were most pronounced in the first (N1) and second (N2) negativities; later response components did not differ significantly. Shading reflects one standard error in the mean.
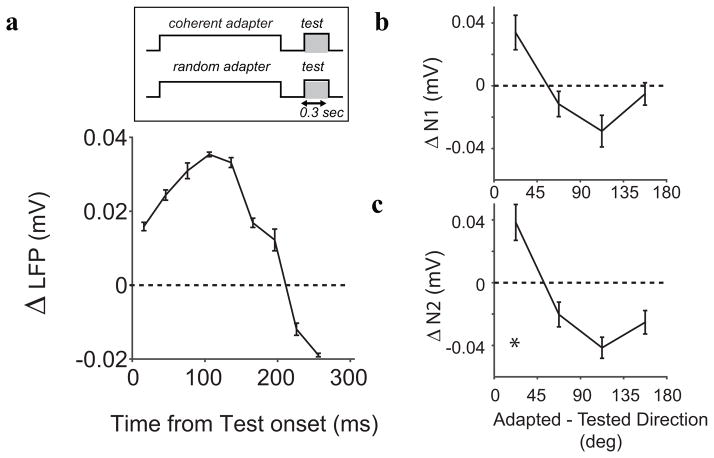
Analogous to the analysis of MUAE, we studied the direction selective component of evoked potential adaptation by subtracting the evoked potential following the strongly adapted test stimulus from the evoked potential following the weakly adapted test stimulus. Figure 8a shows the time course of this difference. On average, LFPs following strongly adapted test stimuli were more suppressed with a peak around 100 ms after test stimulus onset. Next, we investigated the dependence of adaptation on the test direction. Figure 8b and c, show that both the N1 (average suppression 0.033 mV; p=0.06) and the N2 (average suppression 0.036 mV; p=0.014) components were most suppressed for test directions close to the adapter direction. The nominal enhancement in response to test directions opposite the adapter direction was not statistically significant (N1: 0.005 mV; p = 0.39, N2: 0.02 mV; p = 0.11).
Figure 8.
Direction selective adaptation of visually evoked responses. (a) The difference between the response evoked by a site’s preferred test stimulus, in the strongly and weakly adapted state (averaged over all sites). Maxmal suppression occurred ~ 100 ms post stimulus onset. Directional tuning of N1 (b) and N2 (c) adaptation; suppression was maximal for directions close to the adapter direction and facilitaton was observed for test directions opposite to the adapter.
3.3.1. Repetition Suppression
The RSI for both the N1 and N2 were significantly larger than zero (N1: 28 ± 3%, p<0.01; N2:16 ±3 % p<0.01), but suppression did not significantly correlate with the direction selectivity of each site (p>0.1). The influence of the adapter direction was marginally significant for N1 (p=0.052) but not significant for N2 (p>0.2). Trials or sites with large N1 or N2 did not have significantly higher RSIs (p>0.1).
3.4. Gamma Band Activity
As a third measure of neural population activity, we considered the spectral power of the local field potentials; this is thought to reflect the synchronous activity of large populations of neurons near the electrode.
We first calculated spectrograms of the LFP in the induction phase (see Methods). Figure 9a shows the ratio of the power evoked by the coherent pattern and the random pattern, averaged over all sites. The pronounced horizontal band shows that coherent motion led to increased power in the frequency band between 30 and 60 Hz. We will refer to this band as the gamma band. The activity in this band was not only larger for coherent motion, it was also significantly tuned for the direction of motion (not shown; individually significant in 42 out of 76 sites, Rayleigh test p<0.05). Other frequency bands did not have significant direction tuning hence we focus exclusively on this gamma band here.
Figure 9.
Gamma band adaptation. (a) Ratio of the power following coherent and random motion (averaged across sites). A narrow band between 30 and 60 Hz showed a sustained, stronger response to coherent than to random motion patterns. (b) Gamma band power over time, averaged over all sites. Gamma band power was gradually suppressed over a period of seconds. On the time scale of seconds, the suppression (slope) did not depend on the stimulus or on the mean gamma band activity at that site.
Figure 9b shows the time course of the power in this gamma band. Both the coherent and random motion patterns evoked a strong initial transient followed by a weaker sustained gamma band response. Both stimuli induced gamma-adaptation: after the initial transient response, the gamma band response decayed almost linearly with time over the 3 seconds that the stimulus was on the screen. Please note that the initial transient from baseline is absent in Figure 9b because we divided the response into 100 ms time bins to allow the estimation of power at low frequencies. In other words, the first time bin includes the stimulus evoked component (~30–60 ms), which already shows the effects of adaptation. This behavior matched phase III of the MUAE and here too, adaptation on a time scale of seconds was independent of the motion content of the stimulus (same slope for coherent and random patterns), and independent of the mean gamma band activity (no correlation between slope and mean gamma band activity).
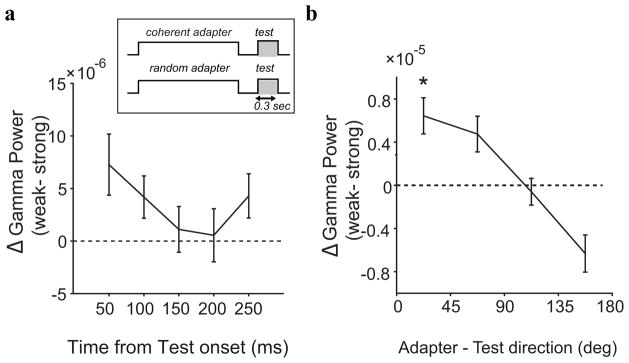
We used the gamma band responses to the test stimuli to isolate the direction specific components of gamma band adaptation. Figure 10a shows the difference in gamma band activity to test stimuli moving in the preferred direction after strong and weak adaptation. The largest differences were again observed early after stimulus onset. The baseline power (i.e., before stimulus onset), however, did not differ significantly (paired t-test, p = 0.4879). (Note again that the initial transient from the baseline is absent in the plot, because the evoked component (30–60 ms) is included in the first data point.) Figure 10b shows the influence of the test direction; the largest suppression was found for test stimuli close to the adapter direction (Wilcoxon paired signed rank test; p = 0. 004), while the response to test stimuli moving in the direction opposite the adapter were enhanced (Wilcoxon paired Signed rank test; p = 0. 03).
Figure 10.
Direction selective gamma band adaptation (a) Difference in gamma band power between the weakly and strongly adapted state. The largest difference in power occurred in the initial response to the test stimulus. (b) Tuning. Gamma band power as a function of the dfference between adapter and test direction. Gamma band power significantly decreased for test directions near the adapted direction, while gamma band power increased for opposite test directions.
3.4.1. Repetition Suppression
Averaged across all sites, repetition significantly suppressed gamma band activity (RSI = 10 ±4%, p<0.01), but suppression did not correlate significantly with the direction selectivity of each site (p>0.1). The influence of the adapter direction was not significant (p>0.5). Trials with high gamma band activity did not have significantly higher RSIs (r=0.175; p>0.1), hence fatigue could not account for the repetition suppression in these data.
4. Discussion
We studied the influence of prolonged exposure to a visual stimulus on the subsequent neural responses in the middle temporal area of the macaque. Although our findings generally support the view that repetition of a stimulus leads to suppression of the response, adaptation-induced response changes are complex and, as we will argue below, more likely a reflection of circuit level computations than an intrinsic change (e.g. “fatigue”) of single neurons.
4.1. Tuning curve changes
At the scale of a V1 receptive field, the coherent and random motion adapter are almost indistinguishable. MT neurons, however, sum over larger areas of the visual field and generally respond more strongly to coherent than random motion (Van Wezel & Britten, 2002). Based on this, we interpret the differences in tuning curves after weak (random) and strong (coherent) adaptation as resulting mainly from direction-specific mechanisms in area MT. Our data therefore show that direction specific adaptation mechanisms typically led to suppressed responses, and sharpening of the tuning curves.
It is important to note, however, that the changes in tuning curves quantify differences in adaptation for coherent and random adapters, not how these adapters affect tuning curves compared to what one might call an unadapted state (e.g. after exposure to, say, a blank screen). This is an important difference with, for instance, the data obtained in IT cortex where no tuning curve sharpening or increases in selectivity have been observed when comparing adapted and unadapted states (De Baene & Vogels, 2010; McMahon & Olson, 2007). Moreover, it might explain why we found significant tuning curve amplitude reduction but no repetition suppression in the MUAE; this suggests that the random adapter led to an increased response (compared to an unadapted state), which could be a reflection of competitive interactions known to occur between stimuli moving in different directions (see below). Our paradigm, however, does not allow us to draw a firm conclusion about this aspect of adaptation.
The finding that single neuron tuning curves were typically suppressed and sharper after coherent motion adaptation is broadly consistent with previous reports of adaptation in area MT (A. Kohn & Movshon, 2003; Krekelberg, van Wezel, et al., 2006; Petersen, Baker, & Allman, 1985; Priebe & Lisberger, 2002). However, we also encountered clear examples in which adaptation led to tuning curve enhancement and broadening, in particular when a site was adapted in one direction but tested in the opposite direction. In our sample the enhancement was significant for gamma band activity, reached a trend in the MUAE, but was non-significant for evoked potentials. Enhancement and broadening have also been reported before in both V1 and MT and appear to depend critically on the size as well as other properties of the adapting stimulus (Patterson, Duijnhouwer, Wissig, Krekelberg, & Kohn, 2014; Petersen et al., 1985; Priebe & Lisberger, 2002; Wissig & Kohn, 2012). We believe this reflects the experimental fact that one can choose to record from a single neuron, but one cannot choose to adapt a single neuron. In other words, a stimulus will always adapt many neurons, and each of these can change the response properties of the neuron at the end of the electrode through local circuit interactions.
For instance, many neurons in visual areas have strong inhibitory spatial surrounds. If adaptation suppresses the output of the neurons in the surround, this would result in disinhibition of the neurons in the center and therefore post-adaptation enhancement (Wissig & Kohn, 2012). Similarly, rightward selective neurons in MT are commonly modeled as being inhibited by leftward selective MT neurons (Simoncelli & Heeger, 1998), and there is considerable evidence for more complex competitive interactions in MT neurons (Gaudio & Huang, 2012; Krekelberg & Albright, 2005; Xiao, Niu, Wiesner, & Huang, 2014). If, for instance, this inhibition falls away after adapting to leftward motion (i.e., the leftward preferring neurons undergo repetition suppression), then the rightward selective neurons could increase their response due to disinhibition. Even more dramatically, a neuron that receives balanced input from neurons with all preferred directions (i.e. it is not direction selective) could become direction selective after adaptation of its inputs (Tolias, Keliris, Smirnakis, & Logothetis). These are just some examples of how modulating the output of a subset of neurons in a recurrently connected network can have complex consequences and emphasizes that tuning is not a property of a single neuron but emerges from an interconnected network of neurons (Joukes, Hartmann, & Krekelberg, 2014; Richert, Albright, & Krekelberg, 2013).
4.2. Repetition Suppression
The repeated presentation of an almost identical stimulus, generally evoked a smaller response than the first presentation. This was the case for most measures of neural activity we investigated and often this effect was larger when the repeated stimulus was also the preferred stimulus. We tested the fatigue model by quantifying whether a larger response to the first stimulus presentation resulted in larger suppression of response following the second presentation. We found no support for this in any of the measures of neural activity, hence response fatigue cannot account for repetition suppression in MT neurons. A similar conclusion was reached for neurons in infero-temporal (IT) cortex (De Baene & Vogels, 2010; Sawamura, Orban, & Vogels, 2006). Contrary to findings in IT, however, we found that the magnitude of repetition suppression was correlated with direction selectivity for single unit activity (and marginally so for multi-unit activity). This shows that for MT neurons, unlike IT neurons, repetition suppression can indeed serve as a proxy for direction selectivity.
We believe these differences between MT and IT are important and instructive. At the single neuron, cellular level, the neurons in these areas are likely very similar, but in terms of the computations they perform they are obviously different. First of all, because time is an essential part of motion, temporal context (i.e. adaptation) is likely to play a different role in an area that computes motion than one involved in the representation of shape. Second, conceptually area MT appears to be operate at a stage of visual processing that is more involved with the extraction of features than the combination of features into invariant representations of objects (Fujita, 2002). MT’s emphasis on extraction is consistent with computational models (Adelson & Bergen, 1985; Joukes et al., 2014) and experimental data that reveal competitive interactions (Gaudio & Huang, 2012; Krekelberg & Albright, 2005; Krekelberg & van Wezel, 2013; Xiao et al., 2014), the weighing of evidence and counter-evidence (Duijnhouwer & Krekelberg, 2015), and segmentation of figure and ground (X. Huang, Albright, & Stoner, 2007; X. Huang, Albright, & Stoner, 2008). The abundance of such competitive interactions is likely to have an impact on the nature and function of adaptation.
4.3. Function of adaptation
In many studies neurons (or voxels) are viewed as passive elements that represent a certain feature. From this perspective it is a small step to viewing changes in firing rate to ongoing stimuli as “fatigue”. If instead one views a neuron as a component in a circuit that computes a complex function of its inputs (e.g. the perceived direction from a sequence of visual stimuli), then a changing response to a constant input takes on a different meaning. In area MT, for instance, such rate changes have been linked to specific functions: e.g. improved motion discrimination performance (A. Kohn & Movshon, 2004; Krekelberg, van Wezel, et al., 2006), and the representation of acceleration (Price, Ono, Mustari, & Ibbotson, 2005; Schlack, Krekelberg, & Albright, 2007; Schlack, Krekelberg, & Albright, 2008).
From this perspective there is no reason to expect that firing rates go down with prolonged exposure as this would depend on what the neuron is trying to compute. In our view, this does more justice to the complexity and ultimate function of neural circuitry. Of course such circuits also have to deal with biophysical limitations on energy consumption, or may strive for efficiency (Adibi, McDonald, Clifford, & Arabzadeh, 2013; A Kohn, 2007). Mechanisms that implement such constraints could underlie the fact that repetition suppression is observed most frequently. The circuit perspective, however, emphasizes that violations of this default should neither be rare nor unexpected.
4.4. Temporal scales
Changes in the neural response that depend on the history of previous stimuli can be observed on many time scales. In MT neurons, for instance, such effects have been described on the sub-second time scale (Priebe & Lisberger, 2002; Schlack et al., 2007), seconds (Krekelberg, van Wezel, et al., 2006), and even minutes (A. Kohn & Movshon, 2003). Most likely, these phenomena rely on different mechanisms, and differences in the duration of stimuli have been hypothesized to account for some of the discrepancies between fMRI-adaptation studies (Krekelberg, Boynton, et al., 2006).
In our recordings, adaptation of the neural response (MUAE, evoked LFP, and LFP-gamma band activity) changed qualitatively depending on the time scales. On time scales of tens of milliseconds, adaptation was direction selective (peaking at ~ 100 ms); this matches the findings of Priebe et al (2002) who explored this in detail for both direction and speed tuning and argue, as we do here, that this short-term adaptation likely arise from adaptation within MT. In human VEP studies (Hoffmann, Dorn, & Bach, 1999), direction specific adaptation is also reflected mainly in the N2 response, providing further support for the idea that time scales may help to disentangle direction specific from non-specific effects.
On time scales of seconds, adaptation was independent of the stimulus, and even independent of the ongoing activity. One potential explanation is that this includes contributions of adaptation inherited from earlier (direction non-selective) neurons, for instance through synaptic depression as suggested by the results of Kohn and Movshon (2003). Regardless of the underlying mechanism, however, this finding implies that shorter stimulus presentations could be more likely to reveal underlying selectivity. If these findings generalize to V1, this may explain why fMRIa experiments with brief duration stimuli (Krekelberg, Vatakis, & Kourtzi, 2005) have revealed selective (orientation) adaptation in V1 while experiments with intermediate duration stimuli did not (Boynton & Finney, 2003).
Shorter stimuli, however, typically generate less signal, hence the observation that adaptation is most selective at time scales of tens of milliseconds results in an experimental design trade-off: one has to choose between more adaptation selectivity (brief stimulus) and more signal (long stimulus).
4.5. Generalizability
The variability in adaptation across cortical areas (De Baene & Vogels, 2010; Sawamura et al., 2006), and across stimulus properties such as spatial and temporal scale reported in this and previous electrophysiological (Patterson et al., 2014; Wissig & Kohn, 2012) and modeling (Hegde, 2009) studies, severely limit the use of adaptation as a general purpose tool to study neural selectivity in the brain. We warn in particular against the interpretation of null findings. For instance, we found robust repetition suppression at the scale of single neurons, but much more modest effects in the multi-unit activity, even though this multi-unit activity includes spikes from the single neurons in MT. By analogy, an fMRI voxel apparently without repetition suppression could well contain neurons with suppression and neurons with enhancement whose effects cancel out at the scale of the voxel.
A positive finding, be it repetition suppression or enhancement, does provide some insight into neural processing. The results of (Tolias et al., 2005), however, show that a simplistic interpretation is not warranted even in that case. They showed that some V4 neurons become direction selective only after adaptation. In other words, from a direction selective response after adaptation one cannot infer that the neurons are selective in the absence of adaptation. This again shows that it is important to consider the neurons as part of their local circuit; the adaptation result shows that the V4 neurons are part of a circuit that contains direction selective units, and this circuit can be manipulated by stimulus selective adaptation.
5. Conclusions
In fMRIa the influence of adaptation on the BOLD response is used to infer neural selectivity. The underlying assumptions of this method are that the repeated presentation of a stimulus leads to a reduction of the response that is correlated with the underlying selectivity. Our data provide some support for this view; typically repetition led to suppression, and this suppression was correlated with direction selectivity. Mechanistically, repetition suppression has been ascribed to (potentially a combination of) fatigue, sharpening of tuning curves, or faster response timescales (“facilitation”). Our data do not support the fatigue or facilitation mechanisms, but they do show that tuning curves are not only reduced in amplitude but also narrower after adaptation.
A simplistic model of adaptation, however, does not capture the considerable complexity we found; repetition enhancement, variability across stimuli, neurons, sites, and measures of neural activity, and a dependence on the time scale at which the neural response is evaluated. Taken together this suggests that using adaptation as a general method to uncover neural selectivity is problematic and more sophisticated, circuit-level models of adaptation that go beyond fatigue, sharpening, and facilitation are needed to interpret adaptation results, including those obtained with fMRIa.
Acknowledgments
Research reported in this publication was supported by the National Eye Institute of the National Institutes of Health under Award Number EY017605 and EY016774. The content is solely the responsibility of the authors and does not necessarily represent the official views of the National Institutes of Health. We thank Anne McCormick and Jasmine Siegel for excellent technical support.
Footnotes
Conflict of Interest: The authors declare no conflicts of interest.
Publisher's Disclaimer: This is a PDF file of an unedited manuscript that has been accepted for publication. As a service to our customers we are providing this early version of the manuscript. The manuscript will undergo copyediting, typesetting, and review of the resulting proof before it is published in its final citable form. Please note that during the production process errors may be discovered which could affect the content, and all legal disclaimers that apply to the journal pertain.
References
- Adelson EH, Bergen JR. Spatiotemporal energy models for the perception of motion. J Opt Soc Am A. 1985;2(2):284–299. doi: 10.1364/josaa.2.000284. [DOI] [PubMed] [Google Scholar]
- Adibi M, McDonald JS, Clifford CW, Arabzadeh E. Adaptation improves neural coding efficiency despite increasing correlations in variability. J Neuroscience. 2013;33(5):2108–2120. doi: 10.1523/JNEUROSCI.3449-12.2013. [DOI] [PMC free article] [PubMed] [Google Scholar]
- Boynton GM, Finney EM. Orientation-specific adaptation in human visual cortex. J Neurosci. 2003;23(25):8781–8787. doi: 10.1523/JNEUROSCI.23-25-08781.2003. [DOI] [PMC free article] [PubMed] [Google Scholar]
- Cronin B, Stevenson IH, Sur M, Kording KP. Hierarchical Bayesian modeling and Markov chain Monte Carlo sampling for tuning-curve analysis. Journal of Neurophysiology. 2010;103(1):591–602. doi: 10.1152/jn.00379.2009. [DOI] [PMC free article] [PubMed] [Google Scholar]
- De Baene W, Vogels R. Effects of adaptation on the stimulus selectivity of macaque inferior temporal spiking activity and local field potentials. Cereb Cortex. 2010;20(9):2145–2165. doi: 10.1093/cercor/bhp277. [DOI] [PubMed] [Google Scholar]
- Duijnhouwer J, Krekelberg B. Evidence and Counterevidence in Motion Perception. Cereb Cortex. 2015 doi: 10.1093/cercor/bhv221. [DOI] [PMC free article] [PubMed] [Google Scholar]
- Fujita I. The inferior temporal cortex: architecture, computation, and representation. J Neurocytol. 2002;31(3–5):359–371. doi: 10.1023/a:1024138413082. [DOI] [PubMed] [Google Scholar]
- Gaudio JL, Huang X. Motion noise changes directional interaction between transparently moving stimuli from repulsion to attraction. PLoS One. 2012;7(11):e48649. doi: 10.1371/journal.pone.0048649. [DOI] [PMC free article] [PubMed] [Google Scholar]
- Grill-Spector K, Henson R, Martin A. Repetition and the brain: neural models of stimulus-specific effects. Trends Cogn Sci. 2006;10(1):14–23. doi: 10.1016/j.tics.2005.11.006. [DOI] [PubMed] [Google Scholar]
- Grill-Spector K, Malach R. fMR-adaptation: a tool for studying the functional properties of human cortical neurons. Acta Psychol (Amst) 2001;107(1–3):293–321. doi: 10.1016/s0001-6918(01)00019-1. [DOI] [PubMed] [Google Scholar]
- Harris KD, Henze DA, Csicsvari J, Hirase H, Buzsaki G. Accuracy of tetrode spike separation as determined by simultaneous intracellular and extracellular measurements. J Neurophysiol. 2000;84(1):401–414. doi: 10.1152/jn.2000.84.1.401. [DOI] [PubMed] [Google Scholar]
- Hartmann TS, Bremmer F, Albright TD, Krekelberg B. Receptive field positions in area MT during slow eye movements. J Neurosci. 2011;31(29):10437–10444. doi: 10.1523/JNEUROSCI.5590-10.2011. [DOI] [PMC free article] [PubMed] [Google Scholar]
- Hegde J. How Reliable is the Pattern Adaptation Technique? a Modeling Study. J Neurophysiol. 2009;102(4):2245–2252. doi: 10.1152/jn.00216.2009. [DOI] [PubMed] [Google Scholar]
- Hoffmann M, Dorn TJ, Bach M. Time course of motion adaptation: motion-onset visual evoked potentials and subjective estimates. Vision Res. 1999;39(3):437–444. doi: 10.1016/s0042-6989(98)00186-2. [DOI] [PubMed] [Google Scholar]
- Huang X, Albright TD, Stoner GR. Adaptive surround modulation in cortical area MT. Neuron. 2007;53(5):761–770. doi: 10.1016/j.neuron.2007.01.032. [DOI] [PMC free article] [PubMed] [Google Scholar]
- Huang X, Albright TD, Stoner GR. Stimulus-dependency and mechanisms of surround modulation in cortical area MT. Journal of Neuroscience. 2008;28(51):13889–13906. doi: 10.1523/JNEUROSCI.1946-08.2008. [DOI] [PMC free article] [PubMed] [Google Scholar]
- Joukes J, Hartmann TS, Krekelberg B. Motion detection based on recurrent network dynamics. Front Syst Neurosci. 2014;8:239. doi: 10.3389/fnsys.2014.00239. [DOI] [PMC free article] [PubMed] [Google Scholar]
- Kohn A. Visual adaptation: physiology, mechanisms, and functional benefits. J Neurophysiol. 2007;97(5):3155–3164. doi: 10.1152/jn.00086.2007. [DOI] [PubMed] [Google Scholar]
- Kohn A, Movshon JA. Neuronal adaptation to visual motion in area MT of the macaque. Neuron. 2003;39(4):681–691. doi: 10.1016/s0896-6273(03)00438-0. [DOI] [PubMed] [Google Scholar]
- Kohn A, Movshon JA. Adaptation changes the direction tuning of macaque MT neurons. Nat Neurosci. 2004;7(7):764–772. doi: 10.1038/nn1267. [DOI] [PubMed] [Google Scholar]
- Krekelberg B. Perception of Direction is not Compensated for Neural Latency. Behavioral and Brain Science. 2008;31:208–209. [Google Scholar]
- Krekelberg B, Albright TD. Motion mechanisms in macaque MT. J Neurophysiol. 2005;93(5):2908–2921. doi: 10.1152/jn.00473.2004. [DOI] [PubMed] [Google Scholar]
- Krekelberg B, Boynton G, Vanwezel R. Adaptation: from single cells to BOLD signals. Trends in Neurosciences. 2006;29(5):250–256. doi: 10.1016/j.tins.2006.02.008. [DOI] [PubMed] [Google Scholar]
- Krekelberg B, van Wezel RJ. Neural mechanisms of speed perception: transparent motion. J Neurophysiol. 2013;110(9):2007–2018. doi: 10.1152/jn.00333.2013. [DOI] [PMC free article] [PubMed] [Google Scholar]
- Krekelberg B, van Wezel RJ, Albright TD. Adaptation in macaque MT reduces perceived speed and improves speed discrimination. J Neurophysiol. 2006;95(1):255–270. doi: 10.1152/jn.00750.2005. [DOI] [PubMed] [Google Scholar]
- Krekelberg B, Vatakis A, Kourtzi Z. Implied motion from form in the human visual cortex. J Neurophysiol. 2005;94(6):4373–4386. doi: 10.1152/jn.00690.2005. [DOI] [PubMed] [Google Scholar]
- McMahon DB, Olson CR. Repetition suppression in monkey inferotemporal cortex: relation to behavioral priming. J Neurophysiol. 2007;97(5):3532–3543. doi: 10.1152/jn.01042.2006. [DOI] [PubMed] [Google Scholar]
- Patterson CA, Duijnhouwer J, Wissig SC, Krekelberg B, Kohn A. Similar adaptation effects in primary visual cortex and area MT of the macaque monkey under matched stimulus conditions. J Neurophysiol. 2014;111(6):1203–1213. doi: 10.1152/jn.00030.2013. [DOI] [PMC free article] [PubMed] [Google Scholar]
- Petersen SE, Baker JF, Allman JM. Direction-specific adaptation in area MT of the owl monkey. Brain Res. 1985;346(1):146–150. doi: 10.1016/0006-8993(85)91105-9. [DOI] [PubMed] [Google Scholar]
- Price NS, Ono S, Mustari MJ, Ibbotson MR. Comparing acceleration and speed tuning in macaque MT: physiology and modeling. J Neurophysiol. 2005;94(5):3451–3464. doi: 10.1152/jn.00564.2005. [DOI] [PubMed] [Google Scholar]
- Priebe NJ, Churchland MM, Lisberger SG. Constraints on the Source of Short-Term Motion Adaptation in Macaque Area MT. I. The Role of Input and Intrinsic Mechanisms. J Neurophysiol. 2002;88(1):354–369. doi: 10.1152/.00852.2002. [DOI] [PMC free article] [PubMed] [Google Scholar]
- Priebe NJ, Lisberger SG. Constraints on the Source of Short-Term Motion Adaptation in Macaque Area MT. II. Tuning of Neural Circuit Mechanisms. J Neurophysiol. 2002;88(1):370–382. doi: 10.1152/jn.2002.88.1.370. [DOI] [PMC free article] [PubMed] [Google Scholar]
- Richert M, Albright TD, Krekelberg B. The complex structure of receptive fields in the middle temporal area. Frontiers in Systems Neuroscience. 2013;7:2. doi: 10.3389/fnsys.2013.00002. [DOI] [PMC free article] [PubMed] [Google Scholar]
- Sawamura H, Orban GA, Vogels R. Selectivity of neuronal adaptation does not match response selectivity: a single-cell study of the FMRI adaptation paradigm. Neuron. 2006;49(2):307–318. doi: 10.1016/j.neuron.2005.11.028. [DOI] [PubMed] [Google Scholar]
- Schlack A, Krekelberg B, Albright TD. Recent History of Stimulus Speeds Affects the Speed Tuning of Neurons in Area MT. Journal of Neuroscience. 2007;27(41):11009–11018. doi: 10.1523/jneurosci.3165-07.2007. [DOI] [PMC free article] [PubMed] [Google Scholar]
- Schlack A, Krekelberg B, Albright TD. Speed perception during acceleration and deceleration. Journal of Vision. 2008;8(8):9–11. doi: 10.1167/8.8.9. [DOI] [PubMed] [Google Scholar]
- Simoncelli EP, Heeger DJ. A model of neuronal responses in visual area MT. Vision Res. 1998;38(5):743–761. doi: 10.1016/s0042-6989(97)00183-1. [DOI] [PubMed] [Google Scholar]
- Super H, Roelfsema PR. Chronic multiunit recordings in behaving animals: advantages and limitations. Prog Brain Res. 2005;147:263–282. doi: 10.1016/S0079-6123(04)47020-4. [DOI] [PubMed] [Google Scholar]
- Tolias AS, Keliris GA, Smirnakis SM, Logothetis NK. Neurons in macaque area V4 acquire directional tuning after adaptation to motion stimuli. Nat Neurosci. 2005;8(5):591–593. doi: 10.1038/nn1446. [DOI] [PubMed] [Google Scholar]
- Van Wezel RJ, Britten KH. Motion adaptation in area MT. J Neurophysiol. 2002;88(6):3469–3476. doi: 10.1152/jn.00276.2002. [DOI] [PubMed] [Google Scholar]
- Wissig SC, Kohn A. The influence of surround suppression on adaptation effects in primary visual cortex. Journal of Neurophysiology. 2012;107(12):3370–3384. doi: 10.1152/jn.00739.2011. [DOI] [PMC free article] [PubMed] [Google Scholar]
- Xiao J, Niu YQ, Wiesner S, Huang X. Normalization of neuronal responses in cortical area MT across signal strengths and motion directions. J Neurophysiol. 2014;112(6):1291–1306. doi: 10.1152/jn.00700.2013. [DOI] [PMC free article] [PubMed] [Google Scholar]


