

Abstract
Inability to digest lactose due to lactase non-persistence is a common trait in adult mammals, with the exception of certain human populations that exhibit lactase persistence. It is not clear how the lactase gene can be dramatically downregulated with age in most individuals, but remains active in some. We performed a comprehensive epigenetic study of the human and mouse intestine using chromosome-wide DNA modification profiling and targeted bisulfite sequencing. Epigenetically-controlled regulatory elements were found to account for the differences in lactase mRNA levels between individuals, intestinal cell types and species. The importance of these regulatory elements in modulating lactase mRNA levels was confirmed by CRISPR-Cas9-induced deletions. Genetic factors contribute to epigenetic changes occurring with age at the regulatory elements, as lactase persistence- and non-persistence-DNA haplotypes demonstrated markedly different epigenetic aging. Thus, genetic factors facilitate a gradual accumulation of epigenetic changes with age to affect phenotypic outcome.
Keywords: Lactase non-persistence, Lactose intolerance, Lactase gene, Epigenetics, DNA methylation, DNA modification, Enhancers, long non-coding RNA, Aging, CRISPR-Cas9 genome editing
Introduction
Lactose is the major carbohydrate component of milk and other dairy products. Digestion of lactose is mediated by lactase (LCT), an enzyme uniquely expressed in epithelial cells of the small intestine. In mammals, LCT expression initiates before birth, remains high during the nursing period and then progressively declines after weaning, resulting in lactase non-persistence1,2. However, some humans are lactase persistent, for which the level of LCT mRNA, and consequently LCT activity, remains high in adulthood, especially in the jejunum of the small intestine. Human lactase non-persistence is the ancestral state of LCT regulation, and over 65% of humans worldwide are lactose intolerant3. Despite its prevalence in humans and other mammals the molecular mechanisms mediating lactase non-persistence are not well understood.
To date, inter-individual differences in LCT expression in human adults have been attributed solely to DNA sequence variation upstream of LCT. In particular, the C/T-13910 single nucleotide polymorphism (SNP, rs4988235) found in intron 13 of the minichromosome maintenance complex component 6 (MCM6) gene is associated with the phenotypes of lactase persistence and non-persistence in European populations4. Lactase persistence in Europe is attributed to the T-13910 allele, part of an extended conserved >500 kb haplotype that has been under strong directional selection for the last 3–7,500 years5–9. This and other nearby genetic polymorphisms associated with LCT expression have been detected in other ethnic groups as well3,10–12, and across populations lactase persistence originated on several different haplotype backgrounds10–12. However, in non-Europeans, these SNPs do not fully explain lactase persistence, and certain individuals within African populations exhibit lactase persistence in the absence of known LCT-associated variants3,10. Though reporter assays examining LCT promoter induction and gel shifts13–15, as well as transgenic mouse experiments16, support the importance of SNP C/T-13910 in LCT regulation in European populations, the reported differences between allelic variants are modest (T-13910 variant shows a ~1.5-fold higher activity compared to ancestral variant)15. This suggests that, in addition to SNPs, there could be other factors contributing to LCT mRNA differences in lactase persistent and non-persistent individuals. It is also unclear what molecular mechanisms can account for the age-dependent changes of LCT expression; from very high in infancy to substantial downregulation in the majority of adults. Since DNA sequence is stable, more dynamic regulatory systems must be involved in the temporal dimension of lactase non-persistence.
Epigenetic modifications of DNA and histone proteins could contribute to lactase non-persistence as they effectively regulate gene transcription17, differ markedly across tissues and cell types17,18, and also change in the same individual over time19,20. Indeed, evidence suggests that many manifestations of aging, including age-dependent diseases, have an epigenetic basis17,21,22. In light of this, we set out to conduct the first investigation examining the extent to which epigenetic processes mediate the age-dependent and cell type-specific downregulation of LCT that results in lactase non-persistence. In this study, we performed chromosome-wide profiling of DNA modification (consisting of methylation and other epigenetic cytosine modifications) using high density tiling microarrays, followed by targeted bisulfite sequencing-based interrogation of the human and mouse lactase genes in intestinal cells and other tissues. We detected changes in DNA modification densities at several distinct regulatory elements that direct the gradual decline in lactase gene expression following infancy in mammals. We then explored how genetic factors can impact age-specific changes in epigenetic marks, and found that SNP C/T-13910 containing haplotypes contributed to the epigenetic aging of LCT–MCM6. To validate the epigenetically-controlled regulatory elements for the lactase gene, we used RNA interference (RNAi) in human tissue culture and CRISPR-Cas9-induced genetic deletions in the mouse. Our study revealed that lactase non-persistence results from accumulation of transcriptionally suppressive epigenetic changes on haplotypes carrying the SNP C-13010 allele, while T-13910 containing haplotypes escape from epigenetic inactivation to facilitate lactase persistence.
Results
Chromosome-wide investigation of lactase gene regulation
To explore epigenetic contributions to lactase non-persistence and persistence, we obtained surgical jejunum samples from unrelated human adults (Supplementary Fig. 1a) and isolated villi enterocytes (intestinal epithelial cells)23 from the jejunum (Supplementary Fig. 1b). Across individuals there was a wide range of steady-state LCT mRNA levels; differing up to 29-fold (Supplementary Fig. 1c).
We then explored chromosome-wide DNA modification patterns in the human enterocyte samples (cohort 1, n = 56 individuals). The unmodified DNA fraction was enriched using the mTAG-click method24, followed by interrogation on Affymetrix high density human tiling arrays. The arrays used surveyed human chromosome 2, which contains LCT (and the same array also contained chromosomes 9 and 19). Examination across chromosome 2 identified 5 probes that exhibited significant correlation between steady-state LCT mRNA and the density of unmodified cytosines (FDR q = 0.017, R2 = 0.28–0.32). All 5 probes clustered in a ~170 bp region of LCT exon 1–intron 1, where higher DNA modification densities associated with lower LCT mRNA levels (Fig. 1 and Supplementary Table 1). As expected, no significant associations between DNA modification and LCT mRNA levels were detected on chromosomes 9 and 19 (Supplementary Fig. 2). DNA modifications in the jejunum lacking enterocytes also did not exhibit any significant correlations with LCT mRNA (Supplementary Fig. 3).
Figure 1.
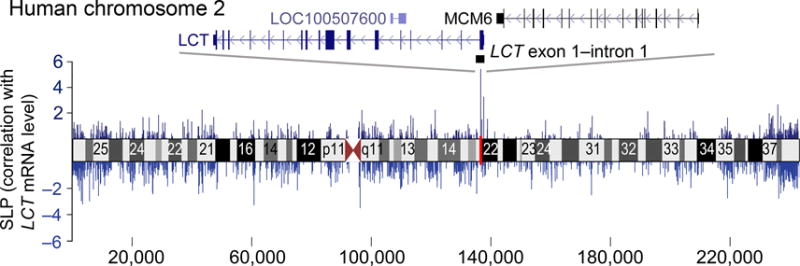
Chromosome-wide scan to detect epigenetically-modified regions associated with LCT regulation in humans. DNA modifications across the entire human chromosome containing the LCT gene investigated in jejunal enterocytes by a tiling array approach. Statistical significance of correlations (Y axis) between the density of unmodified cytosines across human chromosome 2 (X axis) and LCT steady-state mRNA levels in enterocytes (n = 56 individuals). The single region exhibiting significant correlation after chromosome-wide correction for multiple testing maps to LCT exon 1–intron 1. SLP (signed log10(p-value)) refers to the significance of correlation, with the sign corresponding to the direction of correlation.
We next investigated whether DNA modification changes are involved in the age-related decline of the lactase gene. For this experiment, we compared chromosome-wide DNA modification profiles of jejunal enterocytes of infant and adult mice (postnatal day 6 vs. 60, respectively). Similar to lactase non-persistence in humans, mice show high intestinal lactase activity at birth, followed by a gradual decrease after infancy25. Indeed, we found that Lct mRNA in the jejunum of inbred C57BL/6N adult mice at postnatal day 60 was reduced by 3-fold compared to infant mice at postnatal day 6 (p < 10−4; Supplementary Fig. 4a). For the epigenetic analysis, we used the mTAG-click method to enrich the unmodified DNA fraction from infant and adult jejunal enterocytes, followed by interrogation on mouse tiling microarrays. We detected that 0.4% of probes in mouse chromosome 1, which contains Lct, exhibited significant differential DNA modification between the two age groups (11,206 probes, FDR q < 0.01; Supplementary Fig. 4b and Supplementary Data Set 1). Of these differentially-modified probes, 30 probes mapped to within 100 kb of Lct, clustering into 3 regions: Lct intron 2–exon 3, intron 8–exon 9, and exon 10 (~60–700 bp region size; 1.36- to 2.25-fold change; Supplementary Fig. 4b and Supplementary Table 1). At all these regions, adult animals demonstrated significantly greater densities of modified cytosines compared to infants (FDR q < 0.01), indicating an inverse relationship between DNA modification and Lct mRNA levels. Thus chromosome-wide analysis revealed epigenetically-modified regions in the lactase gene of both mice and humans, which may be important for its transcriptional regulation and the establishment of lactase non-persistence.
Inter-individual and cell-type specific LCT regulatory sites
To complement the broad but relatively low resolution of the microarray-based approach, we fine-mapped the extended human LCT region using bisulfite padlock probe sequencing26. For this, we designed 466 padlock probes covering a ~100 kb genomic region encompassing LCT (49 kb) and MCM6 (37 kb). In addition to the first cohort used in the microarray experiment, a second cohort of jejunum samples (n = 59 individuals) was added to this investigation, for a total of 115 samples (Supplementary Fig. 1a). We first examined the regions mediating human inter-individual differences in LCT. In this analysis, we performed correlations between DNA modification densities and LCT mRNA levels. In enterocytes, significant inverse correlations were detected between DNA modification density and steady-state LCT mRNA levels at 11 CpG sites (p < 0.01–10−10 after Bonferroni correction). These 11 CpGs clustered into 2 regions: MCM6 intron 13–exon 13 (~600 bp region size; R2 = 0.27–0.53), which surrounds the lactase persistence and non-persistence SNP C/T-13910, and MCM6 exon 16 (~30 bp region size; R2 = 0.20–0.25; Fig. 2a and Supplementary Fig. 4c, d and Supplementary Table 1). This suggests that epigenetically-controlled regions within MCM6 may mediate individual differences in LCT mRNA.
Figure 2.
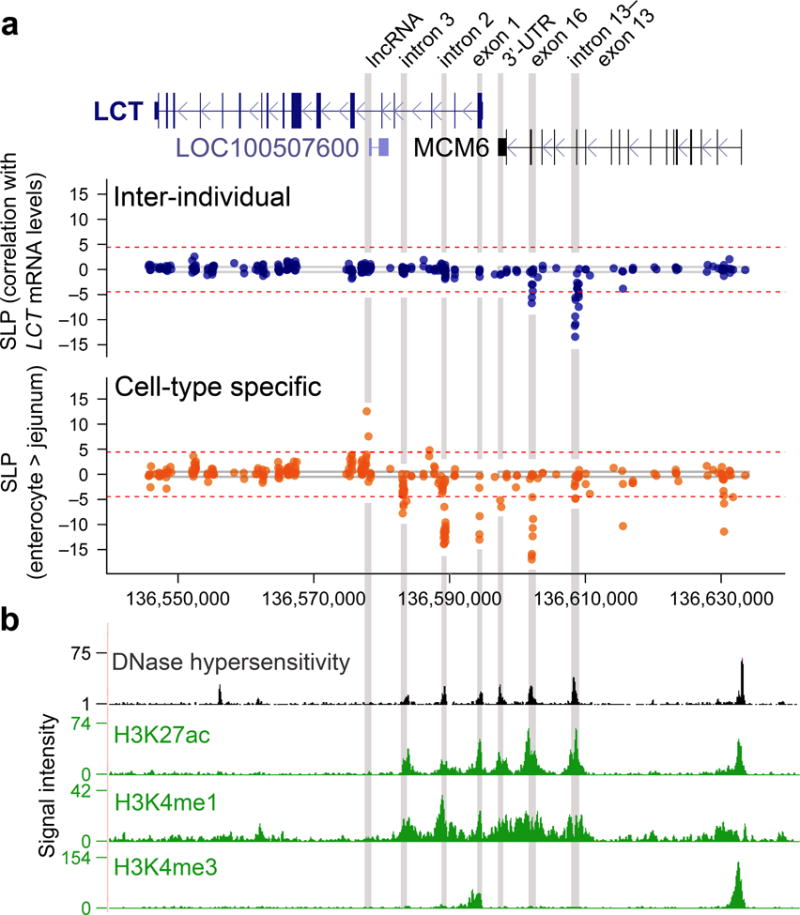
Fine-mapping of DNA modifications to identify regions associated with inter-individual and cell-type specific LCT mRNA levels in human adults. The bisulfite padlock probe approach profiled DNA modifications in human intestinal samples (n = 115 individuals). (a, upper panel) In enterocytes, DNA modifications significantly correlated with individual LCT mRNA levels at two regions in MCM6: exon 16 and intron 13–exon 13. SLP refers to the log10(p-value), with the sign corresponding to the direction of correlation. The dashed line indicates threshold significance after Bonferroni correction for multiple testing (p < 0.01). (a, lower panel) Cell-type specificity of LCT modification determined by comparison of enterocytes to the remainder of the jejunum. Seven regions within LCT and MCM6 were associated with cell-type specificity of LCT. (b) Regions exhibiting inter-individual and cell-type specific LCT–MCM6 modification differences (grey vertical bars) overlap with DNase I hypersensitivity sites and are located within enhancers (H3K4me1 and H3K27ac at LCT intron 3, intron 2 and MCM6 3′-UTR, exon 16 and intron 13–exon 13) and a promoter (H3K4me3 and H3K27ac at LCT exon 1). The region at LCT intron 5 is located at the promoter of the lncRNA LOC100507600. Chromatin modification profiles from the fetal small intestine (n = 1 individual) mapped by the Epigenomics Roadmap.
We then identified regions involved in the cell-type specific expression of LCT by comparing the DNA modification profiles of enterocytes with that of the enterocyte-deficient jejunum of the same individuals. Significant DNA modification differences were observed at 35 CpG sites (p < 0.01–10−14 after Bonferroni correction), which clustered into seven distinct regions: LCT intron 5, intron 3, intron 2, exon 1, as well as MCM6 exon 17, exon 16 and intron 13 (~25–560 bp region size; 1.35- to 2.51-fold change between jejunum and enterocytes; Fig. 2a and Supplementary Table 1). The MCM6 intron 13 and exon 16 regions each overlapped the regions identified in the inter-individual analysis above. The LCT exon 1 and intron 2 regions we identified by targeted bisulfite sequencing were close to the respective regions detected in the tiling microarrays (Supplementary Fig. 4c). Notably, the region in LCT intron 5 mapped to the promoter of a long non-coding RNA (lncRNA), LOC100507600, while the exon 17 region mapped to 3′ untranslated region (3′-UTR) of MCM6.
We also investigated whether the association of DNA modifications with LCT was unique to enterocytes or could be extended to tissue that does not express LCT mRNA. In white blood cells (n = 58 individuals), the seven LCT–MCM6 regions were nearly fully modified and therefore vastly differed from those of intestinal tissues (averaged % DNA modification in blood, enterocyte-deficient jejunum and enterocytes: 73.3%±0.4%, 54.2%±0.8% and 37.1%±0.9%, respectively; Supplementary Fig. 5). This provides additional support that these regions facilitate the cell-type specificity of LCT modification.
To further explore the regulatory functions of the differentially modified LCT regions, we investigated chromatin reference maps of the human small intestine (Fig. 2b and Supplementary Table 2) generated by the Epigenomics Roadmap17,27,28. Our discovered regions in LCT exon 1, introns 2 and 3, as well as MCM6 intron 13, exon 16 and 3′-UTR overlapped with DNase I hypersensitivity sites. Moreover, histone marks characteristic of active enhancers, H3K4me1 and H3K27ac, were detected at LCT introns 2 and 3, as well as MCM6 intron 13 and exon 16 to 3′-UTR. No other enhancer sites were observed elsewhere in a 100 kb region centered over LCT and MCM6. Meanwhile, LCT exon 1 had an abundance of H3K4me3 and H3K27ac, indicative of an active promoter. Hence, functional chromatin signatures corroborate well with the sites we identified in our DNA modification study, further supporting the role of epigenetic mechanisms in the regulation of LCT.
Genotype-dependent and temporal changes in LCT modification
Since LCT–MCM6 haplotypes exhibit a strong association with lactase non-persistence and persistence in adult Europeans5,6,29, we hypothesized that differential epigenetic modifications could occur in such haplotypes, contributing to the age-dependent regulation of LCT. To test this, we examined whether different genetic backgrounds at LCT–MCM6 led to a divergence of DNA modifications in an age-dependent fashion. We first genotyped two MCM6 SNPs (C/T-13910, rs4988235 and G/A-22018, rs182549) and an insertion-deletion in the 3′ region of LCT intron 1 in the intestine samples (n = 115 individuals). All three genotypes showed association with steady-state LCT mRNA levels (Supplementary Fig. 6a) and exhibited strong pairwise linkage disequilibrium (D′ > 0.9; Supplementary Fig. 6b), consistent with previous reports5,6. Further analysis focused on the SNP C/T-13910, for which C and T alleles are parts of the haplotypes associated with lactase non-persistence and lactase persistence, respectively4–6.
We next investigated DNA modification changes at the seven regulatory regions (described in the above sections) in enterocyte samples stratified for genetic background. We observed that CC carriers (lactase non-persistent) displayed major DNA modification differences in comparison to TT carriers (lactase persistent) in the MCM6 locus, particularly at the MCM6 intron 13–exon 13 (82.1±2.6% vs. 19.3±4.1%; p < 10−17) where the SNP C/T-13910 resides (Fig. 3 and Supplementary Fig. 6c). Our postdiction is that MCM6 intron 13 completes most of its age-dependent epigenetic changes during the first two decades after birth (prior to the age of the youngest individuals in our sample set ranging from 21–72 years old). Indeed, DNA modification changes at MCM6 intron 13 for the haplotypes containing C-13910 must occur after conception, as our investigation of sperm samples (n = 18 individuals) revealed no DNA modification differences between CC, CT and TT genotypes at this region (>94% modified in all genotypes; data not shown). It can be hypothesized that such DNA modifications are erased at embryogenesis, enabling high postnatal LCT activity, followed by their gradual regain with age in a haplotype-specific fashion. The situation with MCM6 exon 16 is likely similar, as it also shows significant differences between C-13910 and T-13910 carrying haplotypes (52.7±3.1% vs. 32.8±4.1%; p < 0.01; Fig. 3), though it amasses more gradual DNA modification changes compared to MCM6 intron 13.
Figure 3.
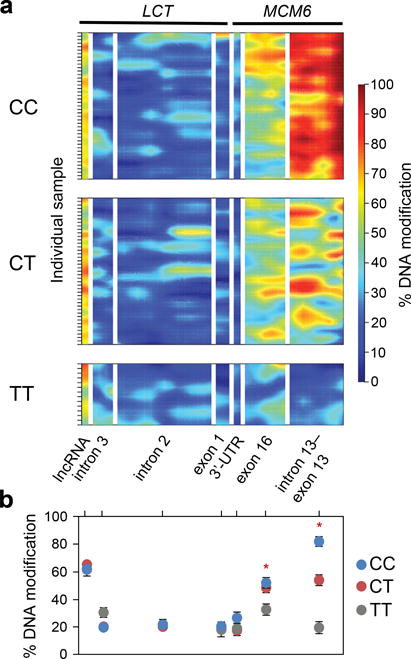
The effect of genetic variation relevant to lactase non-persistence and persistence on DNA modification landscapes. (a) Heatmaps show variation of DNA modifications in enterocytes at the seven regulatory sites associated with LCT regulation in the population stratified for SNP C/T-13910 genotype. MCM6 contained the most dramatic modification differences between CC, CT and TT individuals (n = 43, 43, 14 individuals, respectively). Color scale indicates DNA modification densities; from absence (dark blue) to fully modified (dark red). Each bar on Y-axis represents a separate sample. (b) Average DNA modification density in human enterocyte samples at each of the seven regulatory sites. CC individuals (lactase non-persistent) exhibited a 4-fold higher density of modified cytosines at MCM6 intron 13–exon 13 compared to the TT individuals (lactase persistent) (82% in CC vs. 19% in TT; F2,97 = 61.8, p < 10−17; one-way ANOVA). DNA modification density also significantly diverged between genotypes at MCM6 exon 16 (53% in CC vs. 33% in TT; F2,97 = 4.9, p < 0.01; one-way ANOVA). Data are means ± s.e.m. (n = 43 CC, 43 CT and 14 TT individuals). * p < 0.01 comparison between homozygote carriers; Tukey’s honest significant difference (HSD) post-hoc test.
Molecular events associated with lactase non-persistence or persistence do not stop at childhood or youth1,2. In our cohort of 21–72-year-old individuals, we detected that LCT mRNA was significantly decreasing with age in the lactase non-persistent (CC) individuals (R2 = 0.2, p < 0.01), but showed no aging changes in the intermediate (CT) individuals, and a non-significant increase in lactase persistent (TT) individuals (R2 = 0.13, p = 0.2). We then investigated age-related DNA modification changes within each of the seven regulatory regions in the enterocyte samples stratified for C/T-13910 genotypes. In lactase non-persistent individuals (CC), DNA modifications consistently increased with age across LCT and MCM6 (Fig. 4). Conversely, lactase persistent (TT) individuals showed mostly decreasing DNA modification densities in MCM6 and LCT with age (Fig. 4) (except at the lncRNA promoter, where greater DNA modification associated with higher LCT mRNA). DNA modification changes observed in adulthood could be an extension of the LCT–MCM6 epigenetic processes occurring in childhood. Overall, our findings suggest that lactase non-persistence may be mediated by an age-related increase in DNA modifications at regulatory elements in MCM6 and LCT, while such elements are protected from epigenetic inactivation in lactase persistent individuals.
Figure 4.
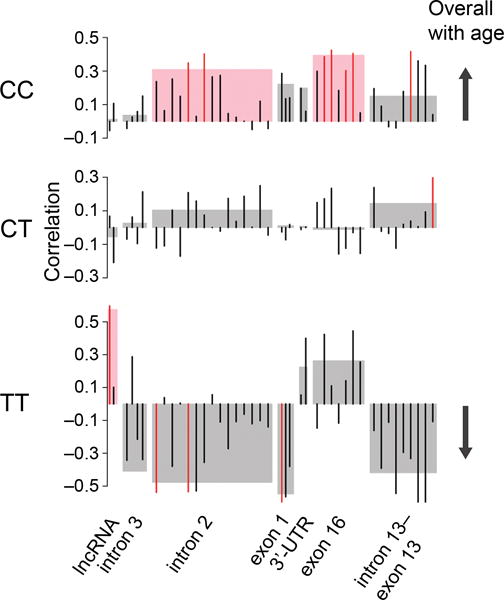
Aging dynamics of DNA modification at LCT–MCM6 regulatory sites between SNP -13910 CC, CT and TT carriers. DNA modification changes occurring with age examined in enterocytes of CC, CT and TT carriers (n = 43, 43 and 14 individuals, respectively). To identify region-wide changes in response to age, average DNA modification densities at each of the seven epigenetically-controlled regions associated with LCT regulation were correlated with age. Pink and grey boxes indicate significant (p < 0.05) and non-significant, respectively, region-wide correlations. To identify effects at individual cytosine sites, single CpGs within each of the seven regions were correlated with age. Red and black bars indicate significant (p < 0.05) and non-significant, respectively, single CpG correlations. In CC individuals, DNA modifications increased with age; an effect most apparent at LCT intron 2 (adjusted R2 = 0.07) and MCM6 exon 16 (adjusted R2 = 0.13). TT individuals demonstrated DNA modifications that primarily decreased with age, except at the lncRNA promoter region which had an age-dependent increase in DNA modifications (adjusted R2 = 0.28). Correlations between DNA modification and age, including those that did not reach statistical significance, were predominantly positive in CC individuals and predominantly negative in TT individuals (as indicated by arrow).
Evolutionary conservation of LCT regulation
We next explored the extent of evolutionary conservation of epigenetic factors contributing to the age-dependent downregulation of the lactase gene in mammals. For this, we used 404 padlock probes and bisulfite sequenced a ~80 kb region containing Lct and Mcm6 in enterocytes of infant (6 days old) and adult (60 days old) mice. DNA modifications at Lct intron 2 and 8 (similar regions to those identified in the tiling arrays) significantly increased with age in mice (FDR q < 0.05; fold changes: 1.60 and 1.25, respectively; Supplementary Table 1 and Supplementary Fig. 4c, 7a). In support, investigation of chromatin marks using ENCODE data of an adult (60 days old) C57BL/6N mouse identified an enhancer element (H3K27ac and H3K4me1 peaks) in Lct intron 2, along with an active promoter at Lct exon 1–intron 1 (H3K27ac, H3K4me3 and POLR2A peaks) and an inactive enhancer at Mcm6 intron 13 (only H3K4me1; Supplementary Fig. 7b).
Furthermore, the LCT intron 2 region is highly conserved across mammals, and contains 7 out of 47 mammalian intronic conserved elements in LCT and MCM6 (139 conserved bases; permutation p < 10−7; Supplementary Note 1). This large degree of mammalian sequence conservation was not found in any other intron of LCT or MCM6 (including MCM6 intron 13). Thus, converging evidence indicates that LCT intron 2 is an evolutionarily old regulatory element, common in mice and humans (and potentially across all mammals) for the development of lactase non-persistence. By contrast, the regulatory regions in MCM6 appear to have emerged more recently, contributing to lactase persistence in human adults.
LncRNA involvement in LCT expression
We further investigated the contribution of the previously uncharacterized lncRNA LOC100507600 to the regulation of LCT mRNA. LOC100507600 is transcribed from the opposite DNA strand than LCT. Consequently, it follows that this lncRNA is a natural antisense transcript, a type of regulatory element that can be controlled by DNA modification30, and that is increasingly recognized to alter target gene expression31,32. We examined the human jejunum cohort 2 (n = 59 individuals) and detected a strong positive correlation between LOC100507600 lncRNA and LCT mRNA (R2 = 0.73; p < 10−9; Fig. 5a).
Figure 5.
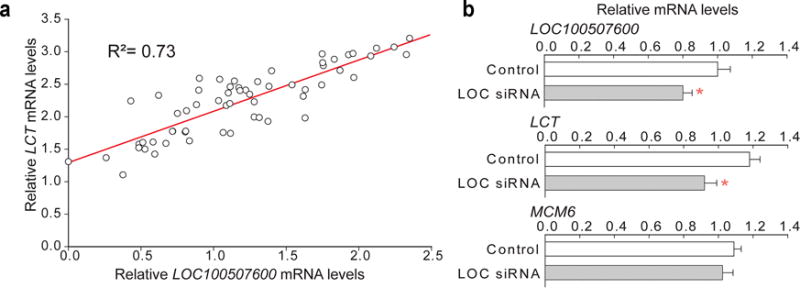
A lncRNA LOC100507600 affects LCT mRNA levels in human intestinal cells. (a) qPCR analysis of LCT and lncRNA levels in human enterocytes (n = 59 individuals). Regression plot showing a strong positive correlation between LCT mRNA and lncRNA levels. (b) RNAi-mediated reduction of lncRNA LOC100507600 in human intestinal epithelial cells, Caco-2. Inhibition of lncRNA reduced steady-state LCT mRNA levels, but did not affect MCM6 mRNA. Relative mRNA levels are shown for cells treated with a scrambled siRNA control (open bars) and a siRNA cocktail directed to lncRNA LOC100507600 (grey bars). Data are means ± s.e.m. (n = 11 and 8 cell cultures). * p < 0.05 compared to scrambled control; two-tailed Student’s t-test.
We next investigated the capacity of the lncRNA to modulate LCT mRNA levels. We performed an RNAi experiment in the human intestinal epithelial cell line Caco-2, which has the TT genotype at SNP -13910. Transfection with small-interfering RNAs directed to LOC100507600 reduced its expression by 20%, and resulted in concomitant 25% reduction in LCT mRNA (p < 0.05; Fig. 5b). Hence, LCT mRNA levels were effectively regulated by this lncRNA in cells relevant to lactase persistence. The mRNA of the non-targeted MCM6 remained unchanged by LOC100507600 silencing (Fig. 5b).
To understand how increased DNA modification at the lncRNA promoter could augment LOC100507600 lncRNA and LCT mRNA levels, we surveyed ENCODE datasets28. There was a CTCF (insulator) binding site overlapping the lncRNA promoter that was nearly ubiquitous across human tissues (present in 51 out of 52 cell lines, including Caco-2). Increased DNA methylation inhibits CTCF binding at such insulator sites, which has been shown to activate tissue-specific gene expression33, and facilitate the interaction of neighboring enhancers with their target promoters34,35. However, further investigation is required to understand this LCT-regulating lncRNA.
Genetic manipulation of lactase regulatory elements
We used the CRISPR-Cas9 genome editing technology to determine whether the differentially modified DNA regions indeed contribute to Lct regulation. For this, we deleted intronic regions in Lct or Mcm6, and measured the effect on steady-state Lct mRNA (Fig. 6a and Supplementary Fig. 7b, 8a). We deliberately targeted intronic regions only, avoiding splicing sites and exons that may compromise Lct mRNA processing and stability. In C57BL/6N mice, we deleted the Lct intron 2 region, which showed evidence of cross-species lactase gene regulation, and separately deleted a region in Mcm6 intron 13, which was important to human LCT regulation. We also generated a deletion in Lct intron 1, serving as a positive control due to its overlap with a Lct promoter element. As a negative control, we measured Mcm6 mRNA levels in mice carrying the Mcm6 intron 13 deletion. We also surveyed and did not find any off-target activity of the CRISPR-Cas9 system in 46 candidate regions (Supplementary Fig. 8b, c).
Figure 6.
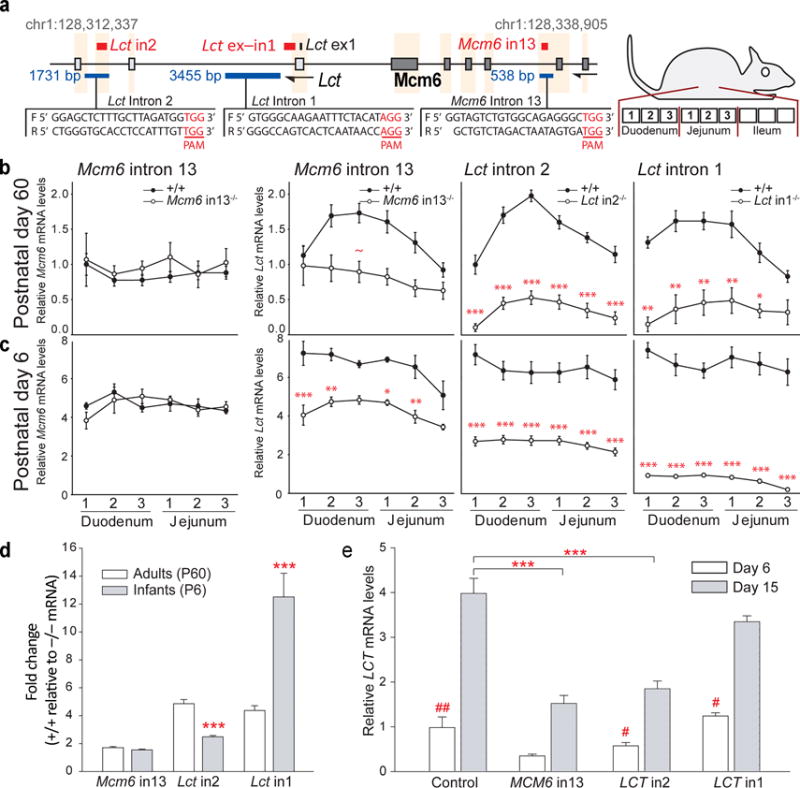
CRISPR-Cas9-mediated deletions of lactase regulatory elements in mice and a human cell line. (a) Schema showing guide RNA sequences and the resulting CRISPR-Cas9-mediated deletions in Lct intron 2, intron 1 and Mcm6 intron 13 in mice. (b, c) Lct and Mcm6 mRNA levels in the proximal, middle and distal sections of the duodenum and jejunum of postnatal day 60 (adult) and day 6 (infant) wild-type (+/+) and homozygote mutant (−/−) mice. One-way repeated measures ANOVAs showed significant loss in Lct mRNA due to regulatory element deletion in Mcm6 intron 13 (adult: F1,15=7.6, p<0.05; infant: F1,7=43.7, p<10−3), Lct intron 2 (F1,30=162.3, p<10−12; F1,18=50.9, p<10−5) and Lct intron 1 (F1,10=27.8, p<0.001; F1, 8=137.2, p<10−5). * p<0.05, **p<0.01, ***p<10−3, ~p=0.06 compared to wild-type mice. (d) Averaged fold change in Lct mRNA in adult and infant genetically-modified mice. Two-way ANOVA showed a significant mutation-age interaction (F2,46 = 116.4, p < 10−21). ***p<10−3 compared adults with same mutation. (e) Deletions of regulatory elements in MCM6 intron 13 and LCT intron 2, and a negative control sequence in LCT intron 1 in human intestinal epithelial cells, Caco-2. Undifferentiated Caco-2 cells (day 6) and differentiated cells, which exhibit an enterocyte-like state (day 15) examined. LCT mRNA in differentiated, enterocyte-like Caco-2 cells was reduced by deletion in MCM6 intron 13 and LCT intron 2 (genotype effect: F3,176=11.7, p<10−6 and genotype-day interaction: F3,176=4.8, p<0.01; by two-way ANOVA). ***p<10−3 compared to Cas9n-transfected controls; #p<0.05, ##p<10−4 within genotype. (b, c, d, e) p-values are Tukey’s HSD post-hoc test. Data are means ± s.e.m. Mouse sample sizes (+/+,−/−): Mcm6 intron 13 P60 n=11, 6; P6 n=4, 5), Lct intron 2 (P60 n=13, 19; P6 n=10, 10) and intron 1 (P60 n=8, 4; P6 n=6, 4). Cell culture sample sizes (left-to-right) n=41, 46, 7, 8, 26, 32, 12 and 9.
In adult and infant mice, deletion in Lct intron 1 as well as in Lct intron 2 caused widespread downregulation of Lct throughout the duodenum and jejunum (3- to 8-fold reduction; p < 0.001–10−12; Fig. 6b, c). The deletion in Mcm6 intron 13 yielded less pronounced, segment-specific Lct mRNA reductions (less than 2-fold reduction; p < 0.05–10−3; Fig. 6b, c). This intronic deletion did not alter Mcm6 mRNA levels, supporting that our CRISPR-Cas9 deletions specifically affected Lct (Fig. 6b, c). Compared to the other deletions, the mutation in Lct intron 2 produced a significantly greater loss in Lct mRNA in adults than in infants (2-fold greater reduction in adult intestine, p < 10−3; Fig. 6d). This suggests that the evolutionary conserved Lct intron 2 establishes a stronger control of Lct mRNA in adulthood, corroborating our above findings of aging mice.
We also examined the extent to which the epigenetically-regulated regions impact human LCT expression in cultured human intestinal epithelial cells, Caco-2. Caco-2 cells undergo spontaneous differentiation into enterocyte-like cells of the small intestine when grown past confluence13. We assayed LCT expression in Caco-2 cells carrying a CRISPR-Cas9n-induced deletion in the regulatory elements in MCM6 intron 13 or LCT intron 2. We also deleted a region not overlapping a regulatory element in LCT intron 1, serving as a negative control. Cells were examined at a time point prior-to-confluence (undifferentiated, cancer-like state, day 6) and post-confluence (differentiated, intestine epithelial-like state, day 15). The deletions did not affect LCT mRNA expression in the undifferentiated state (Fig. 6e). However, in the differentiated, epithelial-like cell state the deletion in MCM6 intron 13 or LCT intron 2 resulted in a significant decrease in LCT mRNA levels (p < 10−3; Fig. 6e), supporting the importance of these regions in regulation of LCT expression in humans.
Discussion
This study reveals that epigenetic factors are involved in the regulation of the human and mouse lactase genes, and by corollary lactase non-persistence and related lactose intolerance. DNA modification studies, in combination with chromatin maps and our functional studies of mutant mice and cell lines, revealed quite a complex regulation of the lactase gene. Indeed, epigenetic modifications targeting several different regulatory elements account for species- and tissue- specific effects as well as the inter-individual variation of LCT expression. A key finding is that different LCT–MCM6 haplotypes “age” epigenetically differentially, which suggests that the epigenetic “clock”19 may be individualized by the genetic landscape. Our findings suggest that the lactase non-persistence haplotypes containing the C-13910 allele accumulate modified cytosines that silence the regulatory elements in MCM6 and LCT, while the lactase persistence haplotype containing the T-13910 allele displays age-related modification changes to maintain LCT activity. Since infant LCT mRNA levels are high irrespective of DNA haplotype, it can be speculated that DNA variation is not directly involved in LCT transcription. Rather, genetic variation may mediate the accumulation or loss of epigenetic modifications at specific enhancers and promoters, which, in turn, directly orchestrate gene activity.
Our study is a first step in understanding the interactions of genetic and epigenetic mechanisms in the lactase gene regulation. Previous studies have reported that transcription factor binding differences co-occur with changes in DNA modifications chromosome-wide during the differentiation of enterocytes along the crypt-to-villi axis; a process necessary for LCT expression along this axis36,37. In addition, SNPs associated with lactase persistence and non-persistence show allelic differences in transcription factor binding whereby Oct-1, in combination with HNF1α, shows a higher affinity to the T-13910 allele compared to the C allele15,38. Recently, it has been detected that the DNA methylation machinery competes with binding of transcription factors in vivo39. Therefore, the age-dependent accumulation of modified cytosines at LCT–MCM6 regulatory elements may be circumvented in the lactase persistent T-13910 allele due to its higher affinity for transcription factor binding. In addition, DNA modification differences between LCT–MCM6 haplotypes could influence the extent of CTCF binding, which affect chromatin conformation, and consequently the accessibility of regulatory elements34,35,40. Indeed, our analysis of ENCODE data reveals an enrichment of CTCF binding sites at the lncRNA promoter and other regions, including the MCM6 intron 13. Future studies examining chromatin configuration35 at the LCT–MCM6 locus in aging individuals and targeted epigenetic editing with the CRISPR-Cas9 system41 will be necessary to fully understand genetic-epigenetic contributions to lactase persistence and non-persistence.
Our study helps to further delineate the principles and guidelines for epigenomic studies of other traits and diseases. The main lessons learned are 1) the required investigation the specific cell type centrally involved in the phenotype rather than bulk of the tissue or organ, 2) use of quantitative phenotypes and endophenotypes (in this case mRNA levels), 3) sites containing stretches of differentially modified CpGs were replicable and more biologically plausible than solitary CpGs (a consideration affecting single CpG detection methods, i.e. Illumina 450K arrays), 4) the benefit of cross-species comparisons which showed a partial conservation of regulatory elements between mice and humans, 5) examination of multiple epigenetic layers to gain insight into regulatory element functions, and 6) the potential for DNA sequence risk factors to closely associate with epigenetic abnormalities that together influence gene regulatory elements.
The significance of this study may extend far beyond the lactose-related phenotype and could benefit etiological investigations of complex aging diseases, such as cancer, type 2 diabetes, and Alzheimer’s disease. The necessity for both genetic and epigenetic components in disease may account for why genetic risk factors without their age-dependent epigenetic “load” are harmless for numerous decades. In our study, we found that genetic variation seems to be setting up the stage, either allowing or preventing DNA modification accumulation with age at key regulatory sites. In late-onset diseases, DNA variants may become bona fide disease risk factors once they reach a critical mass of epigenetic misregulation in the aging cell. Genetic-epigenetic interactions may also be involved in the age-dependent loss of pathogenicity of risk genes (i.e. recovery from childhood asthma, epilepsy and atopic dermatitis in adults42,43). Thus, investigation of age-dependent epigenetic trajectories for disease-associated genetic variants may be pivotal to uncovering the molecular origin of complex disease.
Online Methods
No statistical methods were used to predetermine sample size.
Human samples
Jejunum specimens were collected during laparoscopic Roux-En-Y gastric bypass surgery in Departments of Gastroenterology and Surgery, Lithuanian University of Health Sciences (Kaunas, Lithuania). Two cohorts of jejunum surgical samples from unrelated individuals were collected: cohort 1 (n = 56 individuals, 21–72 years old) and cohort 2 (n = 59 individuals, 22–65 years old) (Supplementary Fig. 1a). Following removal, jejunum samples were immediately submerged in RNAlater (Life Technologies), kept overnight at 4°C, followed by storage at −80°C. Blood (n = 58 individuals) and sperm (n = 18 individuals) samples were collected from unrelated individuals enrolled in laparoscopic surgery, and were from separate individuals than those in cohort 1 and 2. Blood samples were collected by venipuncture into heparin-coated tubes (BD), and then stored immediately at −80°C. Sperm samples provided by participants were stored immediately at −80°C. The study protocol was approved by the Bioethics Committee of Lithuanian University of Health Sciences (Protocol 2007-12-04 Nr.BE-2-55), and each patient signed informed consent to participate in the study. Human tissues were processed for mRNA analysis, DNA modification profiling and genotyping by researchers blind to any sample information.
Mouse jejunum samples
All animal procedures were approved by the Institutional Animal Care Committee of the Toronto Centre for Phenogenomics (TCP) and complied with the requirements of the Canadian Council on Animal Care and Province of Ontario Animals for Research Act. C57BL/6NCrl mice were bred at the TCP and housed as described in Supplementary Note 2.
The jejunum of infant (postnatal day 6) and adult (postnatal day 60) mice was investigated. The small intestine was harvested and dissected into three equal parts; the duodenum, jejunum and ileum. Each of these anatomical segments was further dissected into three equal parts (proximal, middle and distal) resulting in nine dissections of the small intestine. Only male mice were used in the chromosome-wide and targeted bisulfite sequencing study. For the CRISPR-Cas9 genetically-modified mice, approximately equal male and female mice ratios were used for each group, and no sex differences in steady-state Lct mRNA were observed. No statistical methods were used to predetermine sample size, but sample sizes were comparable to other studies involving mRNA analysis in mice with CRISPR-Cas9-induced mutations44,45. No animals were excluded from the study. Mice were randomly allocated to the postnatal day 6 or 60 groups. Variance was similar between groups in all analyses. Mouse intestinal samples were processed by researchers blind to genotype and experimental conditions.
mRNA analyses
Total RNA from jejunum samples was isolated using the RNeasy Mini Kit (Qiagen) according to the manufacturer’s instructions and as described in Supplementary Note 2. Total RNA from human epithelial colorectal adenocarcinoma (Caco-2, ATCC) cells was extracted using TRIzol reagent (Life Technologies). RNA integrity was verified on an Agilent Bioanalyzer 2100 system (Agilent Technologies). Total RNA (750 ng) was converted to cDNA using High-Capacity RNA-to-cDNA Kit (Life Technologies). Steady-state mRNA levels were assayed with TaqMan Gene Expression Master Mix (Life Technologies) using an Applied Biosystems ViiA 7 Real-time PCR system. TaqMan gene expression probes (Life Technologies) for mouse and human are detailed in Supplementary Table 3. mRNA of villin 1 and sucrase-isomaltase were used as endogenous controls. RNA extraction and qPCR was done by researchers blind to experimental conditions. Statistical analyses of the qPCR data used repeated-measure (RM) ANOVA with the appropriate between-subjects and within-subject factors, followed by Tukey’s honest significant difference (HSD) post hoc comparisons or by unpaired two-tailed Student’s t-test, as described in Supplementary Note 2.
Intestinal epithelial cell isolation and DNA extraction
A chelating method23 was used to isolate intestinal epithelial cells (enterocytes) from the rest of the jejunum. Since lactase expression is high in enterocytes of the intestinal villi, while low in those of the crypts46,47, we optimized the isolation protocol to yield enterocyte fractions principally from the villi (Supplementary Fig. 1b and see Supplementary Note 2). DNA was isolated with a standard phenol-chloroform approach for each sample.
Chromosome-wide DNA modification analysis
To perform our chromosome-wide scan we enriched the unmodified DNA fraction using the mTAG-click method, as described previously24 (and see Supplementary Note 2). The unmodified DNA fraction was hybridized to GeneChip Human Tiling 2.0R Array (B array, covering chromosomes 2, 9 and 19) or GeneChip Mouse Tiling 2.0R Array (A array, chromosome 1, 9 and 19). Microarrays were processed as detailed in the Affymetrix ChIP Assay protocol and scanned using an Affymetrix GeneChip Scanner.
Tiling array data of isolated enterocytes and enterocyte-deficient jejunum were examined for human and mouse samples. Tiling array intensities were extracted and normalized as described in Supplementary Note 2. Probe sequences were aligned to the genomes for each species (human GRCh37/hg19, mouse GRCm38/mm10) with no mismatches allowed, and only intensities for uniquely-mapping probe sequences were considered. For each sample, normalized intensities were then smoothed using a running pseudomedian filter48 with span of 200 bp.
Probes for the human samples were filtered using a bootstrapping procedure to identity probes that were significantly more consistent between replicate pairs than random samples of the same tissue (Supplementary Note 2). As expected, replicates clustered tightly together after this filtering step. Probes were then filtered to the 5,482 probes that were significantly different between enterocytes and enterocyte-deficient jejunum, based on a paired Mann-Whitney test at each probe and Benjamini-Hochberg multiple testing correction with a false discovery rate (FDR) threshold of q < 0.01.
In the analysis of the human samples, the significance of correlation between DNA modification and LCT steady-state mRNA was calculated using Kendall’s nonparametric correlation test at each probe, followed by Benjamini-Hochberg multiple testing correction. For the mouse samples, age-associated probes were identified by performing a Mann-Whitney test at each probe and then applying the Benjamini-Hochberg correction for multiple testing with a threshold of q < 0.01 (n = 2,680,563 sites).
Bisulfite padlock probes for fine-mapping of DNA modification in humans and mice
DNA modification was examined with single nucleotide resolution in the LCT and MCM6 loci of humans and mice using the bisulfite padlock probe technique26. Padlock probes were generated to target the unique (non-repetitive) genome following bisulfite conversion. Probes were designed for both the forward and reverse DNA strands using recent versions of the genome (human GRCh37/hg19, mouse GRCm38/mm10). Human probes (n = 466) surveyed a ~100 kb region surrounding the LCT and MCM6 locus, while mouse probes (n = 404) were designed to cover an ~80 kb region centered over the Lct and Mcm6. Probe sequences are described in Supplementary Table 4. Probes were synthesized using a programmable microfluidic microarray platform (LC Sciences) and were prepared for padlock investigations, as described26 (see also Supplementary Note 2).
Fine-mapping of DNA modification using the bisulfite padlock probes approach was performed using a modified version of the previously described protocol26 (Supplementary Note 2). In brief, genomic DNA for each sample was bisulfite-converted and purified using the EZ DNA Methylation-Lightning Kit (Zymo Research). The bisulfite-converted DNA (200 ng) was hybridized to the padlock probes. Targeted regions were extended using PfuTurbo Cx (Agilent Technologies) and circularization was completed using Ampligase (Epicentre). Non-circularized DNA was digested using an exonuclease cocktail and the remaining circularized DNA was amplified using a common linker sequence in the padlock probe. Libraries were PCR amplified, pooled, purified by QIAquick Gel Extraction kit (Qiagen) and quantified by qPCR (Kapa Biosystems) on a ViiA 7 Real-time PCR system (Applied Biosystems). Next-generation sequencing of the libraries was done on an Illumina HiSeq 2500 machine in Rapid Run mode at the Donnelly Sequencing Centre in Toronto, Canada.
Analysis of bisulfite padlock probes data
Using a custom pipeline49 based on the Bismark tool50 (see Supplementary Note 2), DNA modification density was interrogated at every cytosine covered by padlock probes. Adaptor sequences were removed from the reads using Trimmomatic-0.32, and reads aligning to the phiX DNA spiked-in were removed. Reads were then aligned to the target reference genome (GRCh37/hg19 or GRCm38/mm10). Percent modification was estimated as the fraction of spanning reads that retained the reference “C”, and were not converted to “T” from the bisulfite treatment. Modification estimates were only considered if 30 or more reads spanned the cytosine. CpG sites were filtered for effect size (interquartile range >= 0.05) and sparsity (coverage in >= 30 samples). In the human samples, we excluded CpG sites within 1 bp of common polymorphisms called as part of the 1000 Genomes Project51 (phase 3, v5a release).
For analysis of the human samples, the correlation was measured between the DNA modification density at individual CpGs and relative steady-state LCT mRNA using Kendall’s nonparametric correlation test. Bonferroni multiple testing correction was then performed and CpGs were considered significant at a familywise error rate threshold α < 0.01. CpGs exhibiting cell-type specific expression were identified by performing a nonparametric Mann-Whitney test at each CpG between the sets of enterocyte and enterocyte-deficient jejunum samples, followed by Bonferroni multiple testing correction and a significance threshold of α < 0.01.
For mouse samples, the significance of association between DNA modification and age was measured separately at each CpG by comparing the modification levels of postnatal day 6 and day 60 mice with a Mann-Whitney nonparametric test. Multiple testing correction was performed using the Benjamini-Hochberg method with a FDR threshold q < 0.05.
Analysis of chromatin state
NarrowPeak peak calls were downloaded for 4 tracks (DNase, H3K4me1, H3K4me3, H3K27ac; see Supplementary Table 2) for human small intestine tissue from Roadmap Epigenomics uniform re-processing unconsolidated epigenomes from Release 9 of the Epigenome Atlas17 (http://egg2.wustl.edu/roadmap/data/byFileType/peaks/unconsolidated/narrowPeak/; Supplementary Table 2). Peak calls were filtered for significance (FDR q < 0.01) and intersected with the seven LCT-associated regions in Supplementary Table 1 (using bedtools52). LCT-associated regions smaller than 500 bp were symmetrically extended to 500 bp. A 100 kb region encompassing LCT and MCM6 (chr2:136,540,000–136,640,000) was scanned for potential enhancer regions by identifying all overlapping H3K4me1 and H3K27ac peaks annotated with an FDR q < 0.01. For the mouse small intestine, we obtained processed data, including BroadPeak calls, for 4 tracks (POLR2A, H3K4me1, H3K4me3, H3K27ac) from ENCODE (www.encodeproject.org). These originated from the small intestine of 60-day old C57BL/6NCrl mice (same age and strain as used in the bisulfite padlock probe sequencing). Peak calls were lifted over from mm9 to mm10 using the UCSC LiftOver tool, and then intersected with the interrogated 80 kb region containing Lct and Mcm6 (chr1:128,280,000–128,360,000).
Analysis of mammalian conservation
The significance of intronic conservation within mammals was assessed using 12-mer constraint predictions from a multiple sequence alignment of 29 mammals53 (http://www.broadinstitute.org/ftp/pub/assemblies/mammals/29mammals/hg19/hg19_29way_pi_lods_elements_12mers.chr_specific.fdr_0.1_with_scores.txt.gz). Intronic regions were defined as the intervals of Refgene regions at least 100bp away from the nearest exon and within a 100 kb region centered on LCT and MCM6 (chr2:136,540,000–136,640,000), resulting in 33 intronic intervals spanning 67,744 bp. Mammalian conserved elements were intersected with these intronic intervals using bedtools to identify 47 intronic conserved elements within LCT and MCM6 (758 conserved bases, or 1.12% of intronic sequence). The expected number of conserved bases within a 500 bp window was modeled by randomly permuting the locations of the 47 conserved elements within the intronic intervals using bedtools shuffle and measuring the total number of conserved bases within a 500 bp region, for each of 10,000,000 iterations. A set of 25 overlapping 500 bp windows were sufficient to span all 47 conserved elements, and the significance of each window was measured by comparing the number of conserved bases within the window to the permuted distribution.
RNAi technique
The relationship between lncRNA (LOC100507600) and LCT mRNA levels was examined by RNA interference in Caco-2 cells (ATCC). For this approach, Caco-2 cells were transfected with either an equimolar pool of 4 siRNAs (30 pmol) directed to LOC100507600 (Qiagen FlexiTube GeneSolution; SI05737893, SI05737900, SI0737907 and SI0737914) or a scrambled-control siRNA (Qiagen AllStars Neg. siRNA AF488, SI03650318) using RNAiMAX (Life technologies) according the manufacturer’s instructions (see also Supplementary Note 2). The siRNA or scrambled control group was randomly assigned to each cell well. After 48 h, transfection efficiency was confirmed for siRNAs conjugated to AlexaFluor-488 using an Olympus FV1200 confocal microscope and FluoView 1200 software (Olympus). Cells were then harvested and RNA was extracted using TRIzol reagent (Life Technologies). mRNA levels were analyzed by qPCR, as described above, to evaluate the consequence of LOC100507600 knockdown on LCT expression.
CRISPR-Cas9 genome-editing
Genetic deletions in the Mcm6 intron 13, Lct intron 2 or Lct intron 1 of mice were generated using the CRISPR-Cas9 genome editing technique, as described54. Design of sgRNAs targeting these loci was completed with the MIT CRISPR Design tool54. Guides were selected based on highest on-target specificity and avoided exons, intronic regions adjacent to exons (at least 100 bp), and repetitive regions.
For the Cas9 RNA-guided nuclease modified mice, sgRNA templates for in vitro transcription were amplified by high-fidelity PCR using a forward primer with the T7 promoter, the guide RNA sequence, and an anchor sequence for the pX330 plasmid (gift of Feng Zhang, Addgene 42230) and a reverse primer at 3′ terminus of the sgRNA sequence in pX330 (Primers detailed in Supplementary Table 3). The PCR templates were gel purified and used for in vitro transcription using the MEGAshortscript T7 transcription kit (Life Technologies) followed by purification using the MEGAclear kit (Life Technologies). Cas9 mRNA was produced by in vitro transcription of a T7 promoter containing amplicon from pX330 using the mMESSAGE mMACHINE T7 Ultra Kit (Life Technologies). Cas9 mRNA (20 ng/μL) and sgRNA (10 ng/μL) were premixed in injection buffer (10 mM Tris, 0.1 mM EDTA, pH 7.5) and microinjected via continuous flow into the pronuclei of C57BL/6NCrl zygotes at the Toronto Centre for Phenogenomics, Canada. Mutation success rates were 18% for Mcm6 (n = 2 mice), 11% Lct intron 1 (n = 2) and 38% for Lct intron 2 (n = 5). F0 mice were backcrossed to wild-type C57BL/6NCrl mice and F1 heterozygous mice were intercrossed, keeping each founder line separate. Of the 9 mutant lines, we investigated only one for each Mcm6 and Lct intron 1, and three lines for Lct intron 2 (the three Lct intron 2 lines did not differ; Supplementary Fig. 8d). F2 offspring from the heterozygous mouse intercrosses were used in experiments.
For genetic modifications in the Caco-2 cell line (ATCC), a model of human intestinal epithelial cells, we opted for the CRISPR-Cas9n system, which has been shown to increase genome editing specificity in cells55. We generated deletions in MCM6 intron 13, LCT intron 2 or LCT intron 1 in the human cells using the CRISPR-Cas9n protocol described previously54 and in Supplementary Note 2. Caco-2 cells in the CRISPR-Cas9n and RNAi experiments were authenticated; showing a 100% match to the reference profile of Caco-2 (ATCC HTB-37) based on genetic analyses of 15 autosomal tandem repeat loci and the gender identity locus amelogenin (performed by Genetica DNA Laboratories). A PCR-based test using the eMYCO Plus kit (iNtRON Biotechnology) verified the absence of mycoplasma contamination in the Caco-2 cells used (performed by Genetica DNA Laboratories).
CRISPR-induced deletions in both the mice and Caco-2 cells were confirmed by Sanger sequencing (ACGT Corporation in Toronto, Canada). LCT steady-state mRNA levels were measured in the CRISPR-Cas9-modified mice and CRISPR-Cas9n-modified Caco-2 cells using a qPCR assay (described above and in Supplementary Note 2).
Genotyping and analysis of CRISPR-induced deletions
Human jejunum samples were genotyped for the genetic variants C/T-13910, G/A-22018 and the deletion in LCT intron 1. PCR amplicons were generated using the KAPA2G Fast kit (Kapa Biosystems), as described in Supplementary Note 2. Genetic variants were identified by Sanger sequencing (C/T-13910; ACGT Corporation in Toronto, Canada), restriction endonuclease digestion with BstUI (G/A -22018; NEB) or by PCR amplicon size5 (deletion in LCT intron 1). Linkage disequilibrium and haplotype structure between these genetic variants was examined using the Haploview 4.2 program.
For the CRISPR-Cas9 modified mice, genotyping was conducted with genomic DNA isolated from mice tail-clippings using a standard high salt method. For the CRISPR-Cas9n modifications in Caco-2 cells, genomic DNA was isolated for each cell colony with QuickExtract solution (Epicentre). Genomic DNA from mice or cells was PCR-amplified with Herculase II Fusion DNA polymerase (Agilent Technologies), as described in Supplementary Note 2. CRISPR-Cas9-induced deletion in Mcm6 intron 13, Lct intron 1 or Lct intron 2 were genotyped by surveying PCR amplicon size (detailed in Supplementary Table 3).
Off-target analysis for CRISPR-induced deletions was also performed for the mice and cell lines. Based on the ranked list of putative off-target sites provided by MIT CRISPR Design tool54,55, we examined the most likely candidate regions for sgRNA off-target activity in both the mice with CRISPR-Cas9-induced deletions (2 sgRNA guides/deletion) and Caco-2 human cells with CRISPR-Cas9n-mediated deletions (4 sgRNA guides/deletion). A total of 46 potential off-target sites were tested in the genetically-modified mice and 172 sites were tested in the Caco-2 human cell lines (Supplementary Table 3 for regions tested and primers used). Candidate regions were PCR amplified as described in Supplementary Note 2. PCR amplicons underwent Sanger sequencing (ACGT Corporation in Toronto, Canada) and sequences were analyzed by alignment with the mouse (GRCm38/mm10) or human (GRCh37/hg19) reference genome. To display the regions investigated we used the CIRCOS program version 0.6756.
Supplementary Material
Acknowledgments
We thank Drs. A. Turinsky and L. Strug for statistical recommendations, Dr. T. Karvelis for help with sgRNA construction, M. Susic for technical assistance, as well as Drs. A. Patterson, P. Kapranov and D. Swallow for their comments on the manuscript. This work was supported in part by the Canadian Institutes of Health Research (MOP-199170, MOP-119451 and MOP-77689), the US National Institutes of Health (MH088413, DK085698), the Krembil Foundation and Brain Canada to A.P. This work was also supported by the Canadian Centre for Computational Genomics (C3G), part of the Genome Innovation Network (GIN), funded by Genome Canada through Genome Quebec and Ontario Genomics to M.B. A.P. is supported as the Tapscott Chair in Schizophrenia Studies, University of Toronto, Canada. E.K. was supported by a grant of the Research Council of Lithuania (MIP-045/2013). J.G. and K.K. were funded by a grant (MIP-14032) from the Research Council of Lithuania. V.L. was supported by a Canadian Institutes of Health Research (CIHR, Canada) Fellowship.
Footnotes
URLs. NIH Roadmap, http://www.roadmapepigenomics.org/data; NCBI Epigenomics portal http://ncbi.nlm.nih.gov/epigenomics; 29 Mammals Project https://www.broadinstitute.org/scientific-community/science/projects/mammals-models/29-mammals-project; ENCODE Project http://www.encodeproject.org/.
Accession codes. All microarray and sequencing data are available from the NCBI Gene Expression Omnibus (GEO) database under the accession number GSE69979.
Author Contributions
The study was designed by V.L. and A.P., and directed and coordinated by V.L., M.B. and A.P. V.L., E.O., R.J., and C.P. planned and performed the experimental work. O.J.B. coordinated and performed the computational analysis. J.G. and K.K. contributed to the computational analysis of the microarrays. A.M., R.P., A. Ž., K.A. and L.K. collected the human jejunum surgical samples and other human tissues. G.G. and V. Š. prepared the CRISPR-Cas9n cell line constructs, and R.J. and A.N. contributed to the CRISPR-Cas9n cell line work. K.K. was involved in the haplotype-dependent epigenetic aging analysis. E.K. consulted on the mTAG approach. S.E., A.Z., G.O. were involved in bisulfite padlock probe design and preparation. The manuscript was written by V.L., O.J.B. and A.P., and commented on by all authors.
Competing Financial Interests
The authors declare no competing financial interests.
References
- 1.Rasinpera H, et al. Transcriptional downregulation of the lactase (LCT) gene during childhood. Gut. 2005;54:1660–1. doi: 10.1136/gut.2005.077404. [DOI] [PMC free article] [PubMed] [Google Scholar]
- 2.Sahi T, Launiala K, Laitinen H. Hypolactasia in a fixed cohort of young Finnish adults. A follow-up study. Scand J Gastroenterol. 1983;18:865–70. doi: 10.3109/00365528309182107. [DOI] [PubMed] [Google Scholar]
- 3.Ingram CJ, Mulcare CA, Itan Y, Thomas MG, Swallow DM. Lactose digestion and the evolutionary genetics of lactase persistence. Hum Genet. 2009;124:579–91. doi: 10.1007/s00439-008-0593-6. [DOI] [PubMed] [Google Scholar]
- 4.Enattah NS, et al. Identification of a variant associated with adult-type hypolactasia. Nat Genet. 2002;30:233–7. doi: 10.1038/ng826. [DOI] [PubMed] [Google Scholar]
- 5.Poulter M, et al. The causal element for the lactase persistence/non-persistence polymorphism is located in a 1 Mb region of linkage disequilibrium in Europeans. Ann Hum Genet. 2003;67:298–311. doi: 10.1046/j.1469-1809.2003.00048.x. [DOI] [PubMed] [Google Scholar]
- 6.Bersaglieri T, et al. Genetic signatures of strong recent positive selection at the lactase gene. Am J Hum Genet. 2004;74:1111–20. doi: 10.1086/421051. [DOI] [PMC free article] [PubMed] [Google Scholar]
- 7.Enattah NS, et al. Evidence of still-ongoing convergence evolution of the lactase persistence T-13910 alleles in humans. Am J Hum Genet. 2007;81:615–25. doi: 10.1086/520705. [DOI] [PMC free article] [PubMed] [Google Scholar]
- 8.Itan Y, Powell A, Beaumont MA, Burger J, Thomas MG. The origins of lactase persistence in Europe. PLoS Comput Biol. 2009;5:e1000491. doi: 10.1371/journal.pcbi.1000491. [DOI] [PMC free article] [PubMed] [Google Scholar]
- 9.Gamba C, et al. Genome flux and stasis in a five millennium transect of European prehistory. Nat Commun. 2014;5:5257. doi: 10.1038/ncomms6257. [DOI] [PMC free article] [PubMed] [Google Scholar]
- 10.Ranciaro A, et al. Genetic origins of lactase persistence and the spread of pastoralism in Africa. Am J Hum Genet. 2014;94:496–510. doi: 10.1016/j.ajhg.2014.02.009. [DOI] [PMC free article] [PubMed] [Google Scholar]
- 11.Tishkoff SA, et al. Convergent adaptation of human lactase persistence in Africa and Europe. Nat Genet. 2007;39:31–40. doi: 10.1038/ng1946. [DOI] [PMC free article] [PubMed] [Google Scholar]
- 12.Jones BL, et al. Diversity of lactase persistence alleles in Ethiopia: signature of a soft selective sweep. Am J Hum Genet. 2013;93:538–44. doi: 10.1016/j.ajhg.2013.07.008. [DOI] [PMC free article] [PubMed] [Google Scholar]
- 13.Troelsen JT, Olsen J, Moller J, Sjostrom H. An upstream polymorphism associated with lactase persistence has increased enhancer activity. Gastroenterology. 2003;125:1686–94. doi: 10.1053/j.gastro.2003.09.031. [DOI] [PubMed] [Google Scholar]
- 14.Olds LC, Sibley E. Lactase persistence DNA variant enhances lactase promoter activity in vitro: functional role as a cis regulatory element. Hum Mol Genet. 2003;12:2333–40. doi: 10.1093/hmg/ddg244. [DOI] [PubMed] [Google Scholar]
- 15.Jensen TG, et al. The -14010*C variant associated with lactase persistence is located between an Oct-1 and HNF1alpha binding site and increases lactase promoter activity. Hum Genet. 2011;130:483–93. doi: 10.1007/s00439-011-0966-0. [DOI] [PubMed] [Google Scholar]
- 16.Fang L, Ahn JK, Wodziak D, Sibley E. The human lactase persistence-associated SNP - 13910*T enables in vivo functional persistence of lactase promoter-reporter transgene expression. Hum Genet. 2012;131:1153–9. doi: 10.1007/s00439-012-1140-z. [DOI] [PMC free article] [PubMed] [Google Scholar]
- 17.Kundaje A, et al. Integrative analysis of 111 reference human epigenomes. Nature. 2015;518:317–30. doi: 10.1038/nature14248. [DOI] [PMC free article] [PubMed] [Google Scholar]
- 18.Elliott G, et al. Intermediate DNA methylation is a conserved signature of genome regulation. Nat Commun. 2015;6:6363. doi: 10.1038/ncomms7363. [DOI] [PMC free article] [PubMed] [Google Scholar]
- 19.Horvath S. DNA methylation age of human tissues and cell types. Genome Biol. 2013;14:R115. doi: 10.1186/gb-2013-14-10-r115. [DOI] [PMC free article] [PubMed] [Google Scholar]
- 20.Bell JT, et al. Epigenome-wide scans identify differentially methylated regions for age and age-related phenotypes in a healthy ageing population. PLoS Genet. 2012;8:e1002629. doi: 10.1371/journal.pgen.1002629. [DOI] [PMC free article] [PubMed] [Google Scholar]
- 21.De Jager PL, et al. Alzheimer’s disease: early alterations in brain DNA methylation at ANK1, BIN1, RHBDF2 and other loci. Nat Neurosci. 2014;17:1156–63. doi: 10.1038/nn.3786. [DOI] [PMC free article] [PubMed] [Google Scholar]
- 22.Gjoneska E, et al. Conserved epigenomic signals in mice and humans reveal immune basis of Alzheimer’s disease. Nature. 2015;518:365–9. doi: 10.1038/nature14252. [DOI] [PMC free article] [PubMed] [Google Scholar]
- 23.Weiser MM. Intestinal epithelial cell surface membrane glycoprotein synthesis. I. An indicator of cellular differentiation. J Biol Chem. 1973;248:2536–41. [PubMed] [Google Scholar]
- 24.Kriukiene E, et al. DNA unmethylome profiling by covalent capture of CpG sites. Nat Commun. 2013;4:2190. doi: 10.1038/ncomms3190. [DOI] [PubMed] [Google Scholar]
- 25.Fang R, Olds LC, Sibley E. Spatio-temporal patterns of intestine-specific transcription factor expression during postnatal mouse gut development. Gene Expr Patterns. 2006;6:426–32. doi: 10.1016/j.modgep.2005.09.003. [DOI] [PubMed] [Google Scholar]
- 26.Diep D, et al. Library-free methylation sequencing with bisulfite padlock probes. Nat Methods. 2012;9:270–2. doi: 10.1038/nmeth.1871. [DOI] [PMC free article] [PubMed] [Google Scholar]
- 27.Bernstein BE, et al. The NIH Roadmap Epigenomics Mapping Consortium. Nat Biotechnol. 2010;28:1045–8. doi: 10.1038/nbt1010-1045. [DOI] [PMC free article] [PubMed] [Google Scholar]
- 28.An integrated encyclopedia of DNA elements in the human genome. Nature. 2012;489:57–74. doi: 10.1038/nature11247. [DOI] [PMC free article] [PubMed] [Google Scholar]
- 29.Gallego Romero I, et al. Herders of Indian and European cattle share their predominant allele for lactase persistence. Mol Biol Evol. 2012;29:249–60. doi: 10.1093/molbev/msr190. [DOI] [PubMed] [Google Scholar]
- 30.Li Y, et al. Genome-wide DNA methylome analysis reveals epigenetically dysregulated non-coding RNAs in human breast cancer. Sci Rep. 2015;5:8790. doi: 10.1038/srep08790. [DOI] [PMC free article] [PubMed] [Google Scholar]
- 31.Di Ruscio A, et al. DNMT1-interacting RNAs block gene-specific DNA methylation. Nature. 2013;503:371–6. doi: 10.1038/nature12598. [DOI] [PMC free article] [PubMed] [Google Scholar]
- 32.Magistri M, Faghihi MA, St Laurent G, 3rd, Wahlestedt C. Regulation of chromatin structure by long noncoding RNAs: focus on natural antisense transcripts. Trends Genet. 2012;28:389–96. doi: 10.1016/j.tig.2012.03.013. [DOI] [PMC free article] [PubMed] [Google Scholar]
- 33.Yu DH, et al. Developmentally programmed 3′ CpG island methylation confers tissue- and cell-type-specific transcriptional activation. Mol Cell Biol. 2013;33:1845–58. doi: 10.1128/MCB.01124-12. [DOI] [PMC free article] [PubMed] [Google Scholar]
- 34.Guo Y, et al. CRISPR Inversion of CTCF Sites Alters Genome Topology and Enhancer/Promoter Function. Cell. 2015;162:900–10. doi: 10.1016/j.cell.2015.07.038. [DOI] [PMC free article] [PubMed] [Google Scholar]
- 35.Ong CT, Corces VG. CTCF: an architectural protein bridging genome topology and function. Nat Rev Genet. 2014;15:234–46. doi: 10.1038/nrg3663. [DOI] [PMC free article] [PubMed] [Google Scholar]
- 36.Sheaffer KL, et al. DNA methylation is required for the control of stem cell differentiation in the small intestine. Genes Dev. 2014;28:652–64. doi: 10.1101/gad.230318.113. [DOI] [PMC free article] [PubMed] [Google Scholar]
- 37.Kaaij LT, et al. DNA methylation dynamics during intestinal stem cell differentiation reveals enhancers driving gene expression in the villus. Genome Biol. 2013;14:R50. doi: 10.1186/gb-2013-14-5-r50. [DOI] [PMC free article] [PubMed] [Google Scholar]
- 38.Lewinsky RH, et al. T-13910 DNA variant associated with lactase persistence interacts with Oct-1 and stimulates lactase promoter activity in vitro. Hum Mol Genet. 2005;14:3945–53. doi: 10.1093/hmg/ddi418. [DOI] [PubMed] [Google Scholar]
- 39.Domcke S, et al. Competition between DNA methylation and transcription factors determines binding of NRF1. Nature. 2015;528:575–9. doi: 10.1038/nature16462. [DOI] [PubMed] [Google Scholar]
- 40.Xiang JF, et al. Human colorectal cancer-specific CCAT1-L lncRNA regulates long-range chromatin interactions at the MYC locus. Cell Res. 2014;24:513–31. doi: 10.1038/cr.2014.35. [DOI] [PMC free article] [PubMed] [Google Scholar]
- 41.Hilton IB, et al. Epigenome editing by a CRISPR-Cas9-based acetyltransferase activates genes from promoters and enhancers. Nat Biotechnol. 2015;33:510–7. doi: 10.1038/nbt.3199. [DOI] [PMC free article] [PubMed] [Google Scholar]
- 42.Delaney L, Smith JP. Childhood health: trends and consequences over the life course. Future Child. 2012;22:43–63. doi: 10.1353/foc.2012.0003. [DOI] [PMC free article] [PubMed] [Google Scholar]
- 43.Belsky DW, et al. Polygenic risk and the development and course of asthma: an analysis of data from a four-decade longitudinal study. Lancet Respir Med. 2013;1:453–61. doi: 10.1016/S2213-2600(13)70101-2. [DOI] [PMC free article] [PubMed] [Google Scholar]
- 44.Yin H, et al. Genome editing with Cas9 in adult mice corrects a disease mutation and phenotype. Nat Biotechnol. 2014;32:551–3. doi: 10.1038/nbt.2884. [DOI] [PMC free article] [PubMed] [Google Scholar]
- 45.Platt RJ, et al. CRISPR-Cas9 knockin mice for genome editing and cancer modeling. Cell. 2014;159:440–55. doi: 10.1016/j.cell.2014.09.014. [DOI] [PMC free article] [PubMed] [Google Scholar]
- 46.Yeh KY, Yeh M, Holt PR. Intestinal lactase expression and epithelial cell transit in hormone-treated suckling rats. Am J Physiol. 1991;260:G379–84. doi: 10.1152/ajpgi.1991.260.3.G379. [DOI] [PubMed] [Google Scholar]
- 47.Goda T, Yasutake H, Tanaka T, Takase S. Lactase-phlorizin hydrolase and sucrase-isomaltase genes are expressed differently along the villus-crypt axis of rat jejunum. J Nutr. 1999;129:1107–13. doi: 10.1093/jn/129.6.1107. [DOI] [PubMed] [Google Scholar]
- 48.Royce TE, Carriero NJ, Gerstein MB. An efficient pseudomedian filter for tiling microrrays. BMC Bioinformatics. 2007;8:186. doi: 10.1186/1471-2105-8-186. [DOI] [PMC free article] [PubMed] [Google Scholar]
- 49.Buske OJ. Padlock-Pipeline. https://github.com/buske/padlock-pipeline, GitHub, 2015.
- 50.Krueger F, Andrews SR. Bismark: a flexible aligner and methylation caller for Bisulfite-Seq applications. Bioinformatics. 2011;27:1571–2. doi: 10.1093/bioinformatics/btr167. [DOI] [PMC free article] [PubMed] [Google Scholar]
- 51.Abecasis GR, et al. An integrated map of genetic variation from 1,092 human genomes. Nature. 2012;491:56–65. doi: 10.1038/nature11632. [DOI] [PMC free article] [PubMed] [Google Scholar]
- 52.Quinlan AR, Hall IM. BEDTools: a flexible suite of utilities for comparing genomic features. Bioinformatics. 2010;26:841–2. doi: 10.1093/bioinformatics/btq033. [DOI] [PMC free article] [PubMed] [Google Scholar]
- 53.Garber M, et al. Identifying novel constrained elements by exploiting biased substitution patterns. Bioinformatics. 2009;25:i54–62. doi: 10.1093/bioinformatics/btp190. [DOI] [PMC free article] [PubMed] [Google Scholar]
- 54.Ran FA, et al. Genome engineering using the CRISPR-Cas9 system. Nat Protoc. 2013;8:2281–308. doi: 10.1038/nprot.2013.143. [DOI] [PMC free article] [PubMed] [Google Scholar]
- 55.Ran FA, et al. Double nicking by RNA-guided CRISPR Cas9 for enhanced genome editing specificity. Cell. 2013;154:1380–9. doi: 10.1016/j.cell.2013.08.021. [DOI] [PMC free article] [PubMed] [Google Scholar]
- 56.Krzywinski M, et al. Circos: an information aesthetic for comparative genomics. Genome Res. 2009;19:1639–45. doi: 10.1101/gr.092759.109. [DOI] [PMC free article] [PubMed] [Google Scholar]
Associated Data
This section collects any data citations, data availability statements, or supplementary materials included in this article.