Abstract
Objectives
The purpose of this work was to measure and compare the iodine contrast-to-noise ratio (CNR) between a commercial energy-integrating-detector (EID) CT system and a photon-counting-detector (PCD) CT scanner capable of human imaging at clinical dose rates, as well as to determine clinical feasibility using human cadavers.
Materials & Methods
A research dual-source PCD-CT scanner was used, where the “A” tube/detector subsystem used an EID and the “B” tube/detector subsystem used a PCD. Iodine CNR was measured in 4 anthropomorphic phantoms, simulating 4 patient sizes, at 4 tube potential settings. Following biospecimen committee approval, PCD scans were performed on a fresh-frozen human head and a whole-body cadaver using clinical dose rates, repeated using the EID and identical parameters, and qualitative side-by-side comparisons performed.
Results
For the same photon fluence, phantom measurements demonstrated a mean increase in CNR of 11, 23, 31, 38% for the PCD system, relative to the EID system, at 80, 100, 120, and 140 kV, respectively. PCD-CT additionally provided energy-selective imaging, where low-and high-energy images reflected the energy dependence of the iodine signal. PCD images of cadaveric anatomy demonstrated decreased beam hardening and calcium blooming in the high-energy bin images and increased contrast in the low-energy bins images relative to the EID images. Threshold-based PCD images were qualitatively deemed equivalent in other aspects.
Conclusions
The evaluated research PCD-CT system was capable of clinical levels of image quality at clinical dose rates. It further provided improved CNR relative to state-of-the-art EID-CT. The energy selective bin images provide further opportunity for dual-and multi-energy analyses.
Keywords: Computed Tomography (CT), Photon-Counting CT, Spectral CT, Multi-Energy CT, Photon Counting Detectors
INTRODUCTION
Photon counting detectors (PCDs) have been proposed for use in computed tomography (CT) as a method of reducing radiation dose and improving material composition analysis (1–5). However, technical limitations have here-to-for restricted investigations to micro-and small-animal CT systems (6–9). Additionally, problems with detector stability and high count rates have presented significant technical challenges for the development of systems capable of human imaging (2, 7, 10).
Unlike conventional energy integrating detectors (EIDs), PCDs are capable of resolving incoming X-ray photons according to their individual energy. In PCD technology, impinging X-ray photons produce electron-hole pairs inside a semiconducting material. A bias voltage applied to the detector creates a strong electric field in the bulk material and attracts the electrons towards a pixelated anode, where an application specific integrated circuit (ASIC) transfers and shapes the charge pulses into voltage pulses. The amplitude of the pulses is approximately proportional to the energy of the absorbed incident X-ray photon (2, 10, 11).
The energy resolving nature of these PCD modules facilitates the generation of energy specific images. For each measured pulse, the amplitude is compared to a set of user-specified energy-thresholds. Pulses with energies greater than the specified low-energy threshold, but lower than the specified high-energy threshold, are used to form images that correspond to a specific energy-bin (11). An ideal energy bin only considers photons between the specified lower and higher thresholds; thus only photons with energy-values within the range of an energy bin determined by two neighboring energy-thresholds contribute to the signal. In practice, the ability to perfectly separate photons of different energies using PCD is impaired by physical effects such as K-escape, charge sharing, detector polarization, charge trapping, and high pulse rate effects in a high flux CT setup (2, 6, 7, 10–19). However, PCD-CT acquisitions can provide fewer beam hardening effects, do not suffer from the sharp increase in noise (e.g. electronic noise) at low photon counts, and offer an increase in dose efficiency (2, 4, 12, 14, 17, 20, 21).
A research PCD-CT system has been in development for several years (11, 22, 23) and was recently installed at (blinded for review). A complete physics evaluation of image quality and dose performance has been previously performed (24). These studies indicate the potential for use in human imaging at clinical dose rates. The purpose of this work was to measure and compare the iodine contrast-to-noise ratio (CNR) of a commercial EID-CT system and our research PCD-CT scanner, which is capable of human imaging at clinical dose rates, as well as to demonstrate clinical feasibility using human cadavers.
METHOD AND MATERIALS
Scanner Description
The research PCD-CT scanner used for this study, which is capable of human imaging at clinical doses, is based on a commercially available 128-slice dual-source CT system (SOMATOM Definition Flash, Siemens Healthcare, Forchheim, Germany). Using a commercial 78-cm wide gantry opening, the system is capable of imaging human-sized objects. The primary difference between the commercial and the research systems is the replacement of one of the dual-source scanner’s two EID arrays with one CdTe-based PCD array. This has been previously reported (11, 22, 23). The X-ray tubes and beam shaping filters of both systems are identical; however the in-plane field-of-view (FOV) of the PCD array is smaller (275 mm) than that of the EID detector (500 mm). This means that while the whole body can be positioned in the gantry, a smaller FOV is used for PCD imaging. There is no fundamental limitation requiring a smaller FOV for the PCD array; the limited size is merely a choice that was made in the design of this particular research system.
Quantitative evaluation of the research system’s PCD tube/detector pair was previously performed and compared to the physics performance of the EID tube/detector pair of the research scanner, the latter being identical to a commercially available SOMATOM Definition Flash scanner (24). The specifications of the research PCD-CT scanner, its two tube-detector subsystems, and the adjacent commercial EID-CT system used for comparison are given in Table 1.
Table 1.
Overview of the specifications of the commercial and research scanners.
| Specification | Commercial Subsystem A | Commercial Subsystem B | Research Subsystem A | Research Subsystem B |
|---|---|---|---|---|
| Detector type | EID | EID | EID | PCD |
| Tube type | STRATON® | |||
| Tube voltages (kV) | 70, 80, 100, 120, 140 | 80, 100, 120, 140 | ||
| Rotation time (s) | 1.0, 0.5, 0.33, 0.28 | 1.0, 0.5 | ||
| Projections / rotation | 2304 | |||
| Gantry opening (mm) | 780 | |||
| In plane field of view (FOV, mm) | 500 | 325 | 500 | 275 |
| Detector pixel size in Z dimension (mm) | 0.6 | 0.6 | 0.6 | 0.5 |
| Maximum Z collimation | 64 × 0.6 mm | 64 × 0.6 mm | 64 × 0.6 mm | 32 × 0.5 mm |
| z-coverage (mm) | 38.4 | 38.4 | 38.4 | 16.0 |
The PCD-CT system was comprised of 1.6 mm thick CdTe semiconducting sensors. Each detector pixel was comprised of 16 (4 × 4) subpixels, each with an effective individual pitch of 0.225 mm. An anti-scatter collimator grid was placed between each pixel (every fifth subpixel) for in-plane scatter suppression. The effective pixel size along the z-axis at the isocenter was 0.5 mm.
In order to image objects with sizes exceeding the PCD FOV, the truncated projections of the PCD subsystem were filled in with data acquired in a separate acquisition using the 500 mm FOV EID array. This 2nd scan acquisition using the EID array is referred to as a data completion scan (DCS). This technique results in PCD data within the PCD FOV, EID data outside the PCD FOV, and avoids truncation artifacts that would otherwise occur from imaging an adult patient with the smaller FOV of the PCD array.
Each subpixel of the PCD array provides two energy-thresholds; the lower threshold TL is adjustable in a range from 20 to 50 keV and the higher threshold TH is adjustable in a range from 50 to 90 keV. In this work, the energy-resolved readout of the PCD array occurred in the so called “macro mode,” in which every subpixel used identical low and high energy thresholds. Reconstructed data from this mode provided 4 image sets: 2 threshold-based image-sets and 2 bin-based image-sets, where the bin 1 image set was reconstructed using all photons between TH and TL, and the bin 2 image set was reconstructed using only measurements where the photon energy exceeded TH (hence bin 2 images are equivalent to TH images).
Measurement of contrast, noise and contrast-to-noise ratio (CNR)
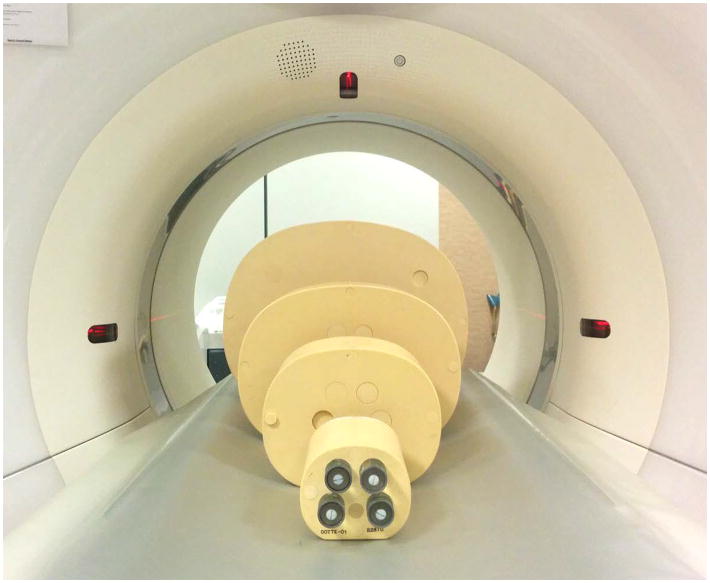
This study was designed to measure the iodine CNR of the PCD-CT system as a function of tube-current-time-product and tube potential, and to compare the results to those from a commercial EID-CT scanner (SOMATOM Definition Flash, Siemens Healthcare, Forchheim, Germany). Four anthropomorphic abdominal phantoms (CIRS, Inc, Norfolk, VA) with lateral widths of 10.6, 20.5, 30.0, and 38.7 cm were used to mimic a newborn, a 10 year old, a small adult and a large adult, respectively (Figure 1 (a)). Each phantom contained four Lucite vials filled with four iodine solutions with concentrations of approximately 5, 10, 15, and 20 mgI/mL. The solutions were chosen to provide CT-values of approximately 150, 300, 450, and 600 HU for a reference scan of the 20.4 cm phantom on the EID-CT using a tube voltage of 120 kV. A spine-mimicking material was located posteriorly, with a CT number of approximately 740 HU at 120 kV. All phantoms were aligned with the center of the phantom positioned at scanner isocenter.
Figure 1.
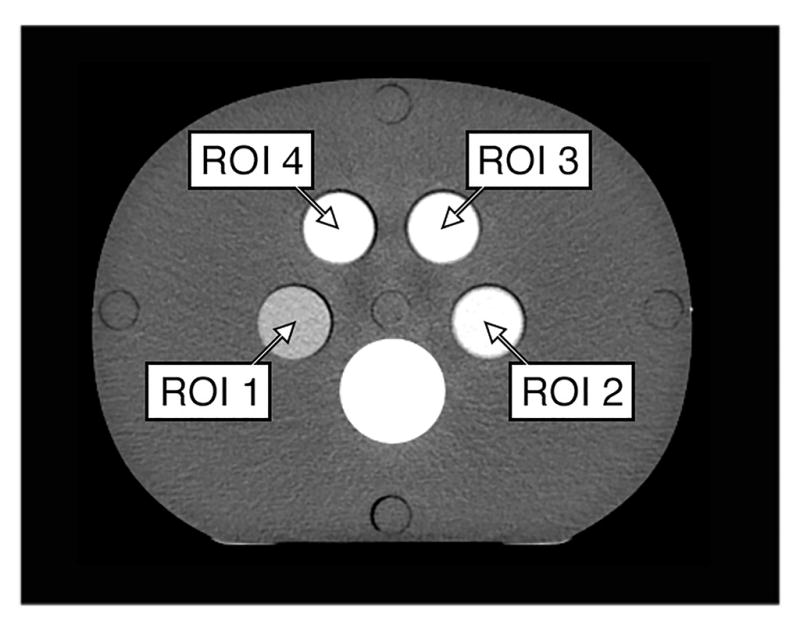
(a) Experimental setup. Four anthropomorphic phantoms containing four different iodine solutions in each phantom. Each phantom was scanned separately in order to center each phantom at scanner isocenter. (b) In a reference scan (EID system, 140 kV, 200 mAs) the solutions provided CT-numbers of approximately 150 HU in region-of-interest 1(ROI 1), 300 HU in ROI 2, 450 HU in ROI 3, and 600 HU in ROI 4.
Measurements were acquired on both the commercial EID-CT system and the research PCD-CT system with tube potentials of 80, 100, 120, and 140 kV. Data were collected for tube current-time product values of 50, 100, 150, 200, 250, 300, 350, 400, 500, and 550 mAs for each tube potential and phantom size on both the EID and PCD systems. All scans used a clinical abdominal sequential protocol with an identical body beam shaping (“bowtie”) filter, ensuring identical photon fluence to both detectors. The rotation time was 1 s for both systems in order to achieve very high tube-current-time-products. The collimation was set to 32 × 1.2 mm for the EID system and 32 × 0.5 mm for the PCD system (identical collimation settings were not available). Neither collimation setting used the flying focal spot technique. Table 2 details the scan parameters used for the phantom scans. The volume CTDI (CTDIvol) reported by the scanner console, which was previously verified with ionization chamber measurements by our clinical physics group, was recorded for each acquisition (Table 3). The differences in CTDIvol for the same tube-current-time-product and tube potential, using the same x-ray tube, geometry and bow-tie filter, are due to decreases in dose efficiency (hence higher CTDIvol values) for more narrow collimations.
Table 2.
Acquisition and reconstruction parameters used to scan the phantoms.
| Parameter | System A (EID) | System B (PCD) |
|---|---|---|
| Detector collimation | 32 × 1.2 mm | 32 × 0.5 mm |
| Tube potential (kV) | 80, 100, 120, 140 | |
| Tube current (mA) | 50, 100, 150, 200, 250, 300, 350, 400, 500, 550 | |
| Rotation time (s) | 1.0 | |
| Acquisition FOV (mm) | 500 | 275 |
| Scan mode | Sequential | |
| Image thickness (mm) | 6.0 | |
| Image interval (mm) | 6.0 | |
| Reconstruction kernel | D40 | |
| Reconstruction FOV (mm) | 275 | |
Table 3.
CTDIvol(32 cm) for four different tube potentials and a tube-current-time-product of 100 mAs. CTDIvol values for higher tube-current-time-products scale linearly. The small difference between the two systems is due to the different detector collimations used (EID, 32 × 1.2 mm; PCD, 32 × 0.5 mm). The EID detector’s total detector coverage is greater, hence the CTDIvol is about 10% less, as wider collimation settings are more dose efficient.
| Tube Potential (kV) | EID CTDIvol (mGy) | PCD CTDIvol (mGy) |
|---|---|---|
| 80 | 2.0 | 2.2 |
| 100 | 4.2 | 4.6 |
| 120 | 6.9 | 7.6 |
| 140 | 10.1 | 11.1 |
The PCD system was operated with energy thresholds of TL = 25 keV and TH = 65 keV; these settings provide approximately equal photon counts in each of the low-and high-energy bins at a tube potential setting of 140 kV. The final images were reconstructed applying a weighted filter backprojection (WFBP) algorithm using a quantitative, medium sharp reconstruction kernel (D40) (25, 26). This reconstruction method ensures a firm basis for image quality comparison since it avoids non-linear effects on the contrast, noise and spatial resolution of the reconstructed images. An image thickness of 6 mm was selected for analysis in order to use the same image thickness for both the 0.5 and 1.2 mm collimation data while also fully utilizing all acquired photons (i.e. it was the smallest image thickness that could be divided into integer multiples of the two underlying collimations). The EID system used the same reconstruction algorithm as that of the PCD system such that in-plane spatial resolution was matched when reconstruction kernels of the same name were selected on both systems.
The CNR values in each EID-CT image and each low-energy threshold PCD-CT image were calculated for each phantom size and contrast vial by first measuring the mean of CT numbers in each ROI shown in Figure 1b. Measurements were repeated in 10 consecutive images and mean values were recorded. The image noise was measured in two adjacent images that were subtracted from each other to remove any structured noise components. The resulting noise measurement was divided by the square root of 2 to compensate for the quadrature noise addition that occurs when images are subtracted from one another (27). Iodine contrast was calculated as the difference between the mean CT number of iodine and the tissue-mimicking phantom material, and CNR was then calculated as the ratio of the mean iodine contrast to the measured noise. The CNR values as a function of tube-current-time-product were compared between the EID-CT and PCD-CT systems.
Energy selective bin image data
Each PCD-CT scan resulted in 2 threshold image sets and 2 bin image sets (since TH thresholds images are equivalent to bin 2 images, this results in only 3 unique image sets per scan). The CT numbers were measured in each vial for all images using the four ROI shown in Figure 1b. These values represent the iodine contrast for the specific photon energies used to form the image. The CT numbers of the iodine vials in the PCD images were compared to the CT numbers in iodine in the EID images.
Human Cadaveric Scanning
With approval of (blinded for review) institutional biospecimen committee, a human cadaver was obtained from the local Department of Anatomy. The unembalmed, frozen cadaver was of a 76 year old female, who had died from metastatic lung cancer and had donated her body for medical research. A separate fresh-frozen human head was also obtained. This patient died from end stage chronic obstructive pulmonary disease.
Using typical clinical parameters, CT scans of the cadaver’s head, thorax, abdomen and pelvis, and extremities were performed on both the EID and the PCD subsystems of the research PCD-CT systems (Table 4). This ensured that the specimens were in the identical position for the EID and PCD scans. For the PCD subsystem, macro mode was used to acquire the data and both threshold and bin images were produced. Images were reconstructed using the WFBP technique. This process was repeated for scanning of the separate human head (Table 5). A different pitch was used for the EID subsystem only because that value was programmed into the scanner as the default value and did not get adjusted to match the default values for the PCD subsystem; there was no specific reason for the pitch values to differ. Fortunately, because the Siemens’ scanners are designed to maintain constant image quality (e.g. noise, in plane and z axis resolution) as pitch is varied, we do not consider this a limitation of the results presented here.
Table 4.
Acquisition and reconstruction parameters used to scan the whole body cadaver. All parameters were identical for the head and body scans, unless otherwise noted.
| Parameter | Subsystem A (EID) | Subsystem B (PCD) |
|---|---|---|
| Detector collimation | 32 × 1.2 mm (thorax) 32 × 1.2 mm (abd/pel) 64 × 0.6 mm (legs) |
32 × 0.5 mm |
| Tube potential (kV) | 140 | 140 |
| Tube current (mA) – head | not performed | 400 |
| Tube current (mA) – body | 180 (thorax) 240 (abd/pel) 250 (legs) |
180 (thorax) 240 (abd/pel) 250 (legs) |
| CTDIvol (mGy) – head, 16 cm | not performed | 101.4 |
| CTDIvol (mGy) – body, 32 cm | 17.7 (thorax) 23.6 (abd/pel) 24.6 (legs) |
20.0 (thorax) 26.6 (abd/pel) 27.7 (legs) |
| Rotation time (s) | 1.0 | 1.0 |
| Acquisition FOV (mm) | 500 | 275 |
| Scan mode | Spiral | Spiral |
| Spiral pitch | 1.2 (thorax) 0.6 (abd/pel) 0.8 (legs) |
0.5 |
| Image thickness (mm) | 5.0 | 5.0 |
| Image interval (mm) | 5.0 | 5.0 |
| Reconstruction kernel | D30 | D30 |
| Recon. FOV (mm) – head | 200 | 200 |
| Recon. FOV (mm) – body | 275 | 275 |
Table 5.
Acquisition and reconstruction parameters used to scan the isolated cadaveric head.
| Parameter | Subsystem A (EID) | Subsystem B (PCD) |
|---|---|---|
| Detector collimation | 64 × 0.6 mm | 32 × 0.5 mm |
| Tube potential (kV) | 140 | |
| Tube current (mA) | 550 | 550 |
| CTDIvol (mGy) – Head, 16 cm | 124.5 | 139.4 |
| Rotation time (s) – head | 1.0 | |
| Acquisition FOV (mm) | 500 | 275 |
| Scan mode | Spiral | |
| Spiral pitch | 0.6 | |
| Image thickness (mm) | 5.0 | |
| Image interval (mm) | 5.0 | |
| Reconstruction kernel | D40 | |
| Reconstruction FOV (mm) | 200 | |
Board certified radiologists specializing in imaging of the head (neuroradiologists) and body (thoracic and abdominal radiologists) independently reviewed the images in a blinded fashion and were asked to state whether the images were essentially equivalent to each other, or, if one set was superior to the other, to identify the superior images.
Statistical Analysis
The mean iodine contrast, image noise, and iodine CNR were compared between PCD and EID systems for each tube potential and dose level. The coefficients of variation for these measurements were determined by expressing the standard deviation as a percentage of the mean values. At each tube potential, a Wilcoxon signed rank test was performed to compare the iodine CNR between PCD and EID systems, with p < 0.05 considered to be statistically significant.
RESULTS
Contrast, noise and CNR
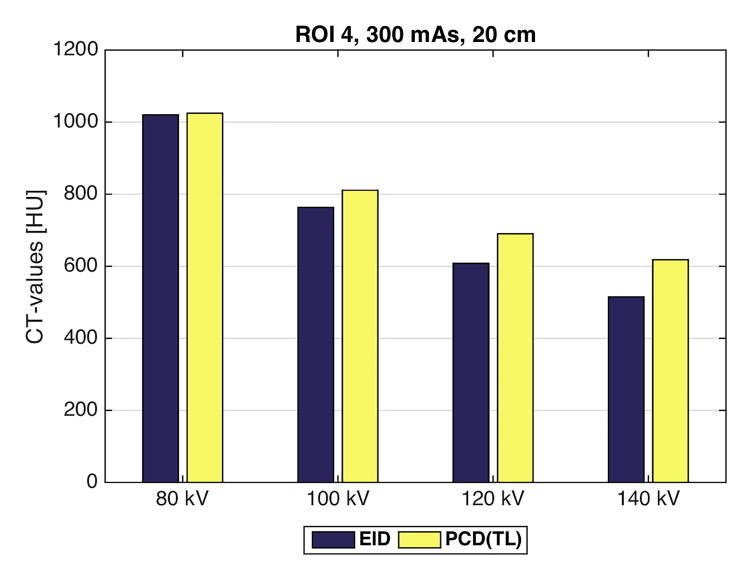
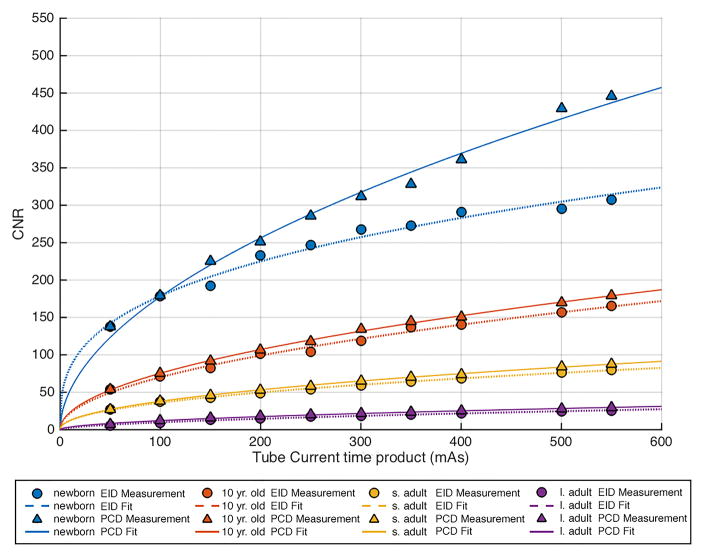
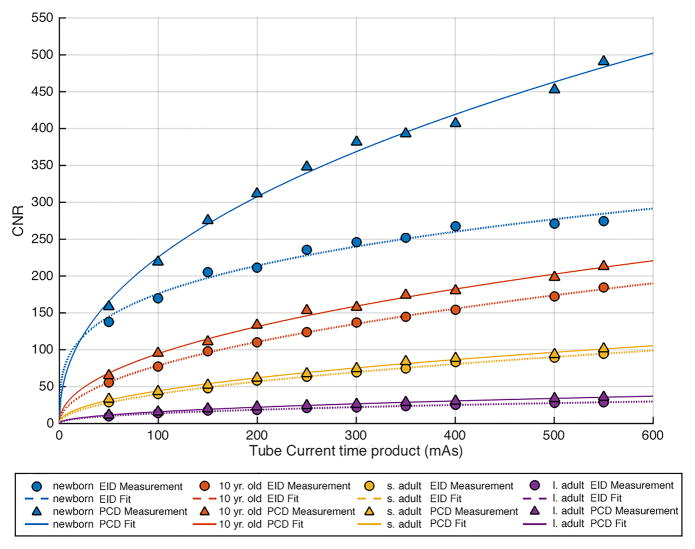
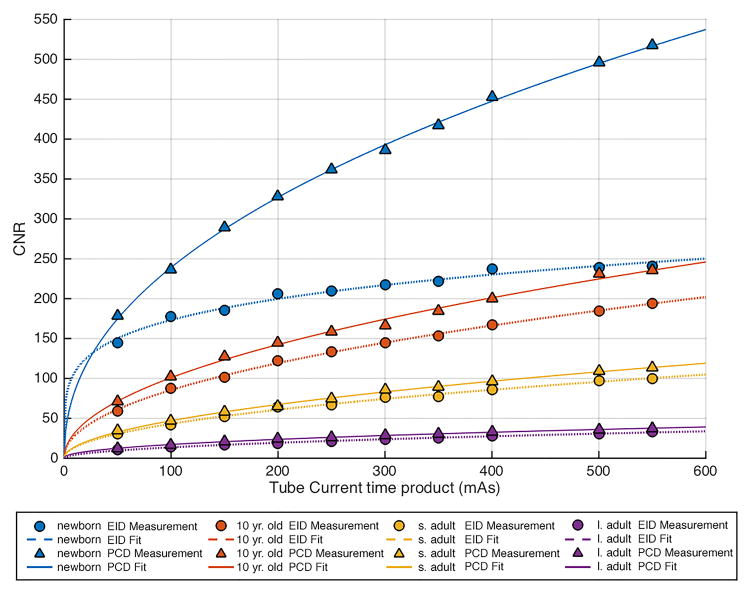
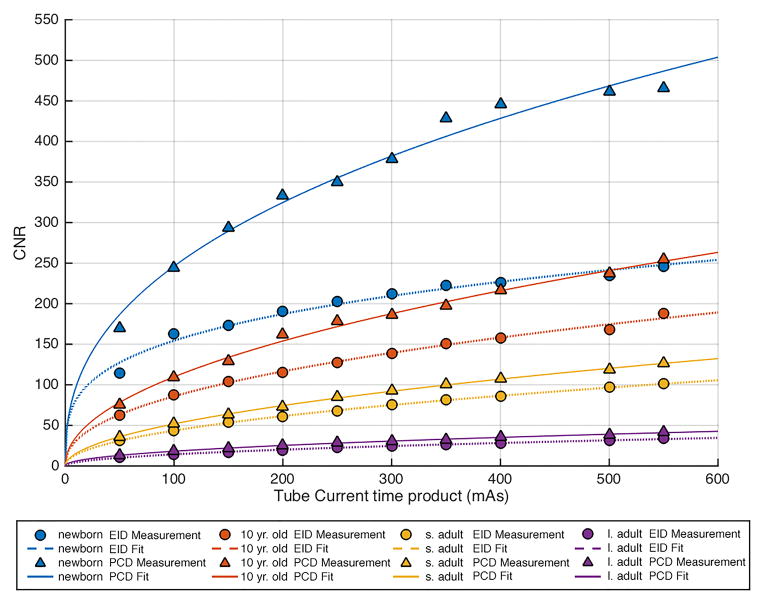
The CT number of iodine (Figure 2), image noise (Figure 3) and CNR (Figure 4) measured in the EID and PCD data (plotted versus tube-current-time product for Figure 3 and 4) for each tube potential and/or phantom size demonstrated the following key results:
Figure 2.
Comparison of the CT numbers measured in region of interest 4 for the energy integrating detector (EID) and the low energy threshold (TL = 25 keV) image from the photon counting detector (PCD) for four tube potentials (80, 100, 120, 140 kV). At 80 kV, the iodine signal is nearly the same for the EID and PCD(TL) images. However, as the tube potential increases, the iodine signal in the PCD(TL) images is increasingly greater than the iodine signal in the EID images. Shown here are the CT-values for the 20 cm phantom at 80, 100, 120, or 140 kV and 300 mAs.
Figure 3.
Comparison of image noise versus tube-current-time-product between the energy integrating detector (EID) images and the low energy threshold (TL) images from the photon counting detector (PCD) for the 40 cm (large adult) phantom. The noise was very similar between the two systems, albeit consistently a small amount higher for the EID system. The four curves are for the four tube potential settings (80, 100, 120, 140 kV).
Figure 4.
Comparison of contrast to noise ratio (CNR) versus tube-current-time-product (mAs) in each of the 4 phantom sizes between the energy integration detector (EID) images and the low energy threshold (TL) images from the photon counting detector (PCD). (a) 80 kV, (b) 100 kV, (c) 120 kV, (d) 140 kV. The iodine CNR in the PCD(TL) images was consistently greater than the iodine CNR in the EID images. s. adult = small adult, l. adult = large adult.
At low tube potentials, the difference in iodine contrast between the EID and PCD systems was minimal. As tube potential increased, the contrast in the PCD system exceeded that of the EID system. Even though absolute contrast values decreased with increasing tube potential and increasing phantom size, the relative decrease was smaller for the PCD system than for the EID system. This behavior was unaffected by increasing or decreasing the tube current time product (data not shown).
Noise behaved as expected in both systems. Specifically, noise increased with increasing phantom size and decreasing tube potential and current (Figure 3 shows the results for the measurement of the TL images of the 40 cm phantom). The noise vs. tube-current-time-product data points followed the expected exponential relationship, with power around -0.5 (fitted lines in Figure 3). At lower tube potential settings, photon starvation artifacts were observed for measurements obtained in the largest phantom size. For all tube-current-time-products and phantom sizes evaluated per tube potential setting, the difference in image noise between the EID and PCD system was minimal, ranging from 0.0 to 3.8 HU for 80 kV, 0.0 to 3.0 HU for 100 kV, 0.0 to 2.8 HU for 120 kV, and 0.1 to 2.2 HU for 140 kV.
The coefficient of variations for ROI measurements (contrast, noise, and CNR), were small and hence error bars were not shown in Figures 3–5. Typical values for the coefficients of variation were below 1%, with a maximum value of 2.5%.
Figure 5.
CT numbers measured in region of interest (ROI) 4, which contained iodinated contrast media, show an increase in CT numbers in the lower energy Bin 1 (B1) of the photon counting detector (PCD) system and a decrease in the higher energy Bin 2 (B2) of the PCD system relative to the energy integrating (EID) system. Shown here are the CT-values for the 20 cm phantom at 300 mAs.
CNR was significantly (p < 0.05) higher in the PCD system relative to the EID system for all tube potentials, the mean (± standard deviation) improvement was 11 ± 11%, 23 ± 18%, 31 ± 28% and 38 ± 24% at 80,100,120, and 140 kV, respectively. The increase in CNR for the PCD system relative to the EID system was greatest at higher tube potential settings. The CNR vs. tube-current-time-product data points followed the expected exponential relationship, with power close to 0.5 (fitted lines in Figure 4).
Energy selective bin image data
The CT numbers in the iodinated contrast material that were measured in the low-energy bin images of the PCD system were higher in all cases than those measured for the EID system (Figure 5 illustrates these results for the mean CT numbers of ROI 4 in a 20 cm phantom, 300 mAs, and varying tube potential settings). Conversely, the CT numbers in the iodinated contrast material that were measured in the high-energy bin images of the PCD system were lower in all cases than those measured for the EID system (Figure 5). Comparing CT numbers among the four PCD data sets, low-energy bin images have the highest CT number, followed by the low-energy threshold images. The high-energy bin and high-energy threshold images, which are identical by definition, both had lower CT number than the low-energy bin images and low-energy threshold images. These data demonstrate the energy dependence of CT numbers in PCD images.
First PCD-CT images of human anatomy
The images of a human body acquired with a PCD subsystem were deemed to have equivalent clinical image quality relative to current EID subsystem (Figure 6). The thorax, abdomen and pelvis images, where the anatomic dimensions exceed the PCD subsystem’s FOV of 275 mm, were free of truncation artifacts. Smaller areas, such as the extremities, did not demonstrate artifacts associated with pulse pile-up or other high flux rate effects, which might be expected at the higher flux rates measured through thinner anatomy. All images were free of ring-artifacts.
Figure 6.
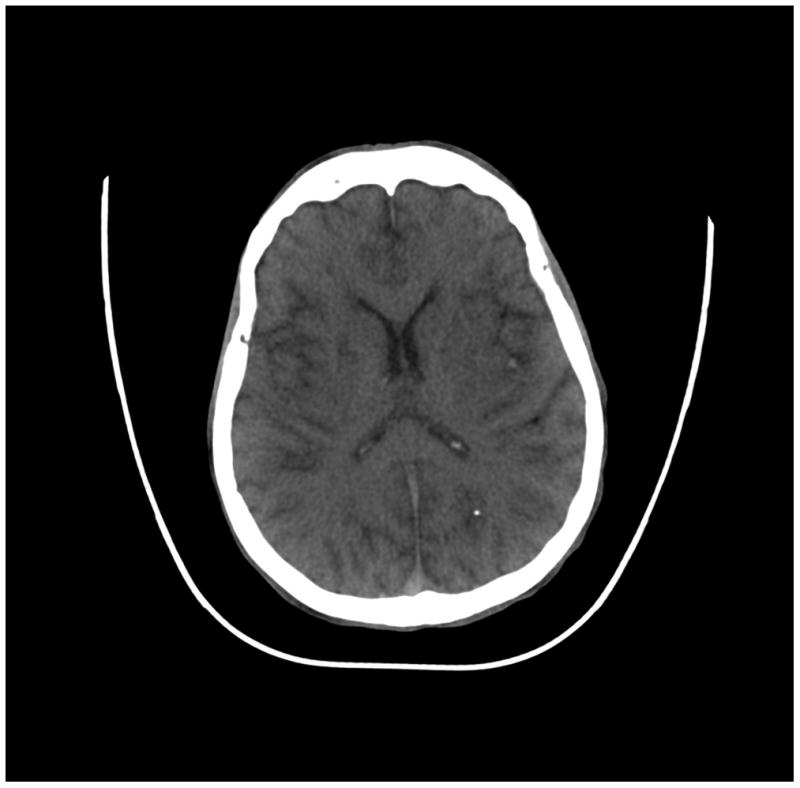
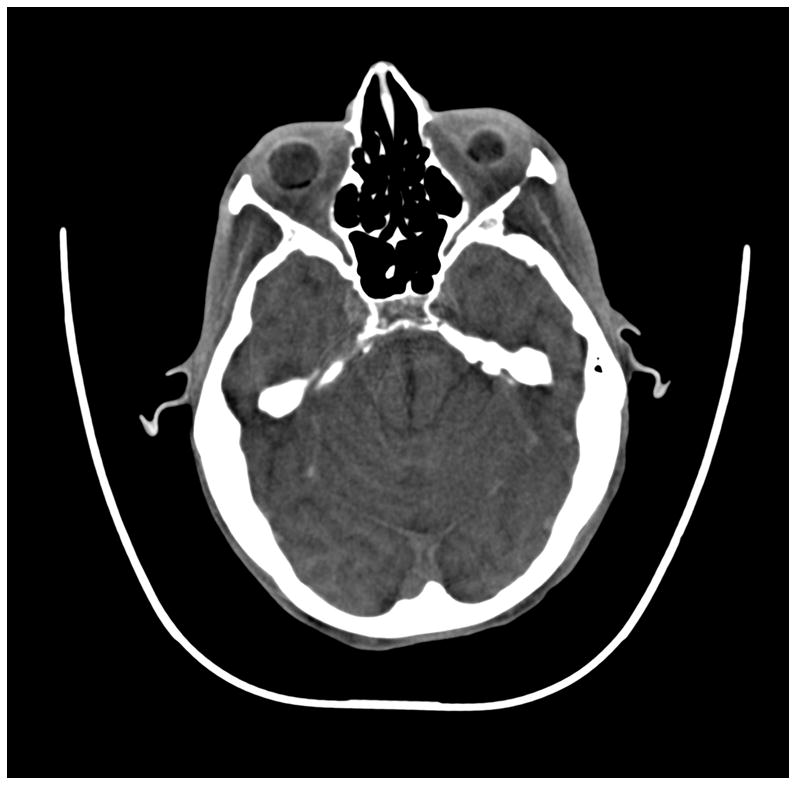

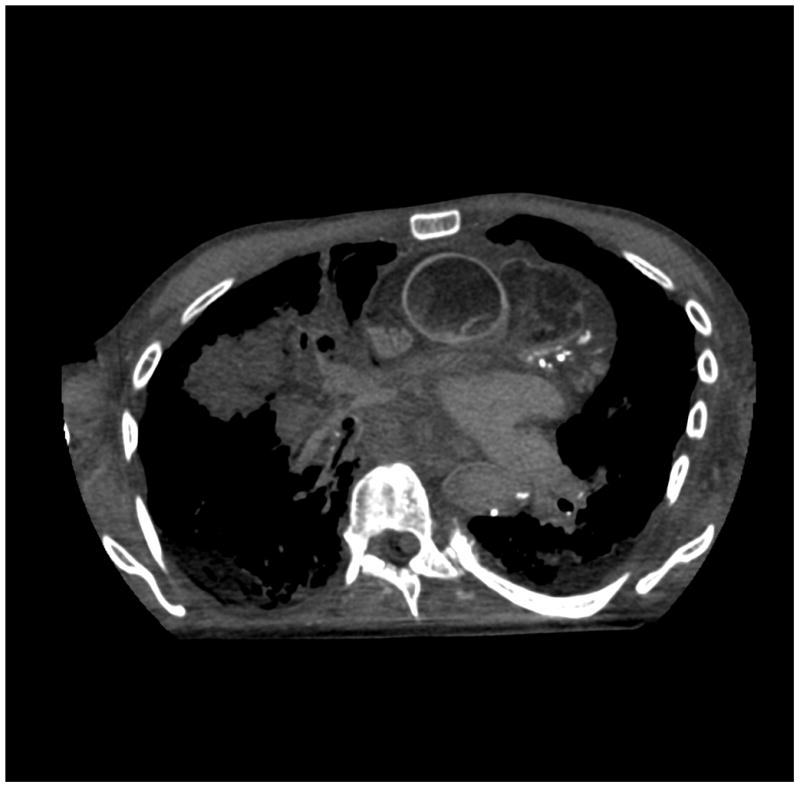

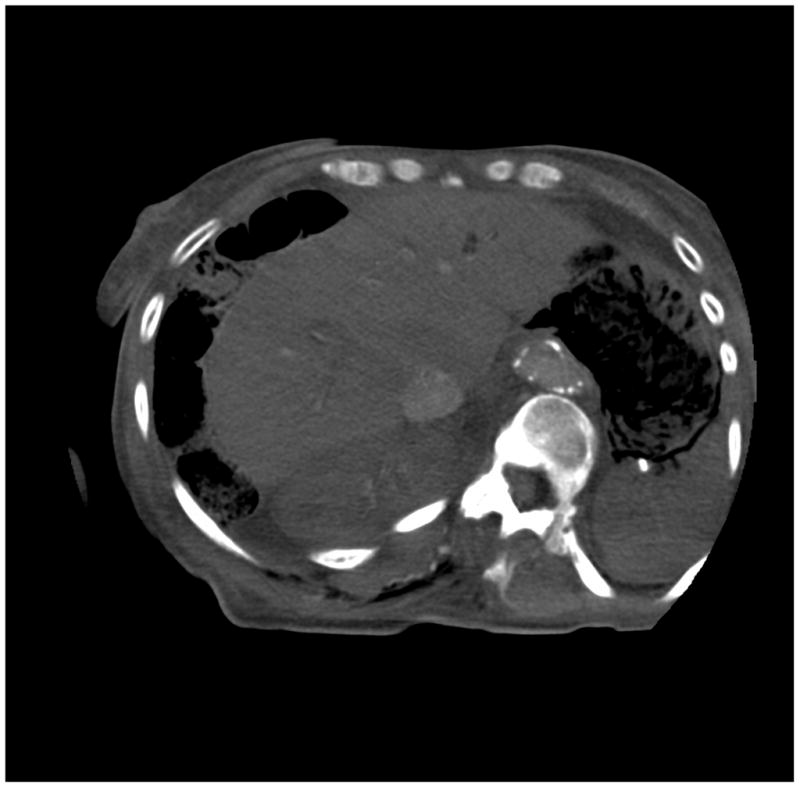
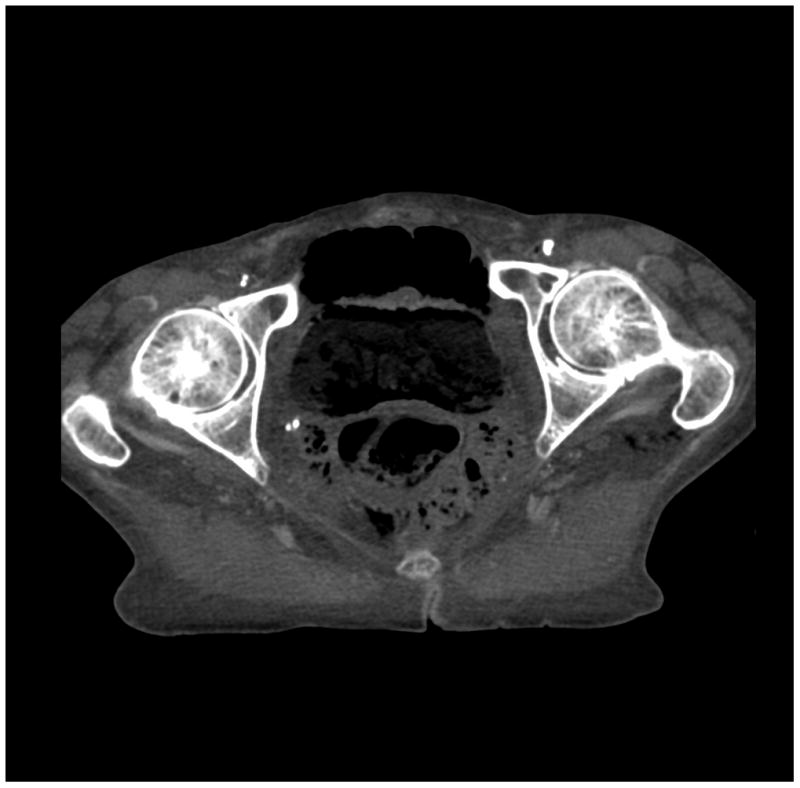
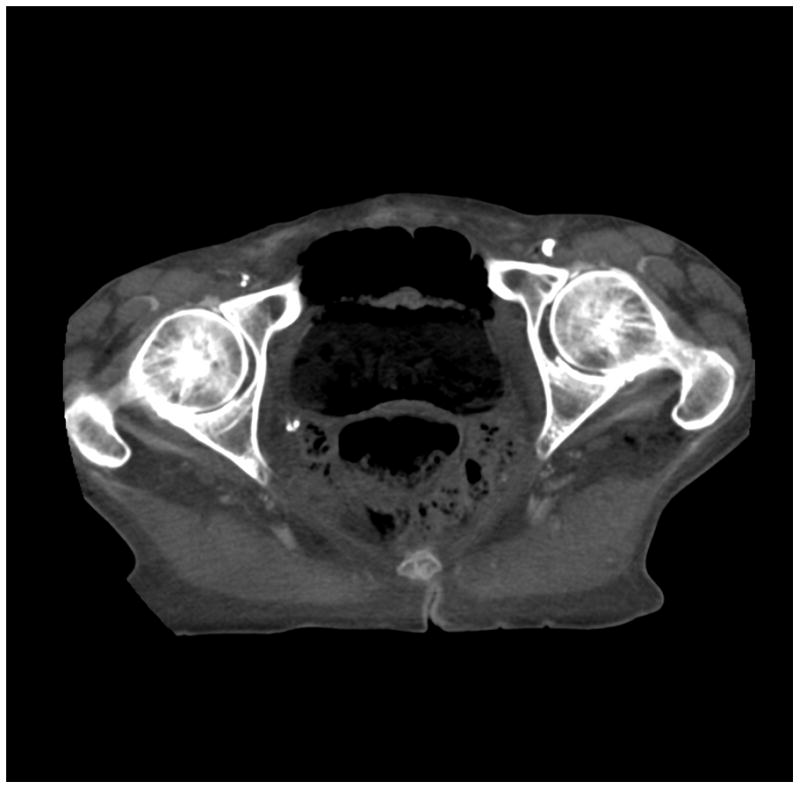
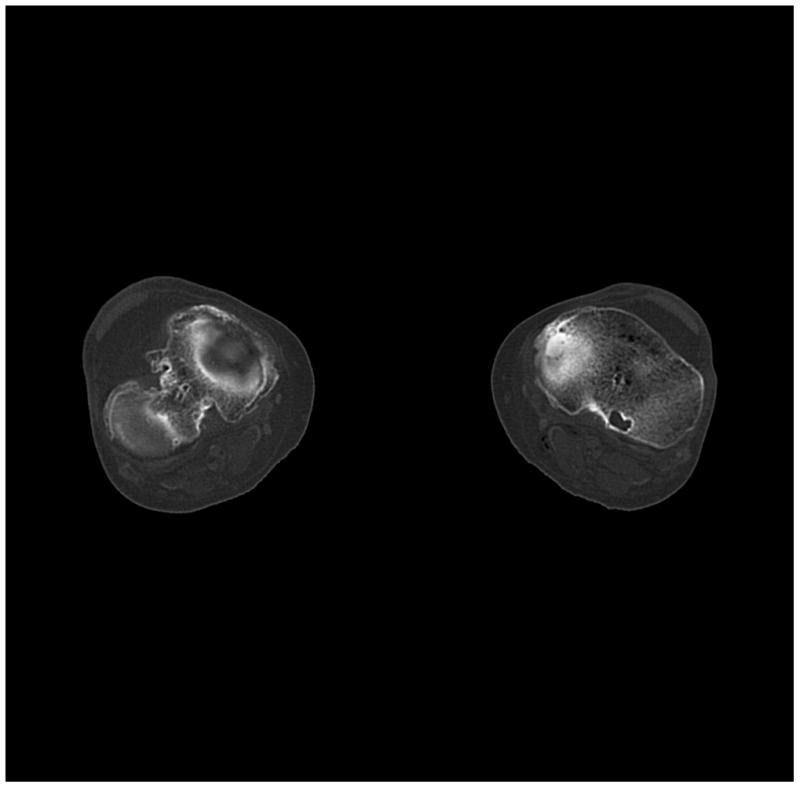
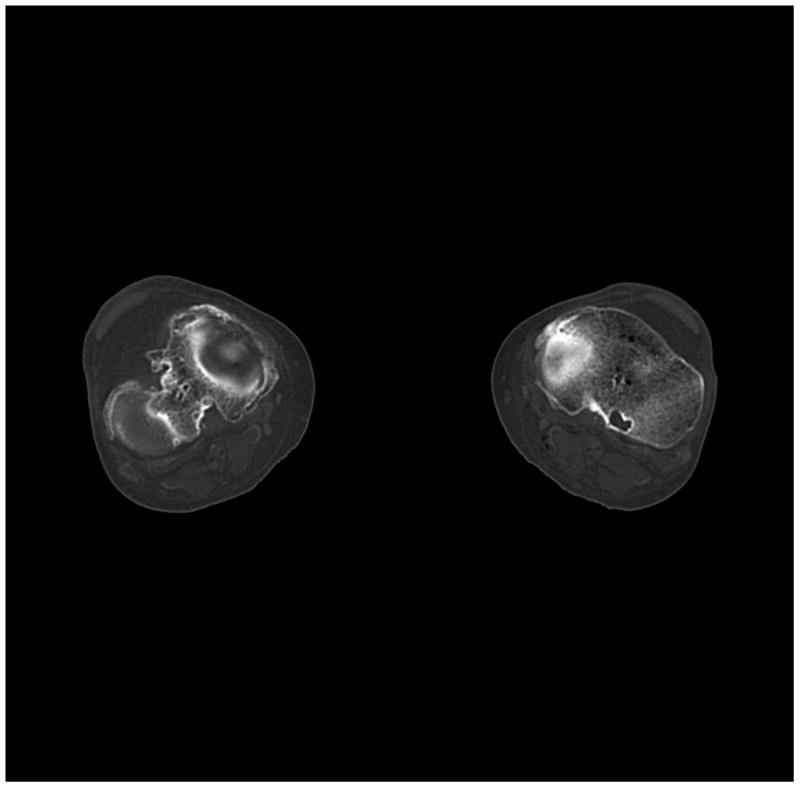
(a) cerebrum, (b) posterior fossa, (c,d) thorax, (e,f) abdomen, (g,h) pelvis and (i,j) legs of a female human cadaver scanned with the EID (c,e,g,i) and PCD (a,b,d,f,h,j) subsystems. The image quality was deemed to be equivalent between the two subsystems by the radiologist viewers. EID head images were not acquired at the same settings as for the PCD subsystem and are thus not included. Figures 7 and 8 provide EID to PCD comparisons for the head.
Comparing the PCD images to the EID images, the following differences were noted:
The bin 2 (high energy) images of the posterior fossa showed considerably less beam hardening artifact between the areas of dense bone (Figure 7) than the EID images and the bin 1 PCD images. Note: algorithmic water beam hardening corrections were applied to the images, but 2nd order bone beam hardening corrections were not. Thus, beam hardening artifacts that normally required additional processing to remove were not present in the unprocessed high-energy PCD data.
The high-Z material contrast (bone) of the bin 1 (low energy) PCD images was higher than that of the EID-system, in agreement with the phantom measurements (Figures 7 and 8).
The skull/brain interface was much sharper in the bin 2 (high energy images) of the PCD system compared to the EID system and bin 1 of the PCD system (Figure 8). This was presumably due to decreased calcium blooming effects.
Figure 7.


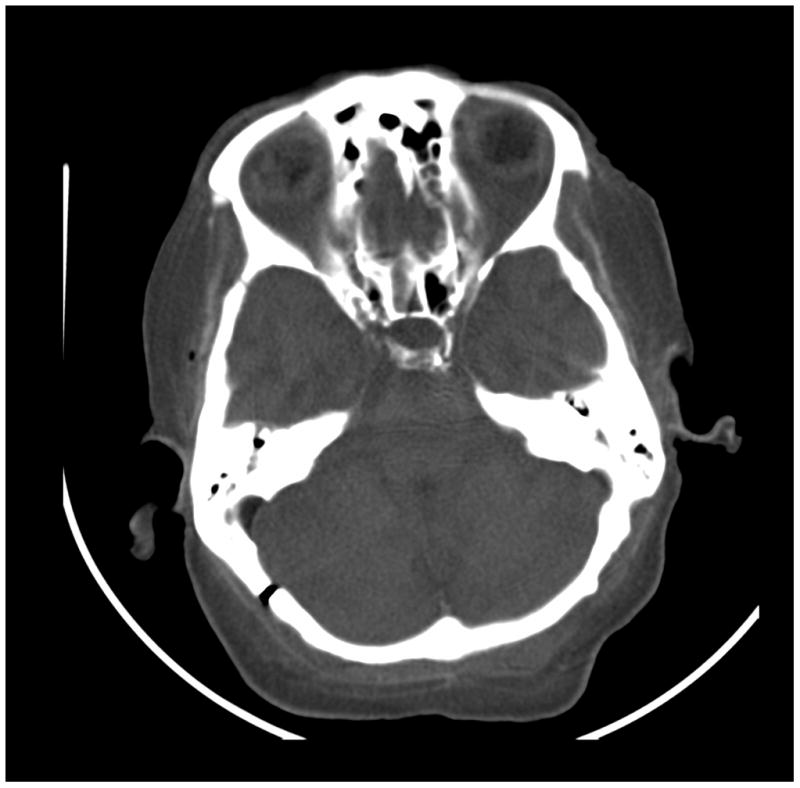
Images of a cadaver head. (a) energy integrating detector (EID) images, (b) photon counting detector (PCD) images (low energy bin), (c) PCD images (high energy bin). The high-energy images of the posterior fossa acquired using the PCD subsystem showed considerably less beam-hardening artifact between the areas of dense bone than the EID image and low energy PCD image. While water beam hardening corrections were applied to the images as part of the normal image reconstruction, 2nd order bone beam hardening corrections were not applied here. This was done to demonstrate that beam-hardening artifacts that normally require algorithmic correction were not present in the uncorrected high-energy PCD image.
Figure 8.
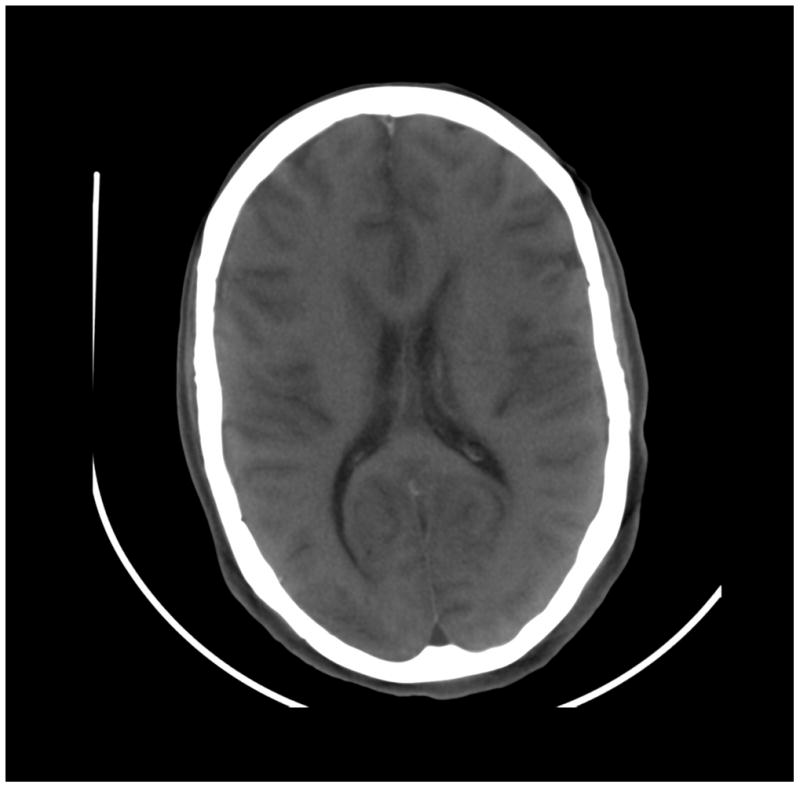
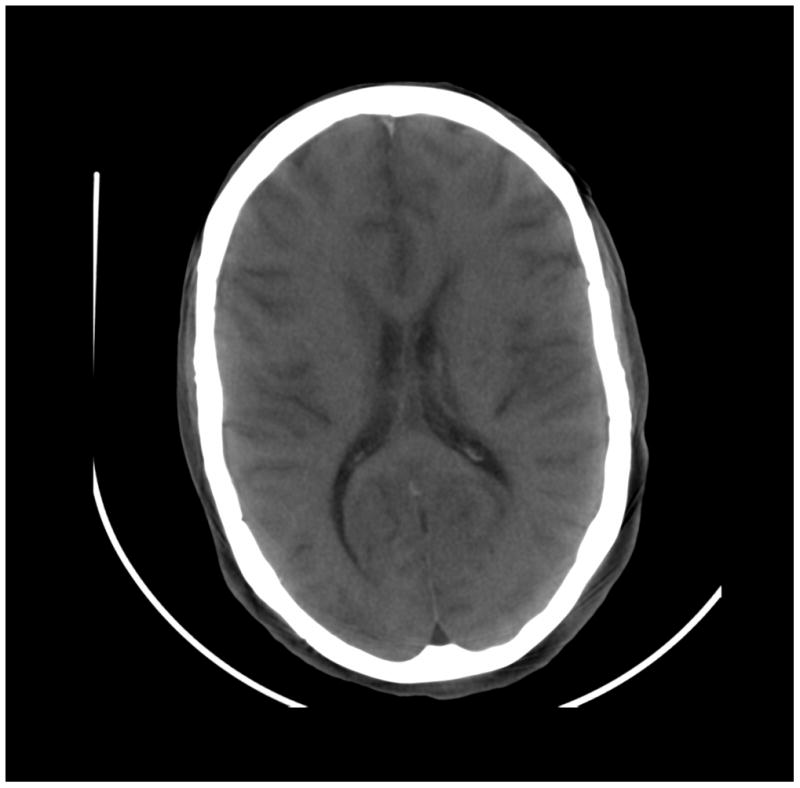
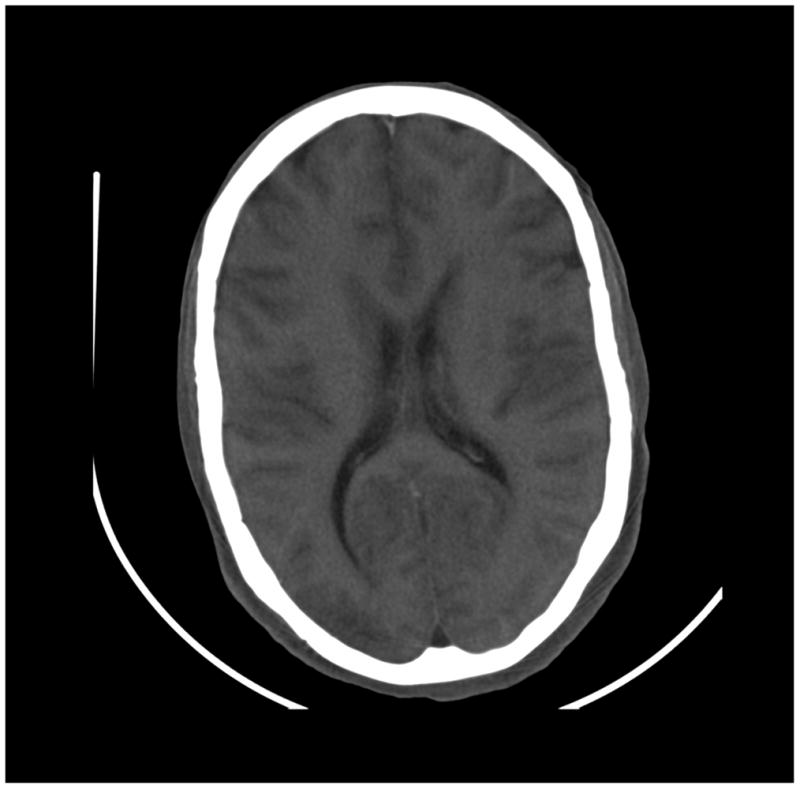
Images of a cadaver head. (a) energy integrating detector (EID) images, (b) photon counting detector (PCD) images (low energy bin), (c) PCD images (high energy bin). The skull/brain interface was much sharper in the high energy bin PCD image compared to the EID image and low energy bin PCD image.
DISCUSSION
Several characteristics of PCDs make them of significant interest for medical CT imaging, including relative immunity to electronic noise, enhanced iodine contrast, and decreased beam hardening and calcium blooming artifacts. Additionally, their ability to resolve photons of different energy ranges allows for acquisition of multi-energy data sets, which can be used for material decomposition and quantitative material analyses. In this work we demonstrated three important findings. First, the iodine contrast and CNR were superior for PCD relative to EID, particularly at higher tube potentials, which are necessary when imaging moderate to extremely large size patients. This may allow, for example, reduction of the applied radiation dose while maintaining the same iodine CNR. Second, PCD-CT produced images in energy selective energy bins. In the example provided here with two energy bins, dual-energy processing from a single, simultaneous data acquisition would be possible. This avoids the need for a second x-ray source, dual layer detector, or the use of tube-potential switching. The energy thresholds can be freely chosen (within the allowable ranges) to tailor the acquisition to the desired dual-or multi-energy analysis. In this study, our thresholds were chosen to obtain similar photon statistics in each bin image for a tube potential of 140 kV. Other choices would allow, for example, techniques such as k-edge subtraction. Third, we have shown the first images of a human body acquired using a PCD-CT system capable of operating at clinical photon fluence levels (e.g. 550 mAs). These images demonstrated equivalent image quality relative to an EID CT system. With respect to the contrast of high-Z materials, and beam hardening or calcium blooming artifact, the high energy PCD images were superior to the EID images.
In conventional EID systems, detector signal is proportional to the energy deposited by the incoming photons; consequently, higher energy photons are more strongly weighted than lower energy photons. The detector signal in PCD systems, however, is proportional to the number of detected photons. Therefore, lower energy photons have higher weights in PCD system compared to EID system, which consequently generates higher contrast for high-Z materials. Results from our study demonstrated the increased contrast and CNR of iodine solutions using PCD-CT in comparison with EID-CT. We also found that the contrast improvement was more obvious for exams performed at high tube potentials, where the spectrum covered a wider range of photons; it was less obvious for exams performed at low tube potentials due to the more narrow and predominantly low energy spectrum of the beam. In addition to this fundamental advantage of PCD systems (i.e. weighting by photon count rather than photon energy), researchers have also investigated other schemes and found that CNR can be further improved by assigning higher weighting to the lower energy photons (4, 28–30).
Previous studies in bench-top PCD-CT systems have demonstrated the capability of multi-energy CT using PCDs to perform quantitative material composition analyses (7, 31, 32). Such analyses result in material specific images in which the pixel value represents the concentration of the specified material. However, due to the limited size of these systems, the work has been restricted to small animals only (e.g. mice or rabbits) (7, 8, 33). Our work with the described research PCD-CT system extends the capabilities of PCD-CT to the inner 275 mm diameter of the human body. To avoid data truncation artifacts, a separate DCS acquisition is required on this research system. Using the A tube, projection data acquired from the EID system were converted to the format of the PCD system projection data and added to the PCD projection data outside of the 275 mm FOV. Note that the DCS is only to complete the PCD data to avoid truncation artifact, it is not to extend the FOV of PCD data. Although extra dose is required for this addition DCS acquisition, it can be performed at a very low dose. It was found in a separate study that the DCS scan can be performed with a CTDIvol around 1 mGy (which was the minimum value achievable in the abdomen protocol) without sacrificing the image quality of PCD. It is essential to note that there is no fundamental limitation to the FOV of the PCD array. Rather, as a research scanner, it was decided to only cover this FOV; the addition of more PCD modules to the B detector would overcome this limitation and remove the need for a DCS.
Our study is limited in several aspects. First, we limited our evaluation to that of the macro acquisition mode, where each 4 × 4 detector pixel array is read out as a single pixel value. The underlying improved spatial resolution of the described PCD array is not captured in this mode. There is no fundamental limitation to reading out each subpixel individually. For this research scanner, at this stage of its development, this feature has not yet been enabled, primarily due to data rate transfer limitations, as essentially 16 times more data would be delivered in the same time frame as the system on which the research scanner was based reads out only 1 detector pixel. Evaluation of subpixel datasets will be the subject of future work. Second, we did not seek to take advantage of the energy selective properties of the acquired data. Although we demonstrated the different CT numbers of iodine due to the different energy spectra captured by bin 1 and bin 2, we did not perform any material decomposition analyses, as the energy thresholds that were used were not chosen to optimize spectral separation but rather to provide similar noise characteristics at 140 kV and our development of multi-energy material decomposition algorithms is ongoing. Third, the decreased beam hardening and calcium blooming in the high energy bin comes at the cost of increased noise, as only a portion of the photon spectrum was used to form the high energy bin image. Ongoing work with iterative reconstruction and energy domain noise reduction techniques is focused on retaining the positive aspects of the high-energy bin image while decreasing the noise level to that of the low energy threshold image (34).
In summary, this work quantitatively demonstrated in phantoms the improved iodine CNR and the energy sensitivity of PCDs, and showed in images of the human body that the image quality is as good as state-of-the-art EID-CT systems. To the best of our knowledge, these are the first images of human anatomy acquired with a high flux rate capable PCD-CT system. The improved CNR could be used directly to improve conspicuity of subtle enhancing lesions, such as those in the liver. Alternatively, the dose of radiation or iodinated contrast material could be reduced such that the same CNR as the EID system was achieved. Dose reduction is one potential application of PCD technology. Another potential application is the reduction of beam hardening and calcium blooming artifacts. Finally, the energy selective information acquired in the separate bin images could be used with dual-energy algorithms to perform analyses similar to those currently in use (35), including quantitative material concentration analyses. New multi-energy algorithms are under development in our lab and elsewhere to take advantage of the data from more than 2 energy bins. Thus, PCD technology makes possible new techniques and clinical applications, while delivering image quality equivalent to current state-of-the-art EID CT systems.
Acknowledgments
Source of Funding:
Research reported in this publication was supported by the National Institutes of Health under award numbers R01 EB016966 and C06 RR018898, and in collaboration with Siemens Healthcare. The content is solely the responsibility of the authors and does not necessarily represent the official views of the National Institutes of Health. Siemens Healthcare provided the scanner evaluated in this work. Ralf Gutjahr, Amhed Halaweish, and Steffen Kappler are employees of Siemens Healthcare. Cynthia McCollough is a grant recipient from Siemens Healthcare.
Research reported in this publication was supported by the National Institutes of Health under award numbers R01 EB016966 and C06 RR018898, and in collaboration with Siemens Healthcare. The content is solely the responsibility of the authors and does not necessarily represent the official views of the National Institutes of Health. The scanner discussed here is a research device and not commercially available. The authors sincerely thank André Henning and Friederike Schöck for their assistance in data acquisition.
Footnotes
Conflicts of Interest
No other potential conflicts of interest were declared.
References
- 1.McCollough CH, Chen GH, Kalender W, et al. Achieving routine submillisievert CT scanning: report from the summit on management of radiation dose in CT. Radiology. 2012;264(2):567–80. doi: 10.1148/radiol.12112265. [DOI] [PMC free article] [PubMed] [Google Scholar]
- 2.Taguchi K, Iwanczyk JS. Vision 20/20: Single photon counting x-ray detectors in medical imaging. Med Phys. 2013;40(10):100901. doi: 10.1118/1.4820371. [DOI] [PMC free article] [PubMed] [Google Scholar]
- 3.Roessl E, Proksa R. K-edge imaging in x-ray computed tomography using multi-bin photon counting detectors. Phys Med Biol. 2007;52(15):4679–96. doi: 10.1088/0031-9155/52/15/020. [DOI] [PubMed] [Google Scholar]
- 4.Schmidt TG. Optimal “image-based” weighting for energy-resolved CT. Med Phys. 2009;36(7):3018–27. doi: 10.1118/1.3148535. [DOI] [PubMed] [Google Scholar]
- 5.Iwanczyk JS, Nygård E, Meirav O, et al. Photon counting energy dispersive detector arrays for x-ray imaging. IEEE Trans Nucl Sci. 2009;56(3):535–42. doi: 10.1109/TNS.2009.2013709. [DOI] [PMC free article] [PubMed] [Google Scholar]
- 6.Koenig T, Schulze J, Zuber M, et al. Imaging properties of small-pixel spectroscopic x-ray detectors based on cadmium telluride sensors. Phys Med Biol. 2012;57(21):6743–59. doi: 10.1088/0031-9155/57/21/6743. [DOI] [PubMed] [Google Scholar]
- 7.Schlomka JP, Roessl E, Dorscheid R, et al. Experimental feasibility of multi-energy photon-counting K-edge imaging in pre-clinical computed tomography. Phys Med Biol. 2008;53(15):4031–47. doi: 10.1088/0031-9155/53/15/002. [DOI] [PubMed] [Google Scholar]
- 8.Pan D, Roessl E, Schlomka JP, et al. Computed Tomography in Color: NanoK-Enhanced Spectral CT Molecular Imaging. Angewandte Chemie. 2010;122(50):9829–33. doi: 10.1002/anie.201005657. [DOI] [PMC free article] [PubMed] [Google Scholar]
- 9.de Vries A, Roessl E, Kneepkens E, et al. Quantitative spectral k-edge imaging in preclinical photon-counting x-ray computed tomography. Invest Radiol. 2015;50(4):297–304. doi: 10.1097/RLI.0000000000000126. [DOI] [PubMed] [Google Scholar]
- 10.Taguchi K, Zhang M, Frey EC, et al. Modeling the performance of a photon counting x-ray detector for CT: Energy response and pulse pileup effects. Med Phys. 2011;38(2):1089–102. doi: 10.1118/1.3539602. [DOI] [PMC free article] [PubMed] [Google Scholar]
- 11.Kappler S, Henning A, Krauss B, et al. Multi-energy performance of a research prototype CT scanner with small-pixel counting detector. SPIE Medical Imaging: International Society for Optics and Photonics. 2013:86680O-O-8. [Google Scholar]
- 12.Heismann BJ, Schmidt BT, Flohr T. Spectral computed tomography. Bellingham, WA: SPIE Press; 2012. [Google Scholar]
- 13.Bushberg JT, Boone JM. The essential physics of medical imaging. Philadelphia, PA: Lippincott Williams & Wilkins; 2012. [Google Scholar]
- 14.Shikhaliev PM. Computed tomography with energy-resolved detection: a feasibility study. Phys Med Biol. 2008;53(5):1475–95. doi: 10.1088/0031-9155/53/5/020. [DOI] [PubMed] [Google Scholar]
- 15.Myronakis ME, Darambara DG. Monte Carlo investigation of charge-transport effects on energy resolution and detection efficiency of pixelated CZT detectors for SPECT/PET applications. Med Phys. 2011;38(1):455–67. doi: 10.1118/1.3532825. [DOI] [PubMed] [Google Scholar]
- 16.Szeles C, Soldner SA, Vydrin S, Graves J, Bale DS. CdZnTe Semiconductor Detectors for Spectroscopic X-ray Imaging. IEEE Trans Nucl Sci. 2008;55(1):572–82. [Google Scholar]
- 17.Kappler S, Henning A, Kreisler B, Schöeck F, Stierstorfer K, Flohr T. Photon counting CT at elevated X-ray tube currents: contrast stability, image noise and multi-energy performance. SPIE Medical Imaging: International Society for Optics and Photonics. 2014:90331C-C-8. [Google Scholar]
- 18.Heanue JA, Pearson DA, Melen RE. CdZnTe detector array for a scanning-beam digital x-ray system. Medical Imaging’99: International Society for Optics and Photonics. 1999:718–25. [Google Scholar]
- 19.Tümer T, Clajus M, Visser G, et al. Preliminary results obtained from a novel CdZnTe pad detector and readout ASIC developed for an automatic baggage inspection system. Nuclear Science Symposium Conference Record, 2000 IEEE: IEEE. 2000;1:4/36–41. [Google Scholar]
- 20.Beutel J, Kundel HL, Van Metter RL. Handbook of Medical Imaging, volume 1: Physics and Psychophysics. Bellingham, WA: SPIE Press; 2000. [Google Scholar]
- 21.Weidinger T, Buzug TM, Flohr T, et al. Investigation of ultra low-dose scans in the context of quantum-counting clinical CT. 2012:83134B-B-9. [Google Scholar]
- 22.Kappler S, Glasser F, Janssen S, Kraft E, Reinwand M. A research prototype system for quantum-counting clinical CT. SPIE Medical Imaging; San Diego, CA. 2010. p. 76221Z-Z-6. [Google Scholar]
- 23.Kappler S, Hannemann T, Kraft E, et al. First results from a hybrid prototype CT scanner for exploring benefits of quantum-counting in clinical CT. SPIE Medical Imaging: International Society for Optics and Photonics. 2012:83130X-X-11. [Google Scholar]
- 24.(Blinded). Initial results from a prototype whole-body photon-counting computed tomography system. (Blinded)
- 25.Stierstorfer K, Rauscher A, Boese J, Bruder H, Schaller S, Flohr T. Weighted FBP—a simple approximate 3D FBP algorithm for multislice spiral CT with good dose usage for arbitrary pitch. Phys Med Biol. 2004;49(11):2209. doi: 10.1088/0031-9155/49/11/007. [DOI] [PubMed] [Google Scholar]
- 26.Christner JA, Stierstorfer K, Primak AN, Eusemann CD, Flohr TG, McCollough CH. Evaluation of z-axis resolution and image noise for nonconstant velocity spiral CT data reconstructed using a weighted 3D filtered backprojection (WFBP) reconstruction algorithm. Med Phys. 2010;37(2):897–906. doi: 10.1118/1.3271110. [DOI] [PubMed] [Google Scholar]
- 27.Hendee WR, Ritenour ER. Medical imaging physics. New York, NY: John Wiley & Sons; 2002. [Google Scholar]
- 28.Cahn RN, Cederstrom B, Danielsson M, Hall A, Lundqvist M, Nygren D. Detective quantum efficiency dependence on x-ray energy weighting in mammography. Med Phys. 1999;26(12):2680–3. doi: 10.1118/1.598807. [DOI] [PubMed] [Google Scholar]
- 29.Giersch J, Niederlohner D, Anton G. The influence of energy weighting on X-ray imaging quality. Nuclear Instruments & Methods in Physics Research Section a-Accelerators Spectrometers Detectors and Associated Equipment. 2004;531(1–2):68–74. [Google Scholar]
- 30.Shikhaliev PM. Energy-resolved computed tomography: first experimental results. Phys Med Biol. 2008;53(20):5595. doi: 10.1088/0031-9155/53/20/002. [DOI] [PubMed] [Google Scholar]
- 31.Alvarez RE. Dimensionality and noise in energy selective x-ray imaging. Med Phys. 2013;40(11):111909. doi: 10.1118/1.4824057. [DOI] [PMC free article] [PubMed] [Google Scholar]
- 32.Butzer J, Butler A, Butler P, Bones P, Cook N, Tlustos L. Medipix imaging-evaluation of datasets with PCA. 23rd International Conference Image and Vision Computing New Zealand (IVCNZ 2008); Nov 26–28, 2008. [Google Scholar]
- 33.Feuerlein S, Roessl E, Proksa R, et al. Multienergy photon-counting K-edge imaging: potential for improved luminal depiction in vascular imaging. Radiology. 2008;249(3):1010–6. doi: 10.1148/radiol.2492080560. [DOI] [PubMed] [Google Scholar]
- 34.Yu Z, Leng S, Li Z, Ritman EL, McCollough CH. Spectral PICCS Reconstruction for PCCT. 3rd Workshop on Medical Applications of Spectroscopic X-ray Detectors; Geneva, Switzerland. 2015. [Google Scholar]
- 35.McCollough CH, Leng S, Yu L, Fletcher JG. Dual- and Multienergy CT: Principels, Technical Approaches, and Clinical Applications. Radiology. 2015;276(3):637–53. doi: 10.1148/radiol.2015142631. [DOI] [PMC free article] [PubMed] [Google Scholar]


