Summary
Ethylenediaminetetraacetate (EDTA) is currently the most abundant organic pollutant due to its recalcitrance and extensive use. Only a few bacteria can degrade it, using EDTA monooxygenase (EmoA) to initiate the degradation. EmoA is an FMNH2-dependent monooxygenase that requires an NADH:FMN oxidoreductase (EmoB) to provide FMNH2 as a cosubstrate. Although EmoA has been identified from Chelativorans (ex. Mesorhizobium) sp. BNC1, its catalytic mechanism is unknown. Crystal structures of EmoA revealed a domain-like insertion into a TIM-barrel, which might serve as a flexible lid for the active site. Docking of MgEDTA2− into EmoA identified an intricate hydrogen bond network connected to Tyr71, which should potentially lower its pKa. Tyr71, along with nearby Glu70 and a peroxy flavin, facilitates a keto-enol transition of the leaving acetyl group of EDTA. Further, for the first time, the physical interaction between EmoA and EmoB was observed by ITC, molecular docking and enzyme kinetic assay, which enhanced both EmoA and EmoB activities probably through coupled channeling of FMNH2.
Keywords: bioremediation, monooxygenase, ethylenediaminetetraacetate, crystal structure, enzyme kinetics, enzyme interaction
Introduction
Ethylenediaminetetraacetate (EDTA) and nitrilotriacetate (NTA) are two ubiquitous chelating agents. Although NTA is easily biodegradable, EDTA is usually recalcitrant to degradation in the environment, causing EDTA to become a dominant organic pollutant, present at a higher concentration than any other organic pollutants (Barber et al., 1995). High levels of EDTA in natural waters are due partly to its extensive usage, such as in industrial cleaning to remove calcium deposits, in detergent as a sequestering agent, in phytoremediation to mobilize heavy metals, and in research laboratories as a chelating agent (Bucheli-Witschel & Egli, 2001, Toste et al., 1995). EDTA mainly exists as metal-EDTA complexes, many of which are toxic and recalcitrant (Dirilgen, 1998, Sillanpaa & Oikari, 1996). Concerns over EDTA recalcitrance and the potential mobilization of heavy metals and radionuclides have led many countries to ban EDTA in detergent and regulate its use in other industrial and consumer products to reduce pollution (Bohuslavek et al., 2001, Toste et al., 1995, Means & Crerar, 1978, Cleveland & Rees, 1981).
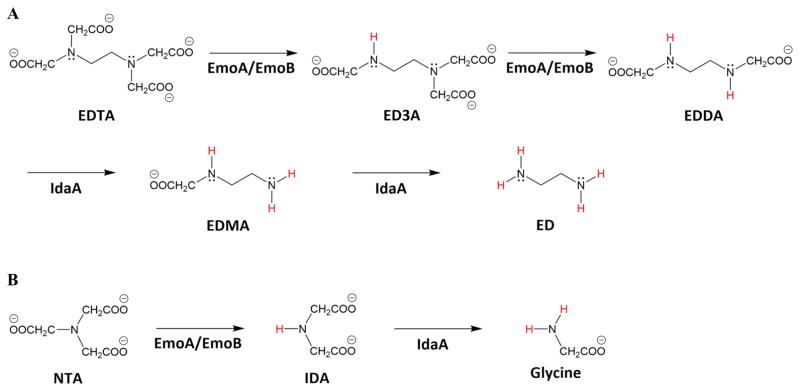
Three bacteria that are phylogenetically related to Mesorhizobium and Agrobacterium species can use EDTA as a sole source of carbon and energy (Fang et al., 2003, Lauff et al., 1990, Nortemann, 1999, Witschel et al., 1997, Weilenmann et al., 2004), and they have been renamed as Chelativorans spp. (Doronina et al., 2010). In these bacteria, reduced flavin mononucleotide (FMNH2)-dependent EDTA monooxygenase (EmoA) and NADH:FMN oxidoreductase (EmoB) together oxidize EDTA to ethylenediaminediacetate (EDDA) (Bohuslavek et al., 2001). Then, EDDA oxidase (IdaA) oxidizes EDDA to ethylenediamine (ED) (Fig. 1) (Liu et al., 2001). It is noticeable that EmoA oxidizes both EDTA and NTA (Bohuslavek et al., 2001). However, NTA monooxygenase (NmoA) from Chelatobacter heintzii ATCC 29600, homologous to EmoA, oxidizes only NTA (Xu et al., 1997, Xun et al., 1996).
FIGURE 1. Degradation Pathway for EDTA and NTA.
(A) EDTA: EmoA and EmoB together remove acetate group as glyoxylate from EDTA and ethylenediaminetriacetate (ED3A). IdaA further removes acetate group from ethylenediaminediacetate (EDDA) and ethylenediaminemonoacetate (EDMA) producing ethylenediamine (ED). (B) NTA: EmoA and EmoB can also deacetylate NTA to produce iminodiacetate (IDA), which is further deacetylated by IdaA to glycine.
EmoA and EmoB belong to a two-component flavin-diffusible monooxygenase (TC-FDM) system, consisting of a monooxygenase component and a NAD(P)H:flavin oxidoreductase component. The flavin reductase provides the monooxygenase with the reduced flavin, such as FMNH2, and the monooxygenase catalyzes the oxidation. The first characterized FMNH2-dependent monooxygenase is bacterial luciferase (McElroy & Green, 1955). Since FMNH2 is readily oxidized by O2, it should be rapidly diffused from the reductase to the monooxygenase. Both diffusion and direct transfer of FMNH2 may occur (Sucharitakul et al., 2014). 4-Hydroxyphenylacetate 3-monooxygenase of Escherichia coli is an FADH2-dependent monooxygenase that obtains FADH2 from its partner flavin reductase via diffusion (Louie et al., 2003). On the flipside, indirect evidence suggests a direct transfer of FMNH2 from the flavin reductase partner to the bacterial luciferase of Vibrio harveyi through protein-protein interaction (Low & Tu, 2003). Recently, NMR analysis has showed the protein-protein interaction for FMNH2 transfer from a partner flavin reductase to alkanesulfonate monooxygenase of Escherichia coli (Dayal et al., 2015b). EmoA is an FMNH2-dependent monooxygenase similar to bacterial luciferase and alkanesulfonate monooxygenase. We have reported a detailed characterization of EmoB from Chelativorans sp. BNC1 including the crystal structures of both FMN:FMN and FMN:NADH complexes (Nissen et al., 2008). The position of NADH in the latter has recently been corrected by comparison to the recently published structure of SsuE (Driggers et al., 2014).
Here we report comprehensive characterization of EmoA from Chelativorans sp. BNC1 and the interaction between EmoA and EmoB, providing direct evidence supporting the protein-protein interaction for FMNH2 transfer.
RESULTS
Oligomeric State and Global Structure of EmoA
Wild type recombinant EmoA from Chelativorans sp. BNC1 crystallized in the P4322 space group as a dimer in the asymmetric unit and diffracted out to 2.15 Å. The final R-factor for the apo-form EmoA was 19.0 % (Rfree = 23.5 %) for 56,556 (45 - 2.15 Å) unique reflections (Table 1) (PDB ID: 5DQP).
Table 1.
Crystallographic data for the apo form EmoA.
| EmoA | |
|---|---|
| Data collectiona | |
| Space group | P4322 |
| Cell dimensions | |
| a, b, c (Å) | 87.33, 87.33, 262.70 |
| α, β, γ (°) | 90.00, 90.00, 90.00 |
| Resolution (Å) | 45.02 – 2.15 (2.18–2.15) |
| Wavelength (Å) | 1.00 |
| Asymmetric unit | 2 |
| Total reflections | 567,846 (24,709) |
| Completeness (%) | 99.8 (97.7) |
| I/σI | 9.2 (3.5) |
| CC1/2b | 0.995 (0.738) |
| Redundancy | 10.1 |
| Rmeasc | 0.203 (1.282) |
| Rpim | 0.062 (0.421) |
|
| |
| Refinement | |
| Resolution (Å) | 45.04 - 2.15 (2.18-2.15) |
| Unique reflections | 56,556 (2,722) |
| Rwork / Rfreed | 0.190 / 0.235 (0.244 / 0.305) |
| B-factors (Å2) | |
| All atoms | 35.0 |
| Solvent | 24.5 |
| R.m.s deviations | |
| Bonds (Å) | 0.009 |
| Angles (º) | 0.973 |
| Ramachandrans (%) | |
| Favored | 97.82 |
| Outliers | 0.00 |
| Number of atoms | |
| Protein and ligand | 6,569 |
| Water | 584 |
Numbers in parentheses refer to the highest resolution shell.
CC1/2 is the correlation between two data sets each based on half of the data as defined in (Karplus & Diederichs, 2012).
Rmeas is the multiplicity-weighted merging R factor.
Rfree was calculated as for Rcryst using 5% of the data that was excluded from refinement.
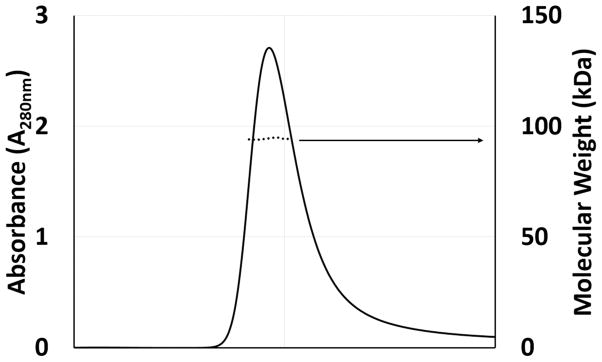
Light scattering experiments also show that EmoA is a dimer in solution (Fig. 2). The EmoA dimer displayed a rather flat and triangular-shaped interface with area of 2760.1 Å2, which covers 14.4 % of the total surface area of each subunit. This interface is mainly established by two α-helices, α2 and α3, from each subunit arranged around a non-crystallographic two-fold axis. Although there are a couple of polar interactions between subunits, the interface consisted predominantly of hydrophobic residues, confirming that EmoA is a dimer in solution.
FIGURE 2. Molecular Mass Determination of EmoA.
Multi-angle light scattering (MALS) was performed using a 42.3 μM EmoA in 20 mM MOPS buffer solution (pH 6.8) with 100 mM NaCl and 1 mM NaN3. The chromatogram is shown as absorbance at 280 nm (left Y-axis) and mass in kDa (logarithmic right Y-axis) versus elution volume (mL). The dots in the middle of the peak indicate the molecular mass (95 kDa) calculated from the light scattering indicate the homodimeric nature of 47.3 kDa EmoA.
Each EmoA subunit adopted a typical TIM-barrel or (α/β)8-barrel fold. However, it varied from the standard TIM-barrel by five major insertions and a long extended C-terminus that formed a base of the barrel. The second, third and fourth insertions were rich in hydrophobic residues and located within the dimerization interface, along with two helices, α2 and α3. The fourth insertion was an elongated hairpin loop between α4 and β5 and covered an entire corner of the dimer interface to confer supplementary affinity for the other subunit.
The unique fifth insertion in EmoA was located between β7 and α7 of TIM-barrel. This domain-like insertion had four major α-helices and displayed substantial differences in its conformation between the two subunits (Fig. 3). In one subunit, it was distant from the C-terminal end of the TIM-barrel, but was substantially closer in the other subunit. Thus, it is referred as a lid throughout this report and the observed dimer was a combination of open and closed forms depending on the position of this lid. The r.m.s.d between Cα atoms of the two subunits was 4.5 Å. However, without including the lid, the r.m.s.d was 0.9 Å (Fig. 3B, E). It is noticeable that Pro291 located at the hinge of each lid adopted two different conformations. That is, the open form had a trans conformation, but was in the cis conformation in the closed form.
FIGURE 3. Diagram Representing the Crystal Structure of EmoA.

(A) The EmoA dimer consists of an open form (green) subunit and a closed form (cyan) subunit. The space-filling model represents FMN (orange) and MgEDTA2− (gray) molecules that are docked into the active site of the closed form subunit. N and C indicate the N-termini and C-termini of each subunit, respectively. (B) TIM-barrels of the two subunits are superposed to show the positional differences between the two lid domains. Color compositions of EmoA are as described above. Individual α-helices are labeled. (C) Overlay of the EmoA structure with its structural homologs. Left panel shows overall structure and right panel shows a close up active site with FMN (orange). EmoA (tan), 1YW1; Ytnj (blue), and 3SDO; nitrilotriacetate monooxygenase (green). (D) Tyr71, which is 2.6 Å apart from a carbonyl oxygen of EDTA, is close to a hydrogen bond network with Gln58, Gln60, Thr62, and Asn129. Gln294 may partake in the network upon lid closure. Glu70 is 3.6 Å away from a β-carbon of EDTA, and its sidechain is in the proximity of Tyr71 and Arg68. (E) Open (green) and closed (cyan) form lid domains are aligned to show conservation of secondary structure of both conformations. TIM-barrels of open and closed subunits are omitted for clarity and their N-and C- termini have been indicated. The ball-and-stick model represents Pro291 isomers. Molecular graphics images were produced using the Chimera package (UCSF, NIH P41 RR-01081).
Structural Homologues of EmoA
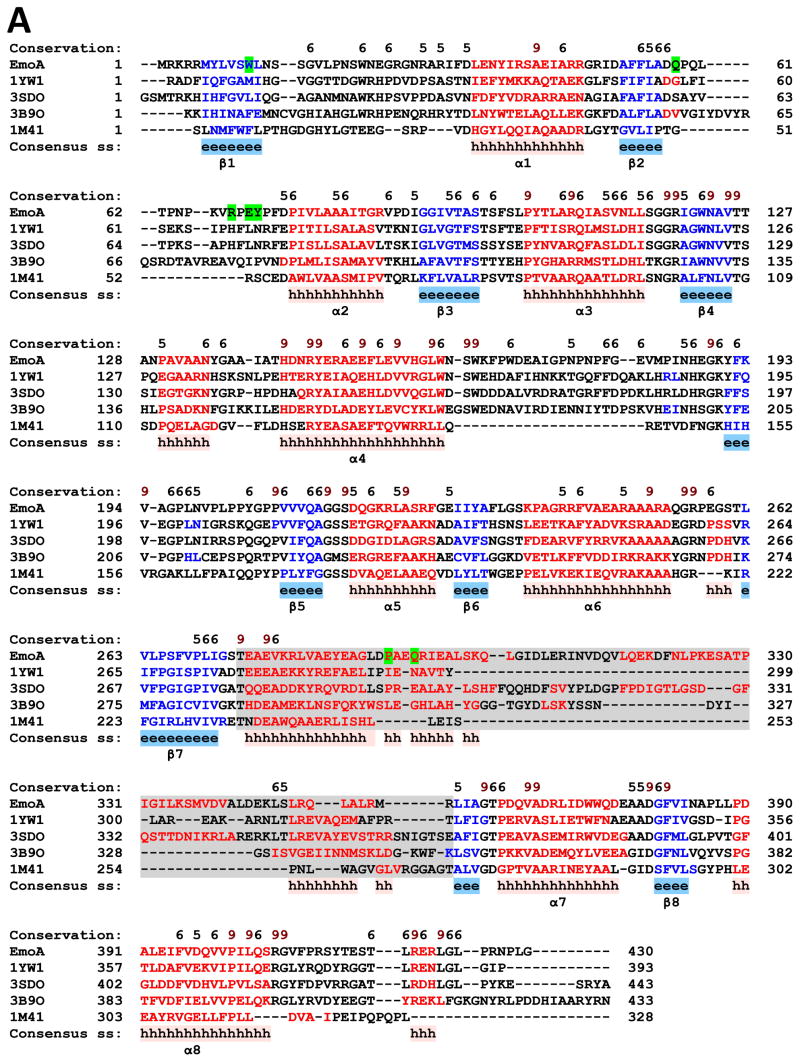
A Dali search (Holm & Rosenström, 2010) for proteins with similar structures to EmoA showed that the highest match was NTA monooxygenase (NmoA) from Burkholderia pseudomallei (PDB: 3SDO) with a Z-score of 45.5, which was followed by Ytnj, a protein of unknown function from Bacillus subtilis (1YW1, 1TVL) with a Z-score of 43.9, LadA from Geobacillus thermodenitrificans (3B9N, 3B9O)(Li et al., 2008) with a Z-score of 39.0, and an alkanesulfonate monooxygenase (SsuD) from E. coli (1NQK, 1M41)(Eichhorn et al., 2002) with a Z-score of 33.1 (Fig. 4). The next ones with a substantial drop on their Z-scores were an F420-dependent glucose-6-phosphate dehydrogenase from Mycobacterium tuberculosis (3B4Y)(Eichhorn et al., 2002) and a luciferase from Vibrio harveyi (1LUC)(Fisher et al., 1996).
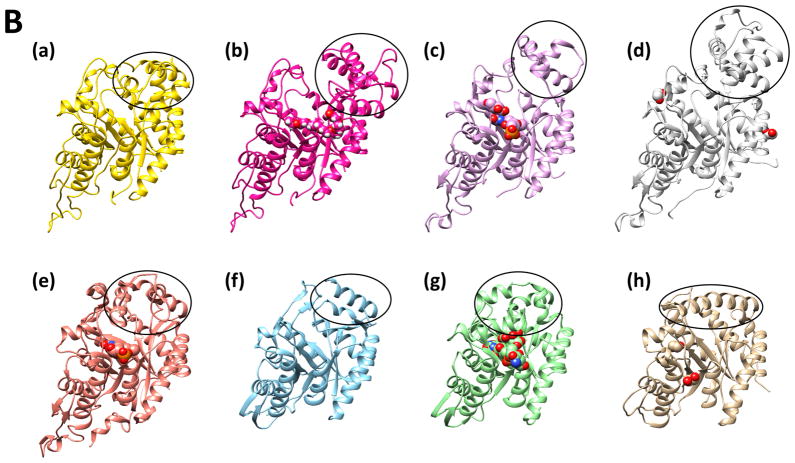
FIGURE 4. Multiple Structure-Based Sequence Alignment.
(A) EmoA from Chelativorans sp. BNC1, 1YW1; Ytnj from B. Subtilis, 3SDO; nitrilotriacetate monooxygenase from B. pseudomallei, 3B9O; long-chain alkane monooxygenase from G. thermodenitrificans, 1M41; alkanesulfonate monooxygenase from E. coli. The α-helices and β-strands are depicted with red and blue colors, respectively. The residues with high conservation are scored on top of the aligned sequences. Amino acids that correspond to the lid and our site-directed mutation experiments are highlighted with gray and green shadows, respectively. Alignment was performed with PROMALS3D (Pei et al., 2008). (B) Monomeric crystal structures of the compared enzymes. (a) Closed form subunit of EmoA, (b) open form subunit of EmoA with a PEG400 in the active site, (c) Ytnj, a protein of unknown function from Bacillus subtilis (1YW1) with a FMN and a glucose in the active site, (d) NTA monooxygenase (NmoA) from Burkholderia pseudomallei (3SDO) with ethylene glycol on the surface, (e) long-chain alkane monooxygenase (LadA) from Geobacillus thermodenitrificans (3B9O) with a FMN in the active site, (f) alkanesulfonate monooxygenase (SsuD) from E. coli (1M41), (g) F420-dependent glucose-6-phosphate dehydrogenase (FGD1) from Mycobacterium tuberculosis (3B4Y) with a coenzyme F420 and a citrate in the active site, and (h) a luciferase from Vibrio harveyi (1LUC) with ethylene glycol on the surface. Lid domain of individual proteins is indicated by a dotted circle.
EmoA and all the above structural homologues except for SsuD are dimeric. Uniquely, SsuD is homotetrameric. Both NmoA from B. pseudomallei and Ytnj from B. subtilis resembled EmoA in terms of global structure and relative orientation between the two subunits in their dimers (Fig. 3D, Fig. 4B). Although the activity of Ytnj is unknown so far, NmoA and EmoA share their catalytic activity for NTA. In addition, structural comparison between NmoA and EmoA revealed that the lid of both monooxygenases contains similarly positioned four α-helices and that the lid of NmoA is slightly larger than that of EmoA (Fig. 3C). However, high flexibility and disordered character of the lid in those structurally similar proteins prevents further comparative investigation.
The FMN- and EDTA-Binding Sites
As expected among other TIM-barrel enzymes, the deep and solvent-exposed cavity was located at the C-terminal end of the barrel. Our structural data revealed that the entrance area for this cavity in the open-form subunit was ~360 Å2, whereas the corresponding entrance of the closed form was reduced to ~80 Å2.
Our molecular docking approach put FMN molecule in an identical position where superimposing apo-form EmoA structure with the FMN binary complex structure of long-chain alkane monooxygenase (LadA) from G. thermodenitrificans (PDB ID: 3B9O), confirming a location of FMN at the typical binding position shown in other monooxygenases. The phosphate end of the FMN tail was hydrogen bonded to the sidechains of His143, Tyr147, and Ser216. The isoalloxazine ring of FMN lay flat on top of the barrel core with its si-face exposed to solvent. This flavin ring was stabilized through a hydrogen bond with a backbone of Asp57. The position of FMN was further stabilized by the van der Waals’ interactions with hydrophobic residues located in β4 and β6. The putative active site at the si-face of the flavin ring established a short tunnel with above-mentioned entrance connected to the solvent.
Our molecular docking approach of MgEDTA2− with FMN-EmoA binary complex structure placed its substrate, only into the close form of EmoA. The binding region was surrounded by the si-face of the flavin ring near its C4a, indole ring of Trp11 and the sidechain of Gln58, where one of the acetate groups of EDTA was facing toward phenolic sidechain of Tyr71. It is noticeable that around the phenolic sidechain of Tyr71, several polar residues such as Gln58, Gln60, Arg68, Glu70, Asn129, and Asn384 were found forming an intricate network of hydrogen bonds. In the subunit of closed conformation, there observed a potential hydrogen bond between sidechains of Gln58 and Gln294 that belong to the barrel and lid respectively (Fig. 3D).
Evidence of FMN Binding to EmoA
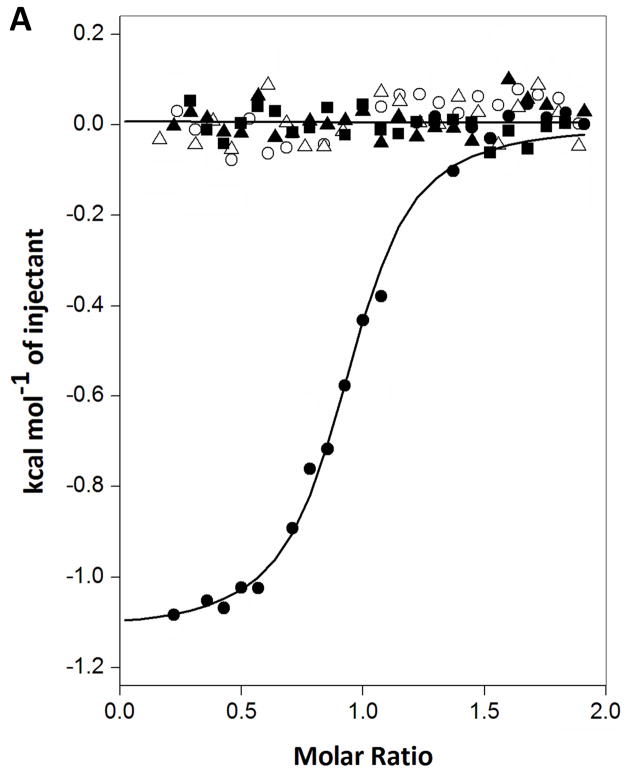
ITC measurements were performed to assess the binding affinity for FMN, FAD and riboflavin to EmoA. A significant amount of heat was released only when EmoA associated with FMN (Fig. 5A). Neither FAD nor riboflavin displayed any apparent binding to EmoA (Fig. 5A). The association of FMN had a significant enthalpic contribution of −2.24 kcal mol−1 and a favorable entropic contribution of 22.1 cal mol−1 K−1, indicating that several solvent molecules located in the FMN-binding pocket of apo-form EmoA were freed upon FMN binding. The calculated Kd value was 0.33 μM. However, ITC data did not show any detectable binding between EmoA and MgEDTA2− in the presence or absence of FMN (Fig. 5A). It is possible that either FMNH2 or hydroperoxy flavin (FMNOOH), which is a substrate and intermediate respectively, provides affinity for MgEDTA2−.
FIGURE 5. Measurement of FMN affinity of EmoA.
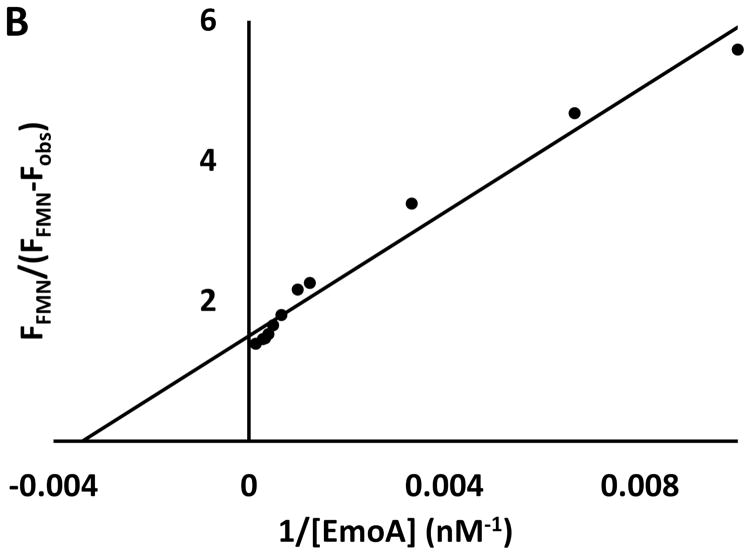
(A) ITC measurements. Trend of heat released by serial injections of FMN (●), FAD (■) and riboflavin (▲) indicating that only FMN exhibited 1-to-1 binding to EmoA with 0.33 μM Kd. Neither riboflavin nor FAD showed any significant affinity to EmoA. MgEDTA2− did not have any significant affinity to EmoA in either the presence (○) or absence of FMN (△). Solid lines represent the least square fits of the data. (B) Fluorescence measurements. Quenching of FMN fluorescence, excited at 450 nm, was measured at 530 nm as a function of EmoA concentrations. Equation 1 was applied to calculate Kd from the slope and intercept of the line. Fobs and FFMN are the observed fluorescence of FMN with and without EmoA, respectively.
The fluorescence emission spectrum of FMN was measured to confirm the Kd value estimated by ITC. Quenching of the fluorescence at 50 nM FMN was monitored from 465 to 650 nm with varying concentrations of EmoA from 0 to 7 μM. The estimated Kd was 0.293 ± 0.02 μM, (Fig. 5B), which is similar to the Kd value obtained with ITC (0.33 μM).
Identification of Key Amino Acid Residues for Catalysis
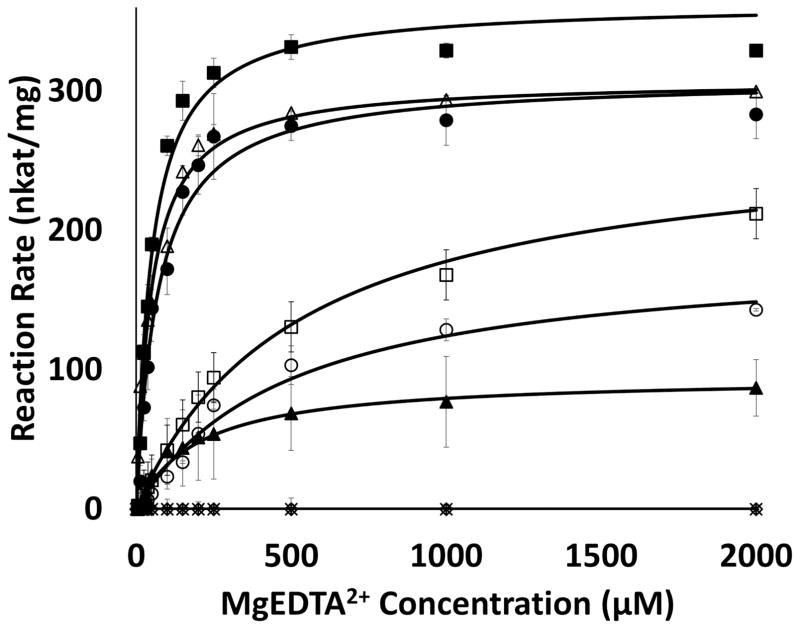
In order to infer the roles of residues that were suggested to be catalytically significant, judging from crystal structures and molecular docking, seven specific residues were tested. The steady-state kinetics experiments were performed by holding concentrations of enzymes and FMN constant at 0.85 μM and 12.5 μM, respectively, while concentrations of MgEDTA2− were adjusted from 0 to 2 mM and the production of glyoxylate was monitored (Fig. 6). The Km, Vmax and kcat values of wild type EmoA for EDTA.Mg2+ were 49.2 ± 6.8 μM, 3.63 ± 0.12 nmol·sec−1 and 17.2 ± 0.58 sec−1 respectively (Table 2). The kcat values of mutants; W11A, Q58A, R68A, P291A and Q294A were 26.4, 51.3, 85.3, 74.4 and 85.6 % of that of wild type EmoA, respectively (Table 2). Change in the catalytic efficiency (kcat/Km) for those mutants except for R68A and Q294A was drastic, where the values were 6.5, 5.1, 89.5, 7.0 and 60.9 % of that of the wild type, respectively (Table 2). The E70A and Y71A mutants showed negligible activity, and thus meaningful kinetic parameters for them could not be determined.
FIGURE 6. Kinetic Activity of EmoA and Its Mutants.
Wild type (■), W11A (▲), Q58A (○), R68A (△), E70A (◇) and Y71A (*), P291A (□) and Q294A (●). Both E70A and Y71A have an almost negligible activity.
Table 2.
Kinetics of EmoA and its Mutantsa.
| kcat (sec−1) | Km (μM) | kcat/Km (sec−1 ·μM−1) | |
|---|---|---|---|
| WT | 17.2 ± 0.6 | 49.2 ± 6.8 | 0.35 |
| W11A | 4.5 ± 0.5 | 197.9 ± 59.6 | 0.02 |
| Q58A | 8.8 ± 0.6 | 490.3 ± 85.0 | 0.02 |
| R68A | 14.7 ± 0.4 | 47.0 ± 4.7 | 0.31 |
| E70A | nd | nd | nd |
| Y71A | nd | nd | nd |
| P291A | 12.8 ± 0.5 | 521.6 ± 47.5 | 0.02 |
| Q294A | 14.7 ± 0.6 | 69.0 ± 9.7 | 0.21 |
ITC, Diffusion, Kinetic and Molecular Docking Experiments for Detecting Specific Interactions between EmoA and EmoB
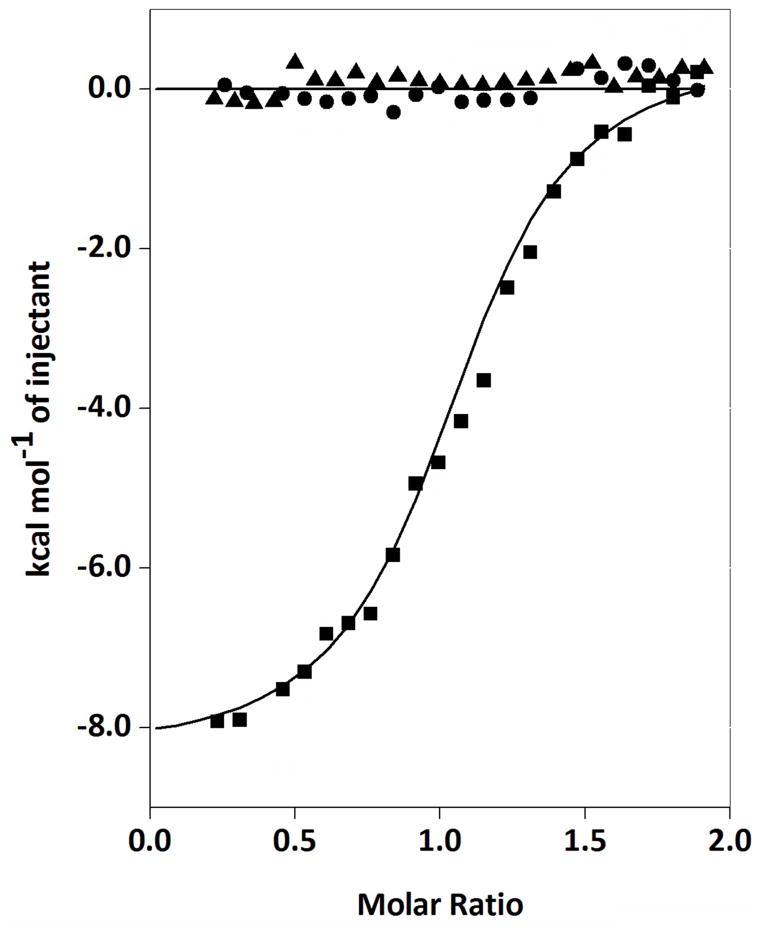
As shown in Fig. 7, ITC experiments indicated that EmoA associated with EmoB with a Kd value of 1.79 μM in the presence of FMN. However, EmoA displayed no significant affinity to EmoB in the absence of FMN. This specific interaction between the two enzymes had unfavorable entropy change of −3.59 cal mol−1 K−1 and was mostly driven by an enthalpic contribution of −8.91 kcal mol−1. On the contrary, EmoA showed no affinity to a similar flavin reductase (Fre) from E. Coli in either presence or absence of FMN indicating its specific affinity to EmoB.
FIGURE 7. Measurement of Potential Interaction between EmoA and EmoB or Fre through ITC.
The trend of heat released by serial injections of EmoB into EmoA in the presence of FMN (■), EmoB into EmoA in the absence of FMN (●) and NAD(P)H:FMN oxidoreductase of E. coli (Fre) into EmoA in the presence of FMN (▲).
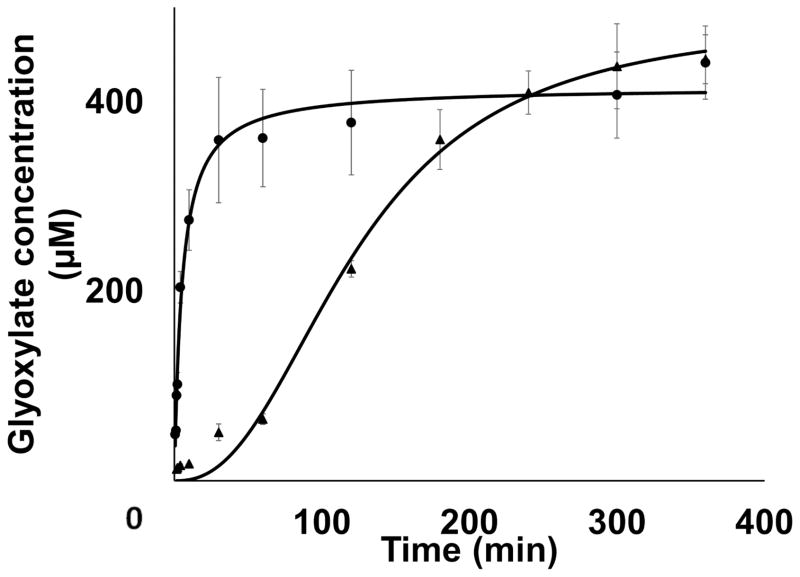
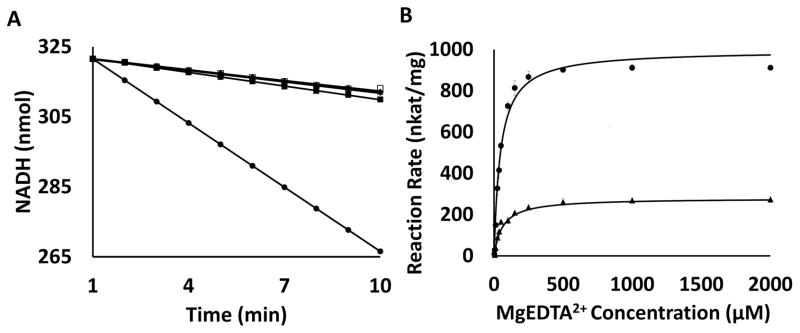
As shown in Fig. 8, FMNH2 produced by EmoB could be delivered through diffusion across a membrane that prevented any physical contact between EmoA and EmoB. However, the same assay showed that EmoA produced glyoxylate much faster when it was physically coupled with an activity of EmoB without any membrane barrier (Fig. 8). In addition, the NADH/NAD+ conversion rate of EmoA-EmoB pair displayed 4.7 times higher than that of EmoA-Fre pair (Fig. 9A). However, if either one or both of EmoA and EDTA were absent, EmoB and Fre showed very similar NADH consumption rate of 1.0 nmol min−1. In these assays for EmoB or Fre alone, FMN is only generated by auto-oxidation of FMNH2 and delivered to EmoB or Fre by diffusion. When coupled with EmoA in the absence of EDTA, EmoA cannot oxidize FMNH2, thus the autoxidation is again the sole source of FMN. However, if EmoB or Fre is coupled with EmoA in the presence of EDTA, both EmoA and autoxidation can produce FMN. EmoA-Fre pair showed 1.3 nmol min−1 in the presence of EDTA. EmoA-EmoB pair consumed 6.1 nmol NADH per minute in the presence of EDTA. In summary, the EmoA-coupled EmoB exhibited 610 % elevation in NADH consumption rate compare to the uncoupled, where Fre showed only 130 % rate elevation. In addition, glyoxylate production of EmoA showed elevation in rate with EmoB compared to that in combination with Fre (Fig. 9B). EmoA coupled with EmoB has shown a kcat of 47.1 ± 1.3 s−1 and Km of 46.1 ± 5.4 μM. kcat and Km values of EmoA coupled with Fre were 13.2 ± 0.4 s−1 and 61.5 ± 7.3 μM, respectively.
FIGURE 8. Substrate Diffusion Experiment.
Formation of glyoxylate was measured over the reaction times in a 2 mL diffusion chamber with (▲) and without (●) a low molecular cutoff cellulose membrane to separate EmoA from EmoB. Without the membrane, a direct transfer of FMNH2 from EmoB to EmoA is allowed. However, with the membrane, FMNH2 can only be transferred to EmoA by diffusion through the media.
FIGURE 9. Kinetic assay of EmoA coupled with either EmoB or Fre.
(A) NADH consumption over time. Y-axis has been normalized to have same starting point at 1 min time point for all data set to accommodate comparison between the slopes. EmoB coupled with EmoA in the presence of EDTA (●), Fre coupled with EmoA in the presence of EDTA (■), uncoupled EmoB without EDTA (◆), uncoupled EmoB with EDTA (△), EmoB coupled with EmoA without EDTA (□), Fre coupled with EmoA without EDTA (▽), uncoupled Fre with EDTA (◇), and uncoupled Fre without EDTA (○). (B) Rate of glyoxylate production by EmoA when coupled with EmoB (●), and Fre (▲).
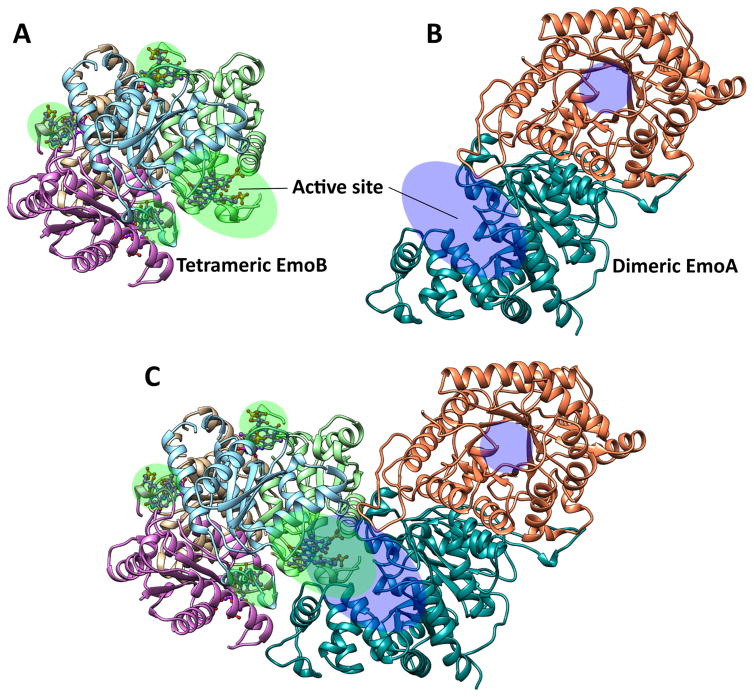
Molecular docking experiments between the crystal structure of EmoA (dimeric) and complex crystal structure of EmoB with two FMN molecules in their active sites (PDB ID: 4LTM) were performed using ‘PatchDock’ algorithm (Fig. 10) (Schneidman-Duhovny et al., 2005). For those top ten geometrical matching results, the atomic contact energies (ACE) were applied for a purpose of filtering out the unreasonable configurations. The third best geometric solution with a score of 17,024 had the lowest ACE (258.68 cal mol−1), where the solution with the highest geometrical score of 17,978 was ranked 10th with 432.60 cal mol−1. On the other hand, two solutions of the lowest ACE with 215.26 and 221.19 cal mol−1 had considerably lower score of geometric compatibility with 15734 and 15164, respectively. The most optimal solution considering both geometric score and ACE had those values of 17024 and 258.68 cal mol−1 respectively. It placed one subunit of the EmoB tetramer on the side of the active site of the open form subunit of EmoA dimer in a way that the solvent exposed FMN on top of EmoB prosthetic FMN is situated at the entrance of the EmoA active site (Fig. 10). In order to gauge the accuracy of our docked EmoA-EmoB complex, we compared the complex to recent findings in the direct flavin transfer mechanism between a two-component system comprised of a NADPH-dependent FMN reductase, SsuE, and an alkanesulfonate monooxygenase, SsuD (Driggers et al., 2014, Dayal et al., 2015a, Eichhorn et al., 2002). In the SsuD-SsuE system, two regions on SsuD (residues 251 – 261 and 285 – 295) and SsuE (78 – 89 and 119 – 125) were found to exhibit low rates of amide hydrogen/deuterium exchange when both proteins were present in the same solution, suggesting that the two regions on each protein are important for direct flavin transfer (Dayal et al., 2015a). Structural superposition of SsuE on the docked EmoB tetramer and SsuD on the docked EmoA dimer shows that the two regions of SsuD implicated in complex formation superpose on the lid region of EmoA. However, the two regions of SsuE superpose on regions of EmoB, which are important in forming the tetramer with substantial amount of hydrophobic interaction. Overall, the overlapping regions of SsuD and EmoA suggest that our docking result has validity. However, the SsuE regions that show low solvent exchange could be due to the formation of SsuE tetramers. In addition, the oligomeric state of SsuD is uniquely tetrameric, and thus interaction between SsuE and SsuD could be different from that between EmoA and EmoB.
FIGURE 10. Potential Interaction between EmoB Tetramer (PDB ID: 4LTM) and EmoA Dimer.
The results of Molecular docking (PatchDock algorithm) indicating a potential mode of interaction between EmoA and EmoB. (A) Each of the four active sites in EmoB tetramer and (B) two active sites in EmoA dimer were marked with green and blue shades, respectively. (C) Plausible complex formation between EmoB and EmoA through open apo-form EmoA and EmoB in its two-FMN complex form (PDB ID 4LTM) predicted by Patch Dock. Figure was drawn by the Chimera package (UCSF, NIH P41 RR-01081).
DISCUSSION
Considering the two distinct conformations of the lid observed between the two EmoA subunits, it is likely that EmoA undergoes a conformational change between closed and an open states through a dynamic gating of the lid. It has been proposed before that this domain-like conformation among some α/β barrel enzymes could seal the active site upon binding its substrate (Farber & Petsko, 1990). Although the α-helical contents in the lid domains are shared across the compared monooxygenases, the sizes of the lids are quite heterogeneous among them (Fig. 3C and 4). EmoA, Ytnj and NmoA have an extra α-helix and loop in the lids, when compared with other monooxygenases, LadA and SsuD (Fig. 4). The extra amino acids in the lids of EmoA and NmoA may have evolved to completely seal the active site for these relatively smaller substrates.
The conformation of Pro291 of EmoA was discernable between the two subunits in that the corresponding peptide bond adopted a trans conformation in the open subunit; whereas, it was cis in the closed subunit. Although the secondary structural elements of the lid domains are conserved in the open and closed forms, their angles between two helices (Glu275-Gly288 and Pro291-Leu303) differ by 25° (Fig. 3E), which could be a consequence of dynamic isomerization of Pro291. Considering the favorable isomerization state of trans-over cis-form, the lid in open form should be thermally more stable than the closed form. Supporting this, all of the available PDB structures of enzymes that have high homology, (with or without FMN) are in their open lid conformation with trans-prolyl-peptide bond. The prolyl isomerization could facilitate the transition between the open and closed forms, of which motion slows down upon binding of metal-EDTA. In addition, the EmoA P291A mutant exhibited a substantial decrease on the catalytic efficiency (kcat/Km), 7.0 % of that of wild type (Table 2). Thus, it is tempting to speculate that the 25 % reduction in kcat reflects a rather small catalytic contribution of the lid, but a substantial change in kcat/Km and Km reflects that the proper conformation of the lid, aided by the prolyl dynamics, might be crucial for active site sealing and EDTA binding.
Active Site and Catalytic Mechanism
Based on the superimposed positions of FMN in the FMN-complex structures of Ytnj from B. subtilis (PDB ID 1YW1), LadA from G. thermodenitrificans (PDB ID 3B9O) and our EmoA docking result, a position for the riboflavin moiety of FADH2 was confidently established (Fig. 3C, D). In addition, the EDTA molecule was docked on top of the si-face of isoalloxazine ring. FMN and EDTA docked in a predominantly hydrophobic pocket made by Phe54, Ala56, Val125, Ala128, Ala213, Gly214 and Gly215 (Fig. 3D). In general, only the hydrophobic nature of this stretch of residues is conserved among the compared enzymes, whereas hydrophilic residues binding the FMN phosphate (Arg146, Tyr147 and Ser216) are highly conserved (Fig. 4A). Although several hydrophilic residues in the EDTA-binding pocket (Gln58, Arg68, Glu70, Tyr71, and Gln294) are located at potentially strategic locations for the expected catalytic reaction, they are not conserved among compared enzymes. As expected, mutation of those residues altered the catalytic rate of EmoA (Fig. 6).
As MgEDTA2− shows negligible affinity for EmoA (Fig. 5A), EDTA likely bind either following FMNH2 binding, or following the formation of C4a-hydroperoxy flavin (FMNOOH) by the reaction of FMNH2 with diffused-in molecular oxygen.
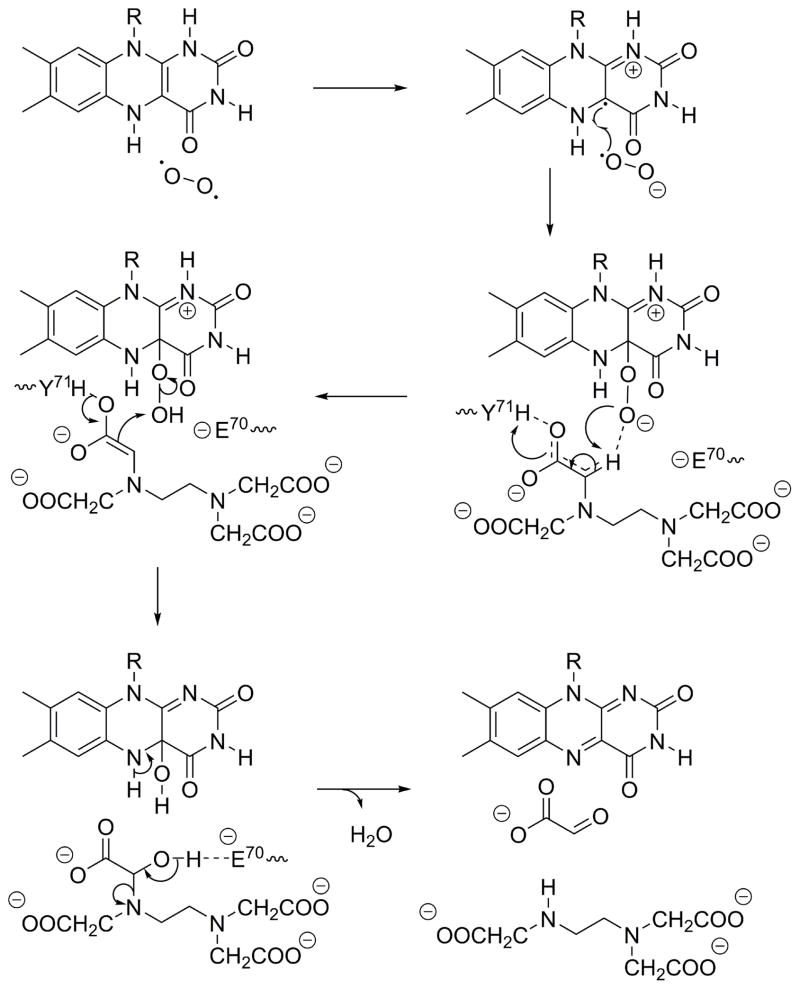
As shown in Fig. 3D, the phenolic oxygen of Tyr71 is close to a hydrogen bond network established by the sidechains of nearby residues, Gln58, Gln60, Thr62 and Asn129. A severe, 94.9%, decrease in catalytic efficiency (kcat/Km) was resulted upon Q58A mutation (Table. 2), which detaches Tyr71 from the hydrogen bond network. The sidechain of Gln58 could alter the pKa of phenolic sidechain of Tyr71 through the proton-relay mechanism by the observed hydrogen bond network, facilitating deprotonation of the phenolic proton by one of the acetate groups in bound MgEDTA2− (Fig. 11). This deprotonation allows a keto-enol transition and deprotonation of the α-carbon of the acetyl group of EDTA, transferring proton to a highly basic FMNOO− intermediate (Fig. 11). At the opposite side of this hydrogen bond network, there exists a carboxyl sidechain of Glu70 and the E70A mutation completely abolished the catalytic activity of EmoA (Table 2). In addition to its electrostatic effect on the phenolic sidechain of Tyr71, the negatively charged Glu70 sidechain can initiate deacetylation of EDTA. After oxygen abstraction from FMNOOH by the acetyl α-carbon of EDTA, the negatively charged Glu70 sidechain could remove the hydroxyl proton on the acetyl α-carbon of EDTA, facilitating release of glyoxylate (Fig. 11). Glu70 is within the electrostatic influence of the guanidinium sidechain of Arg68 (Fig. 3D). However, considering our result of R68A mutant and a sidechain pKa of Glu70, the electrostatic effect of Arg68 should be trivial.
FIGURE 11. Proposed Catalytic Reaction Mechanism of EmoA.
FMNH2 binds first to EmoA and oxidized to peroxy flavin intermediate by O2. Then, MgEDTA2− binds to the active site where an acetate group is coordinated with Tyr71, Glu70 and peroxy flavin intermediate. Deprotonation of a carbonyl α-carbon is stabilized by Tyr71 sidechain that is a part of a hydrogen bond network. After a hydroxylation on the α-carbon by the unstable FMNOOH, deacetylation is triggered by the negatively charged Glu70, producing glyoxylate and ED3A.
Alternatively, Tyr71 can also undergo a dihedral rotation that would put the phenolic group in an angle at which its phenolic hydrogen could establish a hydrogen bond with the peroxide of FMNOO−. This would facilitate formation of FMNOO− by stabilizing the negative charge on the peroxy group and promote a conformation that is amenable for catalysis. Although an alternative mechanism that employs a tyrosyl radical for the α-carbon deprotonation cannot be excluded, the absence of a sufficient base in the active site and the location of Tyr71 make the radical mechanism unlikely. Alternatively, the FMNOO− could also act as a nucleophile.
As shown in both ITC and fluorescence experiments, FMN shows significant affinity for EmoA, 0.33 and 0.29 μM respectively. Thus, the dissociation mechanism for the deacetylation products (ethylenediamine triacetate, and glyoxylate) would be sequential, where FMN departs after ED3A and glyoxylate.
The Specific Interaction between EmoA and EmoB in the Presence of FMN/FMNH2
The NADH:FMN oxidoreductase (EmoB) activity occurs through reduction of a tightly bound FMN molecule to FMNH2 by NADH (Nissen et al., 2008). With departure of NAD+, a diffusible FMN molecule enters the EmoB active site, is reduced to FMNH2 by the bound FMNH2, and diffuses away. EmoA then uses the diffusible FMNH2 for EDTA metabolism. It is also possible that the tightly bound FMNH2 is transferred from EmoB to EmoA through direct protein-protein interaction. As shown by our diffusion experiments (Fig. 8), it is clear that EmoB, when separated from EmoA by a dialysis membrane, can freely diffuse FMNH2 to EmoA, despite the slow rate of glyoxylate production by EmoA. However, this rate was substantially increased by allowing physical contact between EmoA and EmoB (Fig. 8). In addition, pairing EmoA and EmoB enhanced the catalytic efficiency (kcat/Km) of glyoxylate production by EmoA 4.86 times higher (1.02 s−1 μM−1) than its catalytic efficiency when paired with Fre (0.21 s−1 μM−1) (Fig. 9B). Measurements of the NADH/NAD+ conversion rate confirmed their rate elevation by 4.70 times by a specific coupling between EmoB and EmoA compared to that of EmoA-Fre pair (Fig. 9A), although EmoB and Fre have very similar flavin reductase activity (Bohuslavek et al., 2001).
Our ITC data confirmed there is significant and specific affinity between EmoA and EmoB that exists only in the presence of freely diffusible FMN (Fig. 7). This is the first time that such an interaction has been shown between two components in a TC-FDM enzyme pair. It is tempting to speculate that there might be even tighter interaction between EmoA and EmoB in the presence FMNH2. In addition to the solid kinetic data, indicating enhancement of activities by interaction between EmoB and EmoA, molecular docking result shows contact between EmoA in its open conformation and EmoB in the two-FMN complex. All results indicate there is a strong possibility of direct transfer of FMNH2 between them upon physical contact.
Conclusion
Characterization of the key enzymes participating in the bioremediation of EDTA is a prerequisite for successful enhancement of the bioremediation of EDTA and other chelating chemicals. EmoA is the first enzyme in EDTA degradation by Chelativorans sp. BNC1, making it a prime candidate in these regards. Based on the findings, we hypothesize that once FMNH2 binds and reacts with O2, the resulting FMNOOH attacks the incoming MgEDTA. In addition, the observed rate improvement for the activities of both EmoA and EmoB when paired together reflects the significance of their specific interactions. Considering the lower diffusion velocity of small molecules in a cytoplasm (Verkman, 2002) and the rapid auto-oxidizing characteristic of FMNH2, effective deliverance of FMNH2 in vivo should depend on a physical contact between EmoA and EmoB.
EXPERIMENTAL PROCEDURES
Chemicals
Chemicals were obtained from Sigma Aldrich or Alfa Aesar. Crystallization screens were obtained from Hampton Research.
Expression and Purification of EmoA, EmoB, and E. coli Fre
The emoA gene of Chelativorans BNC1 was cloned into a pET30a vector for overexpression (Bohuslavek et al., 2001) The plasmid harboring EmoA was transformed into Rosetta(DE3)pLyS cells, along with pGro7, which encodes the groELS chaperone protein (Clontech, Mountain View, CA). The cells were grown at 37 °C with constant shaking (250 rpm) in LB medium supplemented with 30 μg mL−1 kanamycin, chloramphenicol, and spectinomycin. Overexpression of EmoA was induced by addition of IPTG to a final concentration of 0.5 mM, when the optical density at 600 nm reached 0.6. After agitation (250 rpm) for an additional 10 h at 37 °C, the cells were harvested by centrifugation (4000 × g for 15 min). The cell pellets were suspended in lysis buffer (50 mM sodium phosphate, 300 mM NaCl, 5% (v/v) glycerol, 1 mM NaN3 and 5 mM imidazole, pH 8.0), lysed by sonication (Model 450 Sonifier, Branson Ultrasonics) eight times for 10 s each, and the lysates were cleared by centrifugation (10,000 × g for 30 min). The cleared lysate was applied to a nickel-nitrilotriacetate column, which was then washed extensively with lysis buffer containing 20 mM imidazole. Protein was eluted from the column with lysis buffer containing 300 mM imidazole. Fractions containing EmoA were pooled, concentrated, and exchanged into buffer A (5 mM sodium phosphate pH 6.8 and 5% (v/v) glycerol). The protein was loaded onto a CHT-II hydroxyapatite column (Bio Rad) connected to an AKTA Pure 25M (GE Healthcare) and equilibrated in buffer A at a flow rate of 6 mL min−1. Protein was eluted with a linear 5 to 500 mM sodium phosphate gradient. EmoA was eluted between 19.7 – 24.8 mM sodium phosphate gradient. Fractions containing EmoA were pooled and dialyzed into buffer B (20 mM Tris, 1 mM DTT and 1 mM NaN3, pH 8.0). The buffer-exchanged protein was loaded onto a Resource Q anion exchange column (Pharmacia), equilibrated with buffer B at a flow rate of 2.4 mL min−1, and eluted with a linear 0 to 2 M NaCl gradient. EmoA was eluted between 60.0 – 84.0 mM NaCl gradient. SDS-PAGE was used to check the presence and purity of EmoA after each purification step. Protein concentrations were determined by the BCA (Thermo Fisher Scientific). The EmoA yield was approximately 40 mg from three liters of culture. Expression and purification of BNC1 EmoB and E. coli flavin reductase (Fre) were performed as previously described (Xun & Sandvik, 2000, Nissen et al., 2008).
Determination of Molecular Mass for EmoA
The average molecular mass of EmoA was measured by combined size exclusion chromatography and multi-angle light scattering (MALS). The purified EmoA was diluted to 2.0 mg mL−1 with 20 mM MOPS buffer, pH 6.8, containing 100 mM NaCl and 1 mM NaN3. 200 μg of the protein was loaded onto a Yarra 3u SEC-2000 size exclusion column (Phenomenex) and eluted isocratically with the same buffer, followed in tandem by a tandem UV detector (Gilson), an interferometric refractometer (Optilab DSP, Wyatt Technology Corp.), and a laser light-scattering detector (Dawn EOS, Wyatt Technology Corp.) in that order. The light scattering data were analyzed with the Astra V software package (Wyatt Technology Corp.) using the Zimm fitting method.
Crystallization of EmoA
Optimized EmoA crystals were obtained by mixing 1.5 μL of purified EmoA (0.63 mM in 20 mM Tris, 1 mM DTT, pH 8.0) with an equal volume of reservoir solution containing 0.1 M HEPES, 2 % (w/v) PEG 400, and 1.75 M ammonium sulfate, pH 7.5. Crystallization trials were performed using the hanging drop vapor diffusion method at 277 K. Crystals usually appeared after four days, and full-grown crystals were obtained after ten days. Diffraction data were collected at the Advanced Light Source (beam line 8.2.1) at 100 K. Data were indexed, integrated, and scaled with HKL 2000 package (Otwinowski & Minor, 1997). (Otwinowski & Minor, 1997). Despite our numerous attempts, the complex crystallization of EmoA with FMN was not successful in either soaking or co-crystallization approach.
Structural Solution and Refinement
The structure of EmoA was solved by the molecular replacement method using Protein Data Bank (PDB)-deposited coordinates of model 1YW1 and PHENIX Phaser (Adams et al., 2010). The structure was refined in PHENIX and manually adjusted in COOT (Emsley et al., 2010). The structure of EmoA has been deposited with a PDB ID of 5DQP.
Isothermal Titration Calorimetry
Isothermal titration calorimetric reactions were carried out in a MicroCal iTC200 isothermal titration calorimeter (Malvern). All titrations were performed at 25 °C and stirred at 750 rpm. The calorimetric cell contained 20 μM EmoA in 20 mM MOPS, pH 7.7, into which an initial 0.8 μL ligand solution was injected, followed by 27 subsequent 1.4 μL injections Ligands (FMN, FAD, and riboflavin) were diluted into 20 mM MOPS, pH 7.7 to a final concentration of 200 μM. Ligands were also titrated against buffer to account for the heats of dilution. For EDTA binding measurements, 40 μM EmoA was used with and without 400 μM FMN. EmoA preparation and all the dilutions were made in 20 mM HEPES pH 7.6. Magnesium sulfate was used to form the MgEDTA2− complex. MgSO4 and EDTA concentration were adjusted to obtain significant heats of binding. Binding interactions between EmoA and EmoB were measured using 40 μM EmoA, prepared in 20 mM HEPES pH 7.6, 10 % (v/v) glycerol, and 200 mM NaCl. The added glycerol and NaCl were necessary to stabilize EmoB. With the same buffer, 400 μM EmoB was prepared for syringe injection. Measurements were made with and without 400 μM FMN, and EmoB. Binding interactions between EmoA and NAD(P)H:FMN oxidoreductase from E. coli (Fre) were measured using 40 μM EmoA, prepared in 20 mM HEPES pH 7.6. Measurements were made with 400 μM FMN, and Fre concentration was adjusted for a same reason as EmoB. Origin 7 MicroCal Data Analysis software analysis package (GE Healthcare) was used for ITC curve fitting. A one-set-of-sites model was employed. Curve fitting equations can be found in the MicroCal iTC200 User Manual appendix.
Fluorescence Spectroscopy
Fluorescence measurements were made with a SPEX Fluorolog-3-21 Spectrofluorometer with excitation at 450 nm (slit width 5 nm, Xe lamp) and emission scanned from 465 to 650 nm with 0.5 nm increment and 0.1 second integration time. All samples were prepared in 20 mM Tris, pH 7.5 and incubated at 25 °C prior to measurements. Collected data were fitted and Kd was calculated with Equation 1. (Baldwin et al., 1975).
| (Eq. 1) |
Where Fobs and FFMN are the observed fluorescence of FMN with and without EmoA, respectively; fFMN and fE:FMN are the intrinsic fluorescence of free and bound FMN, respectively.
Mutagenesis of EmoA
Mutagenesis primers were synthesized by Integrated DNA Technologies, Inc. Mutagenesis of Trp11, Gln58, Arg68, Glu70, Tyr71, Pro291 and Gln294 to Ala was performed according to a modified site-directed mutagenesis method (Xia et al., 2015). Plasmids were purified using QIAprep Spin Miniprep kits (Qiagen). XL1-blue competent cells (Stratagene) and Novagen Rosetta cells were transformed for plasmid amplification and protein expression, respectively. Plasmids were sequenced by GENEWIZ to confirm the mutations. Mutant proteins were expressed and purified according to the protocol used for the wild type enzyme.
Kinetics of EmoA and Mutants
EmoA kinetic parameters were determined by measuring the end product (glyoxylate) formation. The kinetics assay mixture contained 20 mM HEPES (pH 7.6), 12.5 μM FMN, 0.85 μM EmoA, 1.91 μM NADH:FMN oxidoreductase (EmoB), 0.56 μM of catalase (from bovine liver, Sigma), and varying concentrations of EDTA with stoichiometrically equivalent amounts of MgSO4 in a total volume of 250 μL. The reaction was initiated by the addition of 2 mM NADH. After one minute, 100 μL of 0.1 N HCl was added to quench the reaction. The amount of glyoxylate produced was detected by phenylhydrazine-K3Fe(CN)6, as previously described (Witschel et al., 1997). All the measurements were triplicated. Kinetic parameters were calculated with Origin Pro 9.1 (OriginLab Corporation).
To examine the effect of the FMN reductase has on EmoA activity, glyoxylate production rate of EmoA in the presence of EmoB was compared with the rate of EmoA coupled to E. coli Fre. The same glyoxylate detection method described above was employed to an assay mixture with a lowered FMN concentration. The corresponding assay mixture contains 20 mM HEPES (pH 7.6), 1.0 μM FMN, 0.85 μM EmoA, 1.91 μM EmoB or Fre, and 0.56 μM of catalase. The concentrations of EDTA and MgSO4 were varied from 0 to 2000 μM.
Molecular Docking of Substrate to EmoA
To locate the binding sites for FMN and EDTA in the crystal structure, in silico substrate docking experiments were performed with AutoDock Vina (Trott & Olson, 2010). The FMN binding site was determined first by using a blind search where the search box contained a whole monomeric EmoA. The resulting FMN-bound EmoA structure was used as a search template for the EDTA binding site.
Molecular Docking between EmoA and EmoB
The crystal structure of tetrameric EmoB with two FMN molecules in each active site (PDB ID: 4LTM) was allowed to dock into the dimeric EmoA structure using ‘PatchDock’ software (Schneidman-Duhovny et al., 2005) to generate a docked configuration with the best geometric fit and optimally matched local characteristics (Schneidman-Duhovny et al., 2003). The top ten results, according to those geometrical fitting, were re-ranked by the sorting algorithm of atomic contact energies in the package (Zhang et al., 1997).
FMNH2 Diffusion experiment
Two 2 mL diffusion chambers were separated by a dialysis cellulose membrane. Both chambers were filled with 20 mM HEPES, 10 mM FMN, 2 mM NADH and 0.25 mM EDTA and MgSO4, pH 7.6. 0.85 μM EmoA was then added to one chamber and 1.91 μM EmoB was added to the other. The sealed diffusion chamber cassette was incubated on a rocker at 25°C. During 6 hours, the concentration of glyoxylate produced was measured in triplicate.
NADH/NAD+ Conversion Kinetics
To examine the effect of EmoA on EmoB activity, the NADH consumption rate of EmoB in the absence of EmoA was compared to the consumption rate in the presence of EmoA. As a control, the rate of EmoB was also compared with rate of E. coli Fre in the presence and the absence of EmoA. To measure the NADH consumption rate of EmoB (or Fre) without EmoA, 10 nM EmoB (or Fre) was added to a standard mixture in one mL of 20 mM HEPES (pH 8.0), containing 0.6 μM FMN and 50 μM NADH. Absorbance at 340 nm was measured for ten minutes in one-minute intervals. To measure the EmoB/EmoA coupling in the presence of EDTA, the same measurements were repeated with addition of 10 μM EmoA with or without 50 μM EDTA and 100 μM MgSO4 to the standard mixture. Data of the first one minute after the addition of EmoB is not included in the analysis to remove the contribution of artificially added FMN. The same experiments were repeated with Fre instead of EmoB as a control. All data were measured in triplicate.
Acknowledgments
Original research was supported by grant from NSF (MCB 1021148, DBI 0959778) and NIH (1R01GM11125401). We thank Drs. Alexander DQ Li and W Wan for fluorescence measurement.
References
- Adams P, Afonine P, Bunkóczi G, Chen V, Davis I, Echols N, Headd J, Hung L, Kapral G, Grosse-Kunstleve R, McCoy A, Moriarty N, Oeffner R, Read R, Richardson D, Richardson J, Terwilliger T, Zwart P. PHENIX: a comprehensive Python-based system for macromolecular structure solution. Acta Crystallogr D Biol Crystallogr. 2010;66:213–221. doi: 10.1107/S0907444909052925. [DOI] [PMC free article] [PubMed] [Google Scholar]
- Baldwin T, Nicoli M, Becvar J, Hastings J. Bacterial luciferase. Binding of oxidized flavin mononucleotide. Journal of Biological Chemistry. 1975;250:2763–2768. [PubMed] [Google Scholar]
- Barber LB, Leenheer JA, Pereira WE, Noyes TI, Brown GK, Tabor CF, Writer JHe. US Geological Survey Circular. Reston, VA: U. S. Geological Survey; 1995. p. 1133. [Google Scholar]
- Bohuslavek J, Payne J, Liu Y, Bolton HJ, Xun L. Cloning, sequencing, and characterization of a gene cluster involved in EDTA degradation from the bacterium BNC1. Appl Environ Microbiol. 2001;67:688–695. doi: 10.1128/AEM.67.2.688-695.2001. [DOI] [PMC free article] [PubMed] [Google Scholar]
- Bucheli-Witschel M, Egli T. Environmental fate and microbial degradation of aminopolycarboxylic acids. FEMS Microbiol Rev. 2001;25:69–106. doi: 10.1111/j.1574-6976.2001.tb00572.x. [DOI] [PubMed] [Google Scholar]
- Cleveland J, Rees T. Characterization of plutonium in Maxey Flats radioactive trench leachates. Science. 1981;212:1506–1509. doi: 10.1126/science.212.4502.1506. [DOI] [PubMed] [Google Scholar]
- Dayal P, Singh H, Busenlehner L, Ellis H. Exposing the Alkanesulfonate Monooxygenase Protein-Protein Interaction Sites. Biochemistry. 2015a;54:7531–7538. doi: 10.1021/acs.biochem.5b00935. [DOI] [PubMed] [Google Scholar]
- Dayal P, Singh H, Busenlehner L, Ellis H. Exposing the Alkanesulfonate Monooxygenase Protein–Protein Interaction Sites. Biochemistry. 2015b;54:7531–7538. doi: 10.1021/acs.biochem.5b00935. [DOI] [PubMed] [Google Scholar]
- Dirilgen N. Effects of pH and chelator EDTA on Cr toxicity and accumulation in Lemma minor. Chemosphere. 1998;37:771–783. [Google Scholar]
- Doronina N, Kaparullina E, Trotsenko Y, Nörtemann B, Bucheli-Witschel M, Weilenmann H, Egli T. Chelativorans multitrophicus gen. nov., sp. nov. and Chelativorans oligotrophicus sp. nov., aerobic EDTA-degrading bacteria. Int J Syst Evol Microbiol. 2010;60:1044–1051. doi: 10.1099/ijs.0.003152-0. [DOI] [PubMed] [Google Scholar]
- Driggers C, Dayal P, Ellis H, Karplus P. Crystal structure of Escherichia coli SsuE: defining a general catalytic cycle for FMN reductases of the flavodoxin-like superfamily. Biochemistry. 2014;53:3509–3519. doi: 10.1021/bi500314f. [DOI] [PubMed] [Google Scholar]
- Eichhorn E, Davey C, Sargent D, Leisinger T, Richmond T. Crystal structure of Escherichia coli alkanesulfonate monooxygenase SsuD. J Mol Biol. 2002;324:457–468. doi: 10.1016/s0022-2836(02)01069-0. [DOI] [PubMed] [Google Scholar]
- Emsley P, Lohkamp B, Scott WG, Cowtan K. Features and development of Coot. Acta Crystallogr D Biol Crystallogr. 2010;66:486–501. doi: 10.1107/S0907444910007493. [DOI] [PMC free article] [PubMed] [Google Scholar]
- Fang HY, Chen SC, Chen SL. Degradation of ferric EDTA by Burkhol cepacia. Appl Biochem Biotechnol. 2003;111:81–92. doi: 10.1385/abab:111:2:81. [DOI] [PubMed] [Google Scholar]
- Farber G, Petsko G. The evolution of alpha/beta barrel enzymes. Trends Biochem Sci. 1990;15:228–234. doi: 10.1016/0968-0004(90)90035-a. [DOI] [PubMed] [Google Scholar]
- Fisher A, Thompson T, Thoden J, Baldwin T, Rayment I. The 1.5-A resolution crystal structure of bacterial luciferase in low salt conditions. J Biol Chem. 1996;271:21956–21968. doi: 10.1074/jbc.271.36.21956. [DOI] [PubMed] [Google Scholar]
- Holm L, Rosenström P. Dali server: conservation mapping in 3D. Nucleic Acids Res. 2010;38(suppl 2):W545–W549. doi: 10.1093/nar/gkq366. [DOI] [PMC free article] [PubMed] [Google Scholar]
- Karplus PA, Diederichs K. Linking crystallographic model and data quality. Science. 2012;336:1030–1033. doi: 10.1126/science.1218231. [DOI] [PMC free article] [PubMed] [Google Scholar]
- Lauff J, Steele D, Coogan L, Breitfeller J. Degradation of the ferric chelate of EDTA by a pure culture of an Agrobacterium sp. Appl Environ Microbiol. 1990;56:3346–3353. doi: 10.1128/aem.56.11.3346-3353.1990. [DOI] [PMC free article] [PubMed] [Google Scholar]
- Li L, Liu X, Yang W, Xu F, Wang W, Feng L, Bartlam M, Wang L, Rao Z. Crystal structure of long-chain alkane monooxygenase (LadA) in complex with coenzyme FMN: unveiling the long-chain alkane hydroxylase. J Mol Biol. 2008;15:453–465. doi: 10.1016/j.jmb.2007.11.069. [DOI] [PubMed] [Google Scholar]
- Liu Y, Louie T, Payne J, Bohuslavek J, Bolton HJ, Xun L. Identification, purification, and characterization of iminodiacetate oxidase from the EDTA-degrading bacterium BNC1. Appl Environ Microbiol. 2001;67:696–701. doi: 10.1128/AEM.67.2.696-701.2001. [DOI] [PMC free article] [PubMed] [Google Scholar]
- Louie T, Xie X, Xun L. Coordinated production and utilization of FADH2 by NAD(P)H-flavin oxidoreductase and 4-hydroxyphenylacetate 3-monooxygenase. Biochemistry. 2003;42:7509–7517. doi: 10.1021/bi034092r. [DOI] [PubMed] [Google Scholar]
- Low J, Tu S. Energy transfer evidence for in vitro and in vivo complexes of Vibrio harveyi flavin reductase P and luciferase. Photochem Photobiol. 2003;77:446–452. doi: 10.1562/0031-8655(2003)077<0446:etefiv>2.0.co;2. [DOI] [PubMed] [Google Scholar]
- McElroy W, Green A. Enzymatic properties of bacterial luciferase. Biochem Biophys. 1955;56:240–255. doi: 10.1016/0003-9861(55)90353-2. [DOI] [PubMed] [Google Scholar]
- Means J, Crerar D. Migration of radioactive wastes: Radionuclide mobilization by complexing agents. Science. 1978;200:1477–1486. doi: 10.1126/science.200.4349.1477. [DOI] [PubMed] [Google Scholar]
- Nissen M, Youn B, Knowles B, Ballinger J, Jun S, Belchik S, Xun L, Kang C. Crystal structures of NADH:FMN oxidoreductase (EmoB) at different stages of catalysis. J Biol Chem. 2008;283:28710–28720. doi: 10.1074/jbc.M804535200. [DOI] [PMC free article] [PubMed] [Google Scholar]
- Nortemann B. Biodegradation of EDTA. Appl Microbiol Biotechnol. 1999;51:751–759. doi: 10.1007/s002530051458. [DOI] [PubMed] [Google Scholar]
- Otwinowski Z, Minor W. Processing of X-ray Diffraction Data Collected in Oscillation Mode. Methods in Enzymology. 1997;276:307–326. doi: 10.1016/S0076-6879(97)76066-X. [DOI] [PubMed] [Google Scholar]
- Pei J, Kim BH, Grishin NV. PROMALS3D: a tool for multiple protein sequence and structure alignments. Nucleic acids research. 2008;36:2295–2300. doi: 10.1093/nar/gkn072. [DOI] [PMC free article] [PubMed] [Google Scholar]
- Schneidman-Duhovny D, Inbar Y, Nussinov R, Wolfson HJ. PatchDock and SymmDock: servers for rigid and symmetric docking. Nucleic acids research. 2005;33:W363–W367. doi: 10.1093/nar/gki481. [DOI] [PMC free article] [PubMed] [Google Scholar]
- Schneidman-Duhovny D, Inbar Y, Polak V, Shatsky M, Halperin I, Benyamini H, Barzilai A, Dror O, Haspel N, Nussinov R. Taking geometry to its edge: fast unbound rigid (and hinge-bent) docking. Proteins: Structure, Function, and Bioinformatics. 2003;52:107–112. doi: 10.1002/prot.10397. [DOI] [PubMed] [Google Scholar]
- Sillanpaa M, Oikari A. Assessing the impact of complexation by EDTA and DTPA on heavy metal toxicity using Microtox bioassay. Chemosphere. 1996;32:1485–1497. [Google Scholar]
- Sucharitakul J, Tinikul R, Chaiyen P. Mechanisms of reduced flavin transfer in the two-component flavin-dependent monooxygenases. Arch Biochem Biophys. 2014;555–556:33–46. doi: 10.1016/j.abb.2014.05.009. [DOI] [PubMed] [Google Scholar]
- Toste A, Osborn B, Polach K, Lechner-Fish T. Organic analyses of an actual and simulated mixed waste: Hanford’s organic complexant revisited. J Radioanal Nucl Chem. 1995;194:25–34. [Google Scholar]
- Trott O, Olson A. AutoDock Vina: improving the speed and accuracy of docking with a new scoring function, efficient optimization, and multithreading. J Comput Chem. 2010;31:455–461. doi: 10.1002/jcc.21334. [DOI] [PMC free article] [PubMed] [Google Scholar]
- Verkman AS. Solute and macromolecule diffusion in cellular aqueous compartments. Trends in biochemical sciences. 2002;27:27–33. doi: 10.1016/s0968-0004(01)02003-5. [DOI] [PubMed] [Google Scholar]
- Weilenmann HU, Engeli B, Bucheli-Witschel M, Egli T. Isolation and growth characteristics of an EDTA-degrading member of the alpha-subclass of Proteobacteria. Biodegrad. 2004;15:289–301. doi: 10.1023/b:biod.0000042184.35056.ab. [DOI] [PubMed] [Google Scholar]
- Witschel M, Nagel S, Egli T. Identification and characterization of the two-enzyme system catalyzing the oxidation of EDTA in the EDTA-degrading bacterial strain DSM 9103. J Bacteriol. 1997;179:6937–6943. doi: 10.1128/jb.179.22.6937-6943.1997. [DOI] [PMC free article] [PubMed] [Google Scholar]
- Xia Y, Chu W, Qi Q, Xun L. New insights into the QuikChangeTM process guide the use of Phusion DNA polymerase for site-directed mutagenesis. Nucleic Acids Res. 2015;43:e12. doi: 10.1093/nar/gku1189. [DOI] [PMC free article] [PubMed] [Google Scholar]
- Xu Y, Mortimer M, Fisher T, Kahn M, Brockman F, Xun L. Cloning, sequencing, and analysis of a gene cluster from Chelatobacter heintzii ATCC 29600 encoding nitrilotriacetate monooxygenase and NADH:flavin mononucleotide oxidoreductase. J Bacteriol. 1997;179:1112–1116. doi: 10.1128/jb.179.4.1112-1116.1997. [DOI] [PMC free article] [PubMed] [Google Scholar]
- Xun L, Reeder R, Plymale A, Girvin D, Bolton JH. Degradation of metal-nitrilotriacetate (NTA) complexes by NTA monooxygenase. Environ Sci Technol. 1996;30:1753–1755. [Google Scholar]
- Xun L, Sandvik E. Characterization of 4-hydroxyphenylacetate 3-hydroxylase (HpaB) of Escherichia coli as a reduced flavin adenine dinucleotide-utilizing monooxygenase. Appl Environ Microbiol. 2000;66:481–486. doi: 10.1128/aem.66.2.481-486.2000. [DOI] [PMC free article] [PubMed] [Google Scholar]
- Zhang C, Vasmatzis G, Cornette JL, DeLisi C. Determination of atomic desolvation energies from the structures of crystallized proteins. Journal of molecular biology. 1997;267:707–726. doi: 10.1006/jmbi.1996.0859. [DOI] [PubMed] [Google Scholar]


