Abstract
A cost-effective battery-powered spectrophotometric system (BASS) was developed for quantitative point-of-care (POC) analysis on a microfluidic chip. By using methylene blue as a model analyte, we first compared the performance of the BASS with a commercial spectrophotometric system, and further applied the BASS for loop-mediated isothermal amplification (LAMP) detection and subsequent quantitative nucleic acid analysis which exhibited a comparable limit of detection to that of Nanodrop. Compared to the commercial spectrophotometric system, our spectrophotometric system is lower-cost, consumes less reagents, and has a higher detection sensitivity. Most importantly, it does not rely on external power supplies. All these features make our spectrophotometric system highly suitable for a variety of POC analyses, such as field detection.
Introduction
Point-of-care (POC) analysis is designed to move testing out of well-equipped laboratories into other less hospitable sites. The capacity for on-site or in-field testing from POC analysis is vital for immediate and convenient human health diagnostics, food safety monitoring and environmental analysis.1, 2 Microfluidic lab-on-a-chip, with a variety of advantages such as low cost and low-reagent consumption associated with portability, miniaturization, integration and automation, offers a versatile miniaturized platform for various applications,3–10 providing great potential for POC detection.11–13 However, this great potential is often hindered by conventional detection systems, because most of these systems are devised for cuvette- or glassware-based assays in well-equipped laboratory settings. Therefore, advances in detection systems must be made to fully take the advantages of lab-on-a-chip systems for POC analysis.14, 15
Spectrophotometry, quantitative measurement of the reflection, transmission or absorption properties of a compound as a function of light wavelength, is one of the most widely used detection principles in analysis of biological compounds, food analysis, environmental analysis, pharmaceutical analysis, etc.16 However, commercial spectrophotometric systems are generally expensive and bulky, making them only suitable for well-equipped laboratories. Although several portable spectrophotometers have been reported recently,17–19 most of them are cuvette-based and dependent on external AC power supplies. Most cuvette-based systems require large amounts of precious reagents and samples. However, sometimes it is hard to obtain large amounts of biological samples, such as clinical biopsy samples or trace forensic samples from crime scenes. These features make it challenging for the cuvette-based systems to perform POC analysis such as in-field disease diagnosis in low-resource settings where AC electricity is usually not available. Given the advantages of microfluidic lab-on-a-chip, a portable spectrophotometer coupled with a microfluidic device could significantly reduce the reagent consumption to make it suitable for cost-effective POC bioanalysis.20 Jiang and his colleagues integrated an optical detection unit which included commercial optical fibers and a digital fiber optical sensor on a microfluidic chip to measure the real-time absorbance of the turbidity generation from loop-mediated isothermal amplification (LAMP) for quantitative pathogen detection.21, 22 However, two thin optical fibers (200 µm diameter core) needed to be inserted in the chip laterally and to be accurately aligned together with the sample chamber, making the whole system complicated. Because the optical fibers were fixed in the device, it was not practical to use this detection system for various microfluidic devices, limiting its broad application. Additionally, this detection system still relied on external AC power supplies. These limitations hinder its application for POC analysis in low-resource settings.
Therefore, to address these problems above, we developed a low-cost battery-powered spectrophotometric system (BASS) coupled with a microfluidic chip for POC analysis. We first investigated and compared the performance of the BASS with a commercial spectrophotometric system using methylene blue as a model analyte. Our spectrophotometric system not only required less amount of samples, but also exhibited higher detection sensitivity than the commercial spectrophotometric system. We further applied the BASS for on-chip LAMP detection of meningitis and subsequent quantitative nucleic acid analysis, demonstrating another application of the BASS for rapid diagnosis of infectious diseases which often occurred in high-poverty nations and regions. Importantly, whole assays were completed without relying on any external power supplies.
Experimental Section
Chemicals and Materials
Methylene blue was purchased from Sigma (St. Louis, MO). The LAMP reaction mixture contained 20 mM Tris-HCl (pH 8.8), 10 mM KCl, 8 mM MgSO4, 10 mM (NH4)2SO4, 0.1% Tween 20, 0.8 M Betaine, 0.5 mM MnCl2, 1.4 mM dNTPs, 8U Bst Polymerase, 1.6 µM of both the forward inner primer (FIP) and backward inner primer (BIP), 0.2 µM of both the forward outer primer (F3) and backward outer primer (B3), and 0.4 µM of both the forward loop primer (LF) and backward loop primer (LB). The LAMP primers were purchased from Integrated DNA Technologies (Coralville, IA). The Neisseria meningitidis (ATCC 13098) was obtained from American Type Culture Collection (ATCC, Rockville, MD). LAMP DNA amplification kits were purchased from Eiken Co. Ltd., Japan. DNA isolation kits and LAMP products purification kits were purchased from Qiagen (Valencia, CA). LAMP products were collected and purified for concentration measurement of the nucleic acids by using Nanodrop (Nanodrop 1000, Thermo Scientific, MA). Unless stated otherwise, all solutions were prepared with ultrapure Milli-Q water (18.2 MΩ cm) from a Millipore Milli-Q system (Bedford, MA).
The chip substrate poly(methyl methacrylate) (PMMA) was purchased from McMaster-Carr (Los Angeles, CA). The absorbance detector of Red Tide USB 650, EcoVis lamp and optical fibers were purchased from Ocean Optics (Dunedin, Florida). The red LED light was purchased from Weller (Apex, NC). The dark box (10 × 10 × 6 cm) and the heater control holder were 3D printed using a 3D printer purchased from MakerBot Industries (Brooklyn, NY).
Experimental Design and Setup
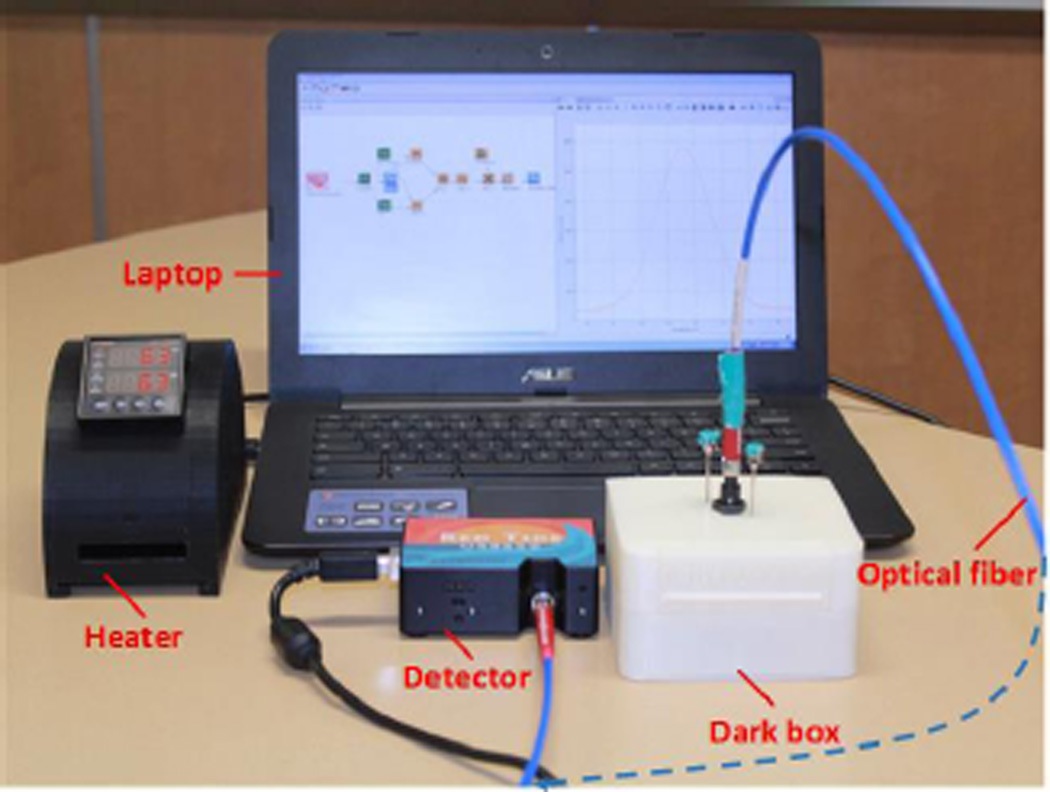
The setup of the battery-powered spectrophotometric system is shown in Figure 1. The whole system consists of a LED light source, a microfluidic device, a device holder, optical fibers, a detector and a laptop computer. The light source and related circuits were assembled in the bottom chamber of the 3D printed dark box, while the top chamber of the dark box was designed to hold a microfluidic device. Details of the dark box will be discussed in the Results and Discussions section. After the light emitted from the LED light passes through a sample in the microfluidic chip, the transmitted light will be sent to the detector via optical fibers. Absorbance data will be sent to the computer though a USB cable, and recorded by the software Ocean View installed in a laptop. All the components including the heater controller are fully battery-powered, and do not require external AC power supplies.
Figure 1.
Setup of the battery-powered spectrophotometric system (BASS) for microfluidic POC analysis.
A similar commercial spectrometric system (Ocean Optics) using an EcoVis lamp as the light source was used to compare the performance of our spectrophotometric system. The EcoVis lamp’s light was attenuated by using a 16 neutral density filter to make it suitable for the detector.
Chip Design and Fabrication
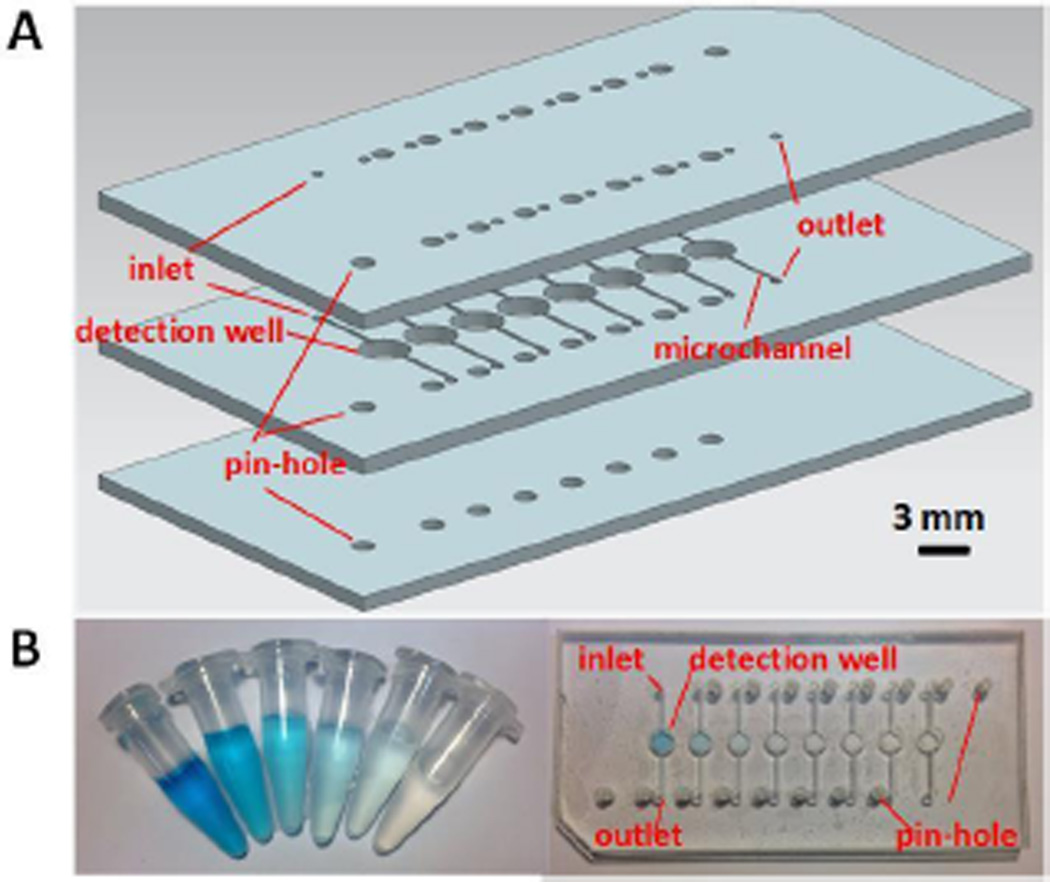
The layout of a simple microfluidic PMMA chip used in the BASS is shown in Figure 2A. The microfluidic chip comprises three layers. All these three layers have corresponding pin-holes to fix the microfluidic chip and allow aligning the detection zone of the chip and optical fibers with a LED light underneath (e.g., 650 nm red light). In addition, the top two layers contain inlets and outlets and the middle layer contains microchannels for reagent introduction. All the features including the pin-holes, inlets, outlets, detection wells (diameter 3 mm) and microchannels (width 300 µm; depth 300 µm) were directly laser ablated by a laser cutter (Epilog Zing 16, Golden, CO) within minutes, and then different layers were bonded together after heating in an oven at 120 °C for 30 min. Figure 2B shows a photograph of the microfluidic chip and 2.5 mL microcentrifuge tubes filled with different concentrations of methylene blue solutions which were used to evaluate the performance between the commercial cuvette-based spectrophotometric system and the BASS.
Figure 2.
(A) 3D schematic of the microfluidic PMMA chip. (B) Photographs of different concentrations of methylene blue in microcentrifuge tubes (left, 1.5–50.0 µM) and in the microfluidic chip (right, 6.2–100.0 µM).
LAMP Detection Procedures
In order to explore the relationship between the DNA concentrations from the LAMP amplicon with the signal from the BASS, after the LAMP reaction, we collected the amplicon and made a series of dilutions. The nucleic acids concentrations of the standard LAMP products were measured by using Nanodrop. Meanwhile, corresponding absorbance signals from each dilution were measured using the BASS.
Results and Discussions
Methylene Blue Measurement Using a Commercial Spectrophotometric System
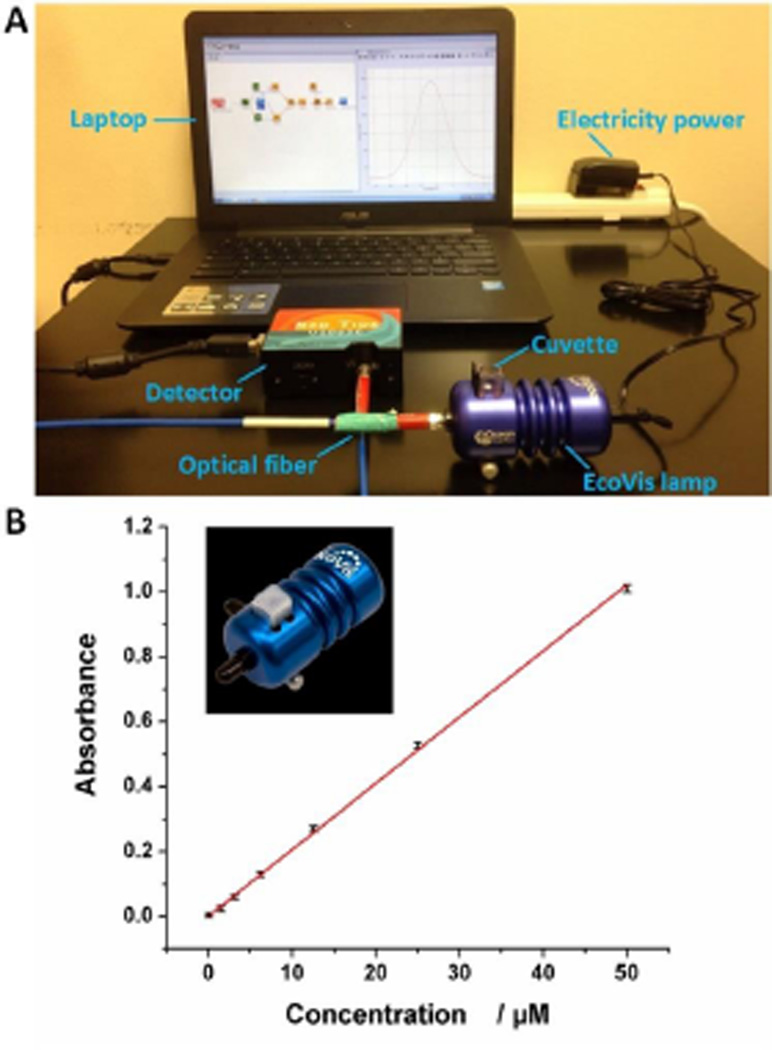
A commercial spectrophotometric system was also used to compare the performance with the BASS. The setup of the commercial spectrophotometric system is shown in Figure 3A. The commercial spectrophotometric system uses a commercial EcoVis lamp (~$600) as the light source which requires external AC power supplies. The EcoVis lamp has a holder (Figure 3A), but it is only compatible to cuvettes and not suitable for microfluidic devices. In addition, a relatively large amount of samples (at least 0.8 mL) is required to perform an assay for the cuvette-based systems. These features hinder its applications for POC analysis.
Figure 3.
(A) Setup of the commercial spectrophotometric system. (B) Calibration curve of the commercial spectrophotometric system for detection of various concentrations of methylene blue solutions. Inset is a photograph of the commercial external AC electricity-powered EcoVis lamp.
Methylene blue, a heterocyclic aromatic chemical compound, has been widely used in biology, chemistry and health science as a staining agent. It is also used to treat methemoglobinemia as a pharmaceutical drug.23, 24 Therefore, we first used methylene blue as a model analyte to demonstrate the colorimetric bioassay, and to compare the performance of our system with the commercial system. We first conducted the detection of different concentrations of methylene blue using the commercial spectrophotometric system. Figure 3B shows the calibration curve plotted by using absorbance versus various concentrations of methylene blue ranging from to 0 to 50.0 µM. With the increase of the methylene blue concentration, stronger absorbance was observed. A linear calibration curve was established between absorbance and methylene blue concentration, with the square of the correlation coefficient (R2) of 0.9985. The limit of detection (LOD) of methylene blue was calculated to be 0.59 µM on the basis of the 3-fold standard deviations of the negative control signal.
Battery-Powered Spectrophotometric System
Figure 1 shows the setup of the BASS. Since the EcoVis lamp requires external power supplies and is not suitable for microfluidic devices, we developed a dark box, a major difference between these two systems, to address these issues for broader POC applications, as shown in Figure 4.
Figure 4.
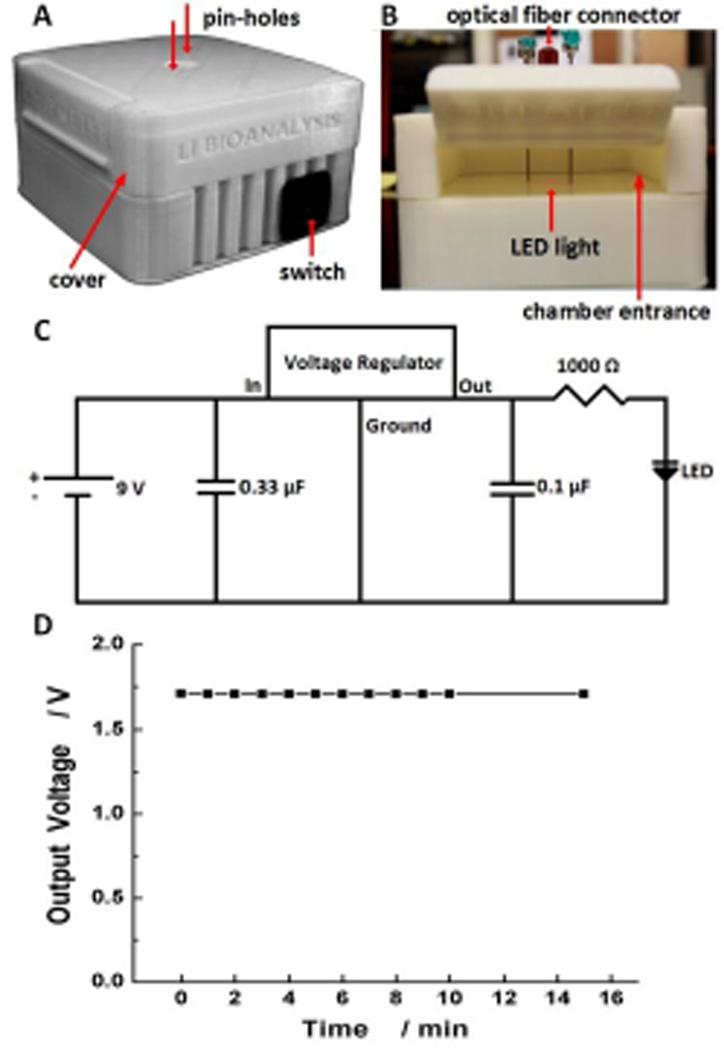
Design of the dark box. (A) Outside view; (B) Inside view of the device holder chamber; (C) Circuit for the LED light assembled in the bottom chamber. (D) Circuit output over a period of time.
The portable dark box (10 × 10 × 6 cm) has two chambers, with the top chamber serving as a microfluidic device holder and the bottom chamber containing a LED light and related circuits as the light source. As can be seen in Figure 4A and B, a cover (i.e. cap) was 3D-printed to provide access to inside of the dark box. During an assay, the cover was closed to ensure darkness inside, eliminating interference from the environment (no cover for the commercial EcoVis lamp). On the ceiling of the top chamber, an optical fiber connector was fixed to connect the optical fiber, and two pin-holes were designed to align the optical fiber and the detection well of the microfluidic chip with the LED light underneath the top chamber. The pin-hole design is significant for broad applications, because it makes the spectrophotometric system ‘universal’, and readily adapted for various designs of microfluidic devices.
In the bottom chamber, a LED light (e.g., 650 nm red light) which can be easily changed to meet the requirement of a number of compounds serves as the light source for the spectrophotometric system, as shown in Figure 4B. An easy-to-use switch is designed for turning the LED light on/off (Figure 4A). The bottom chamber of the dark box also features a circuit (see Figure 4C) that provides a steady output voltage of 1.7 V, when a 9.0 V battery is used as the power source. It was observed that the output voltage decreased quickly in the absence of a voltage regulator. In order to adjust and have a stable voltage output from the 9 V battery, a 5 V voltage regulator was applied to the circuit along with two capacitors (0.33 µF and 0.1 µF) and a 1000 Ω resistor to acquire a constant voltage output of 1.7 V for the LED light. Figure 4D shows the steady voltage output after the addition of the voltage regulator in the circuit. This stable voltage minimized systematic variations, allowing for accurate measurement. During an assay, light emitted from the battery-powered LED light passes through the sample in the detection zone of the microfluidic chip and gets absorbed. The transmitted light is sent to the detector via the optical fiber, while the detector is connected to a laptop computer through a USB cable, without using any external supplies.
Different components were assembled through 3D printing, with a user-friendly interface. The total material cost of the dark box was estimated less than $18, which was much lower compared to the commercial external AC electricity-powered and cuvette-based EcoVis lamp (~$600). Most importantly, the spectrophotometric system is portable and fully battery-powered, which is a desirable trait in the evolving market of spectrophotometry for on-site or in-field testing where AC electricity is commonly not available.
Performance of the battery-powered spectrophotometric system
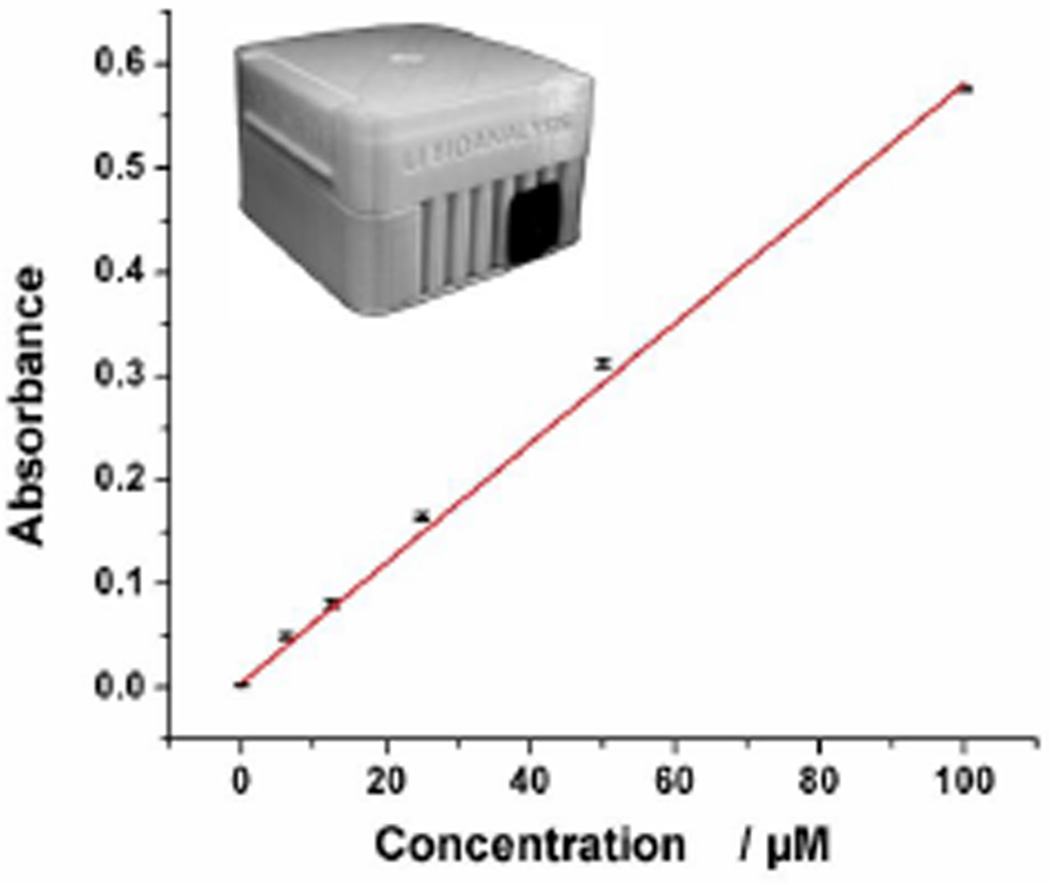
We then measured various concentrations of methylene blue using the BASS to evaluate its performance. As shown in Figure 5, a similar linear calibration curve was observed between the absorbance and the concentration of methylene blue in the experimental range (0 to 100.0 µM), with the square of the correlation coefficient (R2) of 0.9987. The LOD was calculated to be as low as 0.10 µM on the basis of the 3-fold standard deviations of the negative control signal. This indicates that the BASS is more sensitive than the commercial spectrometric system (LOD 0.59 µM). Given that the optical path of the microfluidic chip is only 1.5 mm while the optical path of the cuvette is 1.0 cm, detection sensitivity could be improved by at least one order of magnitude (~30 folds herein) if using the same optical path. Along with the impressive performance from our portable spectrophotometric system, the spectrophotometric system can perform POC analysis on a microfluidic chip with only a tiny amount of sample needed (~10 µL/assay). Compared to the commercial cuvette-based spectrophotometric system which requires at least 0.8 mL reagent for one assay, our microfluidic chip-based spectrophotometric system significantly reduces the reagent consumption.
Figure 5.
Calibration curve of the battery-powered spectrophotometric system for detection of various concentrations of methylene blue solutions. Inset is a photograph of the dark box.
LAMP Detection and Subsequent Quantitative DNA Analysis using the BASS
We further explored the potential application of the BASS by performing DNA-based high-sensitivity pathogen detection through LAMP. LAMP is a simple, rapid, specific and cost-effective nucleic acid amplification method that allows the target DNA sequence amplified at a constant temperature of 60–65 °C.25 Avoiding the use of expensive equipment (e.g. thermal cyclers) for stringent thermal cycling, LAMP is more compatible with microfluidic chips without complicated and costly microfabrication of heating elements and temperature sensors, and has great potential for POC disease diagnosis.6, 21, 26–29
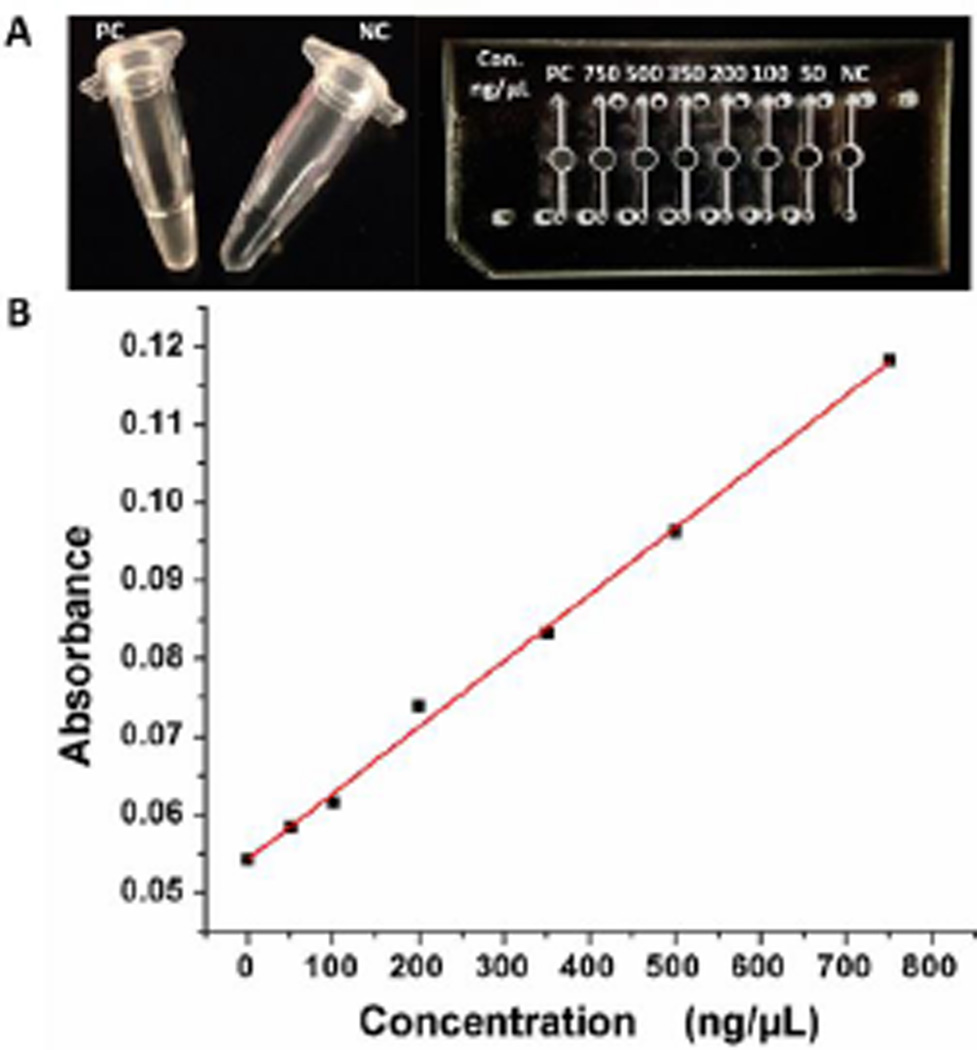
We performed the on-chip LAMP for detection of a main meningitis-causing bacteria, Neisseria meningitidis, which can be fatal in as little as 24 hours after symptoms are noticed and has a high incidence rate in high-poverty areas.30 Therefore, a simple, low-cost, highly-sensitive POC analysis is in great need for immediate diagnosis of meningitis. The on-chip LAMP was heated at 63 °C for 45 min by using either a portable-battery-powered heater with an inexpensive proportional-integral-derivative (PID)-based temperature controller devised by our laboratory or a water bath. During the LAMP process, a by product of magnesium pyrophosphate precipitate is formed when the targeted DNA is present. Therefore, the presence of the magnesium pyrophosphate precipitate can serve as an indicator of the presence of the target pathogen’s DNA by turbidity tests. However, it is challenging to use turbidity testing for high-sensitivity visual detection. Figure 6A shows the turbidity visual detection both in microcentrifuge tubes and the microfluidic chip. It showed that the turbidity difference between the positive control (PC) and negative control (NC) could be distinguished in the tubes, but could barely be distinguished in the microfluidic chip even at the highest concentration without any dilution (the detection well with PC) which was mainly due to shorter optical path length from the microfluidic device. However, nucleic acid samples are usually limited, a challenge for cuvette-based spectrophotometric system due to its large amount of reagent requirements.
Figure 6.
LAMP detection and subsequent quantitative nucleic acid analysis using the battery-powered spectrophotometric system. (A) Photographs of turbidity-based LAMP detection in microcentrifuge tubes (left) and the microfluidic chip (right). B) Calibration curve for on-chip LAMP detection and quantitative nucleic acids analysis using the BASS.
To address these issues, we performed sensitive LAMP detection and subsequent quantitative nucleic acid quantification on a chip using our portable BASS based on turbidity testing at 650 nm. The LAMP products were tested on the microfluidic device and their corresponding absorbance signals were recorded. Excitingly, a clear difference between the LAMP amplicon and the negative control on the microfluidic device was observed (Figure 6B), even though the optical path length from the microfluidic device was short and only 10 µL of samples were needed. We further made a series of dilutions from the LAMP amplicons to study the relationship between the DNA concentration and absorbance at 650 nm. It was interesting to find that, with the increase of nucleic acid concentration, stronger absorbance signals were observed. Figure 6B shows a linear calibration curve plotted by using the corresponding absorbance signals versus various concentrations of nucleic acids from the LAMP products ranging from 0 to 750.0 ng/µL, with R2 of 0.9968. Compared to the absorbance signal of the negative control, even 50.0 ng/µL of nucleic acids showed well distinguishable absorbance signal. The LOD of nucleic acids was calculated to be as low as 15.3 ng/µL on the basis of the 3-fold standards deviations of the negative control signal, which was ~50 folds lower than the nucleic acid concentration of the undiluted LAMP products. This also indicates the detection sensitivity of our spectrophotometric system is approaching to that of Nanodrop which has a LOD of ~2.5 ng/µL,31 whereas the Nanodrop may cost more than $10000 Therefore, the BASS is capable to achieve high-sensitivity LAMP detection and subsequent quantitative nucleic acid analysis under low-resource settings (e.g. without AC electricity).
Conclusions
We developed a fully battery-powered spectrophotometric system (BASS) for quantitative POC analysis on a microfluidic chip. Compared to a commercial spectrometric system, our portable spectrophotometric system has five significant features: (1) The spectrophotometric system that we developed is fully battery-powered without relying on external AC electricity. This feature is significant for POC analysis and in-field detection in resource-poor settings. (2) The spectrophotometric system is cost effective, in which all the components in the dark box cost about $18. (3) Our spectrophotometric system exhibits high detection sensitivity. The on-chip LAMP detection demonstrated that the detection sensitivity is approaching to that of the costly Nanodrop. (4) The BASS that we developed is compatible with various microfluidic devices, and thus can be used as a universal spectrophotometric detection system for broad applications on microfluidic devices. Additionally, the use of microfluidic devices in the spectrophotometric system significantly reduces the reagent consumption to the microliter level, which is especially important for nucleic acid analysis and clinical testing that usually only limited amounts of samples are available. (5) LAMP detection and subsequent nucleic acid analysis will enable wide applications of the spectrophotometric system due to the widely-used DNA testing techniques. All these features make the BASS highly suitable for a variety of POC analyses such as human health diagnostics, food safety monitoring and environmental analysis. This is practically significant for developing countries where financial resources are limited.
Supplementary Material
Acknowledgments
The authors would like to acknowledge financial support of the NIH/NIGMS under award number SC2GM105584, and the NIH/NIAID under award number R21AI107415. Financial support from the IDR Program at the UTEP and the NIH RCMI Pilot Grant is also gratefully acknowledged. We would like to express special thanks to the staff of the Genomic Analysis Core Facility of UTEP. This core is supported by Grant G12MD007592 from NIMHD.
Footnotes
Electronic Supplementary Information (ESI) available: [details of any supplementary information available should be included here]. See DOI: 10.1039/x0xx00000x
Notes and references
‡ Footnotes relating to the main text should appear here. These might include comments relevant to but not central to the matter under discussion, limited experimental and spectral data, and crystallographic data.
§
§§
etc.
- 1.Gubala V, Harris LF, Ricco AJ, Tan MX, Williams DE. Analytical chemistry. 2011;84:487–515. doi: 10.1021/ac2030199. [DOI] [PubMed] [Google Scholar]
- 2.Xu X, Akay A, Wei H, Wang S, Pingguan-Murphy B, Erlandsson B-E, Li X, Lee W, Hu J, Wang L. Proceedings of the IEEE. 2015;103:236–247. [Google Scholar]
- 3.Shen F, Li X, Li PC. Biomicrofluidics. 2014;8:014109. doi: 10.1063/1.4866358. [DOI] [PMC free article] [PubMed] [Google Scholar]
- 4.Dou M, Sanjay ST, Benhabib M, Xu F, Li X. Talanta. 2015;145:43–54. doi: 10.1016/j.talanta.2015.04.068. [DOI] [PMC free article] [PubMed] [Google Scholar]
- 5.Sanjay ST, Fu G, Dou M, Xu F, Liu R, Qi H, Li X. Analyst. 2015;140:7062–7081. doi: 10.1039/c5an00780a. [DOI] [PMC free article] [PubMed] [Google Scholar]
- 6.Dou M, Dominguez DC, Li X, Sanchez J, Scott G. Analytical chemistry. 2014;86:7978–7986. doi: 10.1021/ac5021694. [DOI] [PMC free article] [PubMed] [Google Scholar]
- 7.Zuo P, Li X, Dominguez DC, Ye B-C. Lab Chip. 2013;13:3921–3928. doi: 10.1039/c3lc50654a. [DOI] [PMC free article] [PubMed] [Google Scholar]
- 8.Li X, Valadez AV, Zuo P, Nie Z. Bioanalysis. 2012;4:1509–1525. doi: 10.4155/bio.12.133. [DOI] [PMC free article] [PubMed] [Google Scholar]
- 9.Li XJ, Zhou Y. Microfluidic devices for biomedical applications. Elsevier; 2013. [Google Scholar]
- 10.Dou M, García JM, Zhan S, Li X. Chemical Communications. 2016;52:3470–3473. doi: 10.1039/c5cc09066k. [DOI] [PMC free article] [PubMed] [Google Scholar]
- 11.Chin CD, Linder V, Sia SK. Lab on a Chip. 2012;12:2118–2134. doi: 10.1039/c2lc21204h. [DOI] [PubMed] [Google Scholar]
- 12.Yetisen AK, Akram MS, Lowe CR. Lab on a Chip. 2013;13:2210–2251. doi: 10.1039/c3lc50169h. [DOI] [PubMed] [Google Scholar]
- 13.Sun J, Xianyu Y, Jiang X. Chemical Society Reviews. 2014;43:6239–6253. doi: 10.1039/c4cs00125g. [DOI] [PubMed] [Google Scholar]
- 14.Fu G, Sanjay ST, Dou M, Li XJ. Nanoscale. 2016;8:5422–5427. doi: 10.1039/c5nr09051b. [DOI] [PMC free article] [PubMed] [Google Scholar]
- 15.Fu E, Chinowsky T, Nelson K, Johnston K, Edwards T, Helton K, Grow M, Miller JW, Yager P. Annals of the New York Academy of Sciences. 2007;1098:335–344. doi: 10.1196/annals.1384.026. [DOI] [PubMed] [Google Scholar]
- 16.Ojeda CB, Rojas FS. Microchemical Journal. 2013;106:1–16. [Google Scholar]
- 17.Ma J, Yang B, Byrne RH. Journal of hazardous materials. 2012;219:247–252. doi: 10.1016/j.jhazmat.2012.04.001. [DOI] [PubMed] [Google Scholar]
- 18.Goto H, Asanome N, Suzuki K, Sano T, Saito H, Abe Y, Chuba M, Nishio T. Breeding science. 2014;63:489. doi: 10.1270/jsbbs.63.489. [DOI] [PMC free article] [PubMed] [Google Scholar]
- 19.Zhang X, Fang Y, Zhao Y. Sensors & Transducers. 2013;148:47. [Google Scholar]
- 20.Sia SK, Linder V, Parviz BA, Siegel A, Whitesides GM. Angewandte Chemie International Edition. 2004;43:498–502. doi: 10.1002/anie.200353016. [DOI] [PubMed] [Google Scholar]
- 21.Fang X, Liu Y, Kong J, Jiang X. Analytical Chemistry. 2010;82:3002–3006. doi: 10.1021/ac1000652. [DOI] [PubMed] [Google Scholar]
- 22.Fang X, Chen H, Yu S, Jiang X, Kong J. Analytical Chemistry. 2010;83:690–695. doi: 10.1021/ac102858j. [DOI] [PubMed] [Google Scholar]
- 23.Zhang Z, Liao Y, Ai B, Liu C. The Annals of thoracic surgery. 2015;99:238–242. doi: 10.1016/j.athoracsur.2014.07.071. [DOI] [PubMed] [Google Scholar]
- 24.Lo JC, Darracq MA, Clark RF. The Journal of emergency medicine. 2014;46:670–679. doi: 10.1016/j.jemermed.2013.08.102. [DOI] [PubMed] [Google Scholar]
- 25.Tomita N, Mori Y, Kanda H, Notomi T. Nature protocols. 2008;3:877–882. doi: 10.1038/nprot.2008.57. [DOI] [PubMed] [Google Scholar]
- 26.Fang X, Chen H, Xu L, Jiang X, Wu W, Kong J. Lab on a Chip. 2012;12:1495–1499. doi: 10.1039/c2lc40055c. [DOI] [PubMed] [Google Scholar]
- 27.Safavieh M, Ahmed MU, Sokullu E, Ng A, Braescu L, Zourob M. Analyst. 2014;139:482–487. doi: 10.1039/c3an01859h. [DOI] [PubMed] [Google Scholar]
- 28.Safavieh M, Ahmed MU, Tolba M, Zourob M. Biosensors and Bioelectronics. 2012;31:523–528. doi: 10.1016/j.bios.2011.11.032. [DOI] [PubMed] [Google Scholar]
- 29.Wang C-H, Lien K-Y, Wu J-J, Lee G-B. Lab on a Chip. 2011;11:1521–1531. doi: 10.1039/c0lc00430h. [DOI] [PubMed] [Google Scholar]
- 30.Castillo D. WHO Manual. (2nd) 2011 [Google Scholar]
- 31.Gallagher SR, Desjardins PR. Current Protocols in Human Genetics. 2007 doi: 10.1002/0471142905.hga03ds53. A 3D. 1-A. 3D. 21. [DOI] [PubMed] [Google Scholar]
Associated Data
This section collects any data citations, data availability statements, or supplementary materials included in this article.


