Abstract
The development of new sensitive, cost-effective and user-friendly colorimetric bioassays is in increasing demand to meet the requirement of modern clinical diagnostics and field detection. Herein, a novel iron oxide-to-Prussian blue (PB) nanoparticles (NPs) conversion strategy was developed and applied to sensitive colorimetric immunosensing of cancer biomarkers. In a typical sandwich-type immunosensing system, the captured spherical antibody-conjugated iron oxide NPs were transformed into cubic PB NPs, which exhibited highly visible blue color with high molar extinction coefficients. Hence, a new colorimetric immunosensing strategy was developed as a result of this low cost and simple transformation process. Without the aid of any complex nanoparticle stabilizing ligands and signal amplification process, prostate-specific antigen as a model analyte can be detected at a concentration as low as 1.0 ng·mL−1 by the naked eye with good reliability for detection of real human serum samples. This is the first attempt to develop and apply the iron oxide-to-PB NPs colorimetric conversion strategy for immunosensing, and shows great promise for the development of new sensitive, cost-effective and user-friendly colorimetric bioassays in various bioanalytical applications, especially in low-resource settings.
Introduction
The “point-of-care” (POC) immunosensing of disease-related proteins, especially disease biomarkers, has been increasingly desirable to meet the requirement of modern clinical diagnostics.1-4 Different analytical principles such as chemiluminescence, fluorescence, electrochemistry and light scattering have been adopted for immunosensing.5-8 However, these methodologies are usually unadaptable for POC diagnostics. One of the most critical bottlenecks for POC detection is their analytical readout methods because most readout methods require expensive and bulky instruments and well-equipped laboratories.9 Attacking this problem head on, the development of new immunoassays suitable for POC detection is thereby in increasing demand.
Hence, colorimetric assays have been the subject of great research interest because of its incomparable advantages for POC detection such as simplicity, practicality and ease of result readout by only the naked eye.9, 10 A variety of nanomaterials have been employed as colorimetric probes because of their unique physical and chemical properties.11 Among those colorimetric probes, noble metal nanomaterials, especially gold nanoparticles (NPs), have been extensively used in nanoparticle aggregation-based colorimetric assays due to their high extinction coefficients and distance-dependent optical properties.12, 13 However, gold NPs as colorimetric probes have to be confronted with some limitations for their wide application especially in resource-limited settings because of their intrinsic high cost. In order to achieve satisfactory sensitivity, the usage of complex nanoparticle stabilizing ligands and multiple signal amplification processes are generally indispensable in these colorimetric assays.9, 10, 14, 15 Additionally, the nondirective property of nanoparticle aggregation might lead to inaccurate target determination,16 such as the false positive response as a result of the interfering environment-induced nanoparticle self-aggregation.17, 18 Hence, the development of new simple, sensitive and cost-effective colorimetric immunosensing strategies is of great importance.
With the rapid development of nanoscience, the exploration of nanomaterials with different physical and chemical properties for biosensing provides new opportunities to develop novel colorimetric immunosensing strategies. Prussian blue (PB), an ancient blue dye, is a prototype of mixed-valence transition metal hexacyanoferrates.19 PB NPs have shown great promise for various applications due to their unique electrochemical, catalytic and magnetic properties.20 In addition to their low cost, nontoxicity, simple preparation and high structural stability, PB NPs exhibit highly visible blue color with high molar extinction coefficients (1.09 × 10⁹ M−1·cm−1 at 808 nm) comparable to that of gold nanorods in the near-infrared region (700-900 nm),19 providing great potential as a promising colorimetric probe for immunosensing. Although PB NPs have been used in different types of assays such as the electrochemical sensing and colorimetric detection of glucose, H2O2, vitamin C and hydralazine,21-24 to the best of our knowledge, the iron oxide-to-PB NPs transformation strategy has never been reported for colorimetric immunosensing. Through this conversion strategy, a number of biomolecules can be detected by this cost-effective and sensitive colorimetric method, thus expanding the application of those existing methods using PB as the colorimetric probe.
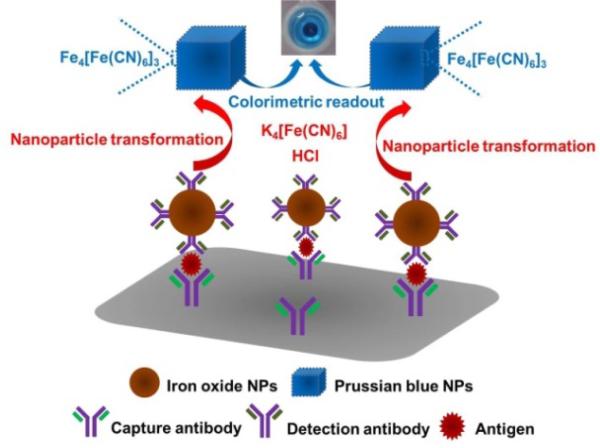
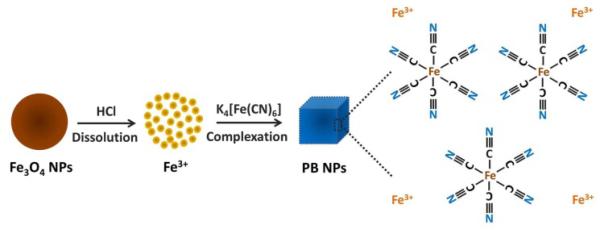
Herein, a new colorimetric immunoassay has been proposed for sensitive detection of cancer biomarkers using a novel iron oxide-to-PB NPs colorimetric conversion strategy as shown in Fig. 1. Using a typical sandwich-type immunoassay as a model system, monoclonal antibody and iron oxide NPs-labelled polyclonal antibody are used as the capture antibody and detection antibody, respectively. After the immunoassay reaction, spherical iron oxide NPs captured in the sandwich-type immunosensing system are dissolved in an acidic solution to release ferric ions, followed by the reaction with potassium ferrocyanide to produce cubic PB NPs, as shown in Scheme 1. As a result of this novel nanoparticle conversion process, a highly visible color change is achieved, which enables a new colorimetric immunosensing method without the aid of any complex nanoparticle stabilizing ligands and signal amplification process. Using prostate-specific antigen (PSA) as a model analyte, the performance of the colorimetric immunoassay and its reliability for PSA detection in real human serum samples have been systematically studied. As far as we know, this is the first attempt to develop and apply the iron oxide-to-PB NPs conversion strategy for colorimetric immunosensing of cancer biomarkers, which have great potential for development of new sensitive, cost-effective and user-friendly (e.g. no needs of stabilizing ligands and multiple signal amplification processes, and nontoxic property of PB) colorimetric bioassays in various bioanalytical and environmental fields.
Fig. 1.
Schematic illustration of the colorimetric immunoassay using the iron oxide-to-PB NPs colorimetric conversion strategy.
Scheme 1.
Schematic illustration of the iron oxide-to-PB NPs conversion process.
Experimental
Materials
Carboxyl-functionalized iron oxide nanoparticles (NPs) with a diameter of 40 nm were purchased from Ocean NanoTech LLC (USA). Polyclonal rabbit anti-human PSA antibody, monoclonal mouse anti-human PSA antibody and carcino-embryonic antigen (CEA) were purchased from Abcam (USA). Prostate-specific antigen (PSA), bovine serum albumin (BSA) and serum from normal human male AB plasma were obtained from Sigma-Aldrich (USA). Hepatitis B surface antigen (HBsAg) was acquired from Fitzgerald Industries International Inc. (USA). PB NPs were typically prepared according to the published literature.19 Unless otherwise stated, all other chemicals were of analytical grade and used as received.
Preparation of antibody-conjugated iron oxide NPs
The polyclonal rabbit anti-human PSA antibody was covalently conjugated to carboxyl-functionalized iron oxide NPs through the typical carbodiimide method. Typically, 1.0 mg iron oxide NPs were dispersed in 2.0 mL deionized water with ultrasonication. The aqueous mixture (25.0 μL) of N-hydroxysulfosuccinimide (Sulfo-NHS) and 1-ethyl-3-[3-dimethylaminopropyl]carbodiimide hydrochloride (EDC) with the same concentration of 25.0 mg·mL−1 was added to the nanoparticle dispersion, followed by reactions at room temperature for 30 min under gentle stirring. 80.0 μg polyclonal rabbit anti-human PSA antibody was then added into the above nanoparticle dispersion, followed by reactions at room temperature for 2.0 h under gentle stirring. The nanoparticle dispersion was centrifuged at 11,000 rpm for 10.0 minutes at 4.0 °C to collect the antibody-conjugated iron oxide NPs, which were then washed with PBS (pH=7.4, 0.01 M) for 3 times. The antibody-conjugated iron oxide NPs were finally dispersed in 2.0 mL PBS (pH=7.4, 0.01 M) containing 0.2% BSA. The nanoparticle dispersions were stored at 4.0 °C before use.
Procedures of the colorimetric immunoassay
A 100 μL monoclonal mouse anti-human PSA antibody solution (30.0 μg·mL−1) was added in each PCR tube (200 μL) and incubated for 12.0 h at 4.0 °C. A 200 μL blocking buffer containing 5.0% BSA was then used to block the tubes for 2.0 h at 37.5 °C, followed by incubation with different concentrations of standard PSA solutions containing 5.0% BSA for 2.0 h at 37.5 °C. After thoroughly washing, a 100 μL polyclonal anti-PSA antibody-conjugated iron oxide NPs suspension (0.5 mg·mL−1) was added in each tube for further incubation at 37.5 °C for 2.0 h. Finally, the PCR tubes were thoroughly washed with PBS.
To transform iron oxide NPs captured in the sandwich-type immunosensing system into PB NPs, a 120 μL HCl solution (0.1 M) was added into each tube, followed by ultrasonication for 1.0 h at room temperature. A 30.0 μL potassium ferrocyanide aqueous solution (90.0 mM) was then added into each tube to produce PB NPs from the reaction between ferric ions and ferrocyanide ions under acidic condition. The immunosensing solutions were thoroughly mixed every 10 min, and were finally used for the UV-Vis spectroscopic characterization, Fourier transform infrared spectroscopic (FTIR) and Transmission electron microscopic (TEM) characterization after the reaction for 1.0 h.
Characterization and instruments
UV-Vis spectrometry, FTIR and TEM were used to characterize the immunosensing solutions before and after the iron oxide-to-PB NPs conversion process. UV-Vis spectra of the immunosensing solutions were performed on a 96-well microplate using a SPECTROstar Nano Microplate Reader (BMG LABTECH). FTIR was performed on a Spectrum 100 FT-IR spectrometer (PerkinElmer, Inc.). Immunosensing solutions at the PSA concentration of 64.0 ng·mL−1 before and after the iron oxide-to-PB NPs conversion process were dropped on Whatman® cellulose chromatography papers (Sigma-Aldrich), followed by air dry at room temperature for the FTIR measurement using the chromatography paper as the blank. TEM was carried out to observe the morphology of nanoparticles in the immunosensing solutions using a JOEL 3200FS cryo-Transmission electron microscope. Immunosensing solutions at the PSA concentration of 64.0 ng·mL−1 before and after the iron oxide-to-PB NPs conversion process were deposited on carbon-coated copper grids for the TEM imaging. Additionally, photographs were taken with a Canon EOS 600D camera to record the color changes.
Colorimetric detection in human serum
Serum from normal human was used for the real sample detection to validate the reliability of the developed colorimetric immunoassay. 10.0 μL different concentrations of standard PSA solutions were spiked into 1.0 mL human serum which was pre-diluted 3 folds with PBS to prepare the spiked serum samples with the final PSA concentrations of 4.0, 8.0 and 16.0 ng·mL−1, respectively. After thoroughly mixing, the concentrations of PSA in the spiked serum samples were tested with the developed colorimetric immunoassay. In addition, to validate the analytical reliability of the developed colorimetric immunoassay for detection of real human serum samples, the conventional UV-Vis spectrometry was used to measure the PSA spiked in the human serum samples to calculate the spike recoveries.
Results and Discussion
Characterization and confirmation of the nanoparticle colorimetric conversion process
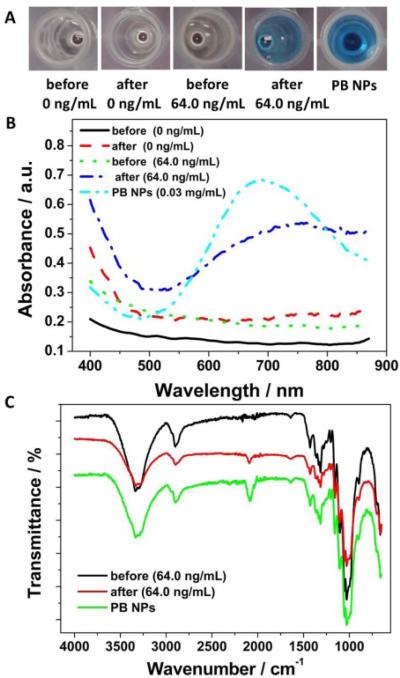
To confirm the generation of PB NPs in the immunosensing solutions after the iron oxide-to-PB NPs conversion process, colorimetric, UV-Vis spectroscopic and Fourier transform infrared spectroscopic (FTIR) characterization were carried out. Fig. 2A shows the photographs of the immunosensing solutions before and after the nanoparticle conversion process. No apparent color change was observed in the absence of the target PSA after the nanoparticle conversion process, indicating the absence of PB NPs in the immunosensing solution, because no iron oxide NPs were captured in the immunosensing system without the target PSA. As expected, a clear color change from light brown to bright blue was observed in the presence of 64.0 ng·mL−1 PSA after the nanoparticle conversion process. The light brown color before the nanoparticle conversion process was attributed to the iron oxide NPs captured in the immunosensing system. The bright blue color after the nanoparticle conversion process was consistent with the typical color of PB NPs, revealing the generation of PB NPs in the immunosensing solution.
Fig. 2.
Photographs (A) and UV-Vis spectra (B) of PB NPs aqueous dispersion and the immunosensing solutions at different PSA concentrations before and after the nanoparticle conversion process. (C) FTIR of PB NPs and the immunosensing solution at the PSA concentration of 64.0 ng·mL−1 before and after the nanoparticle conversion process. The reaction time of the nanoparticle conversion process was 1.0 h.
With the clear color change after the nanoparticle conversion process, a broad absorption peak was observed at 748 nm in the UV-Vis spectra of the immunosensing solution (64.0 ng·mL−1 PSA) (Fig. 2B), while no absorption peak was exhibited before the nanoparticle conversion process. The absorption peak corresponded well with that of PB NPs attributed to the charge transfer transition between Fe (II) and Fe (III) in PB NPs,19, 20 demonstrating the generation of PB in the immunosensing solution after the nanoparticle conversion process. The slight redshift of the absorption peak of PB in the immunosensing solution might be attributed to the different matrix effect from the immunosensing solution. No noticeable absorption peak was recorded both before and after the nanoparticle conversion process in the absence of the target PSA, which indicated that no PB was generated in the absence of the target PSA. These results confirmed the successful iron oxide-to-PB conversion process in the presence of the target PSA, providing the possibilities for colorimetric immunosensing of PSA.
Along with color changes and UV-Vis spectra, FTIR was utilized to confirm the generation of PB in the immunosensing solution, as shown in Fig. 2C. As can be seen, an apparent stretching band was observed at 2085 cm−1 after the nanoparticle conversion process, while no band was observed before the nanoparticle conversion process. Significantly, the stretching band corresponded well with that of PB NPs (2085 cm−1), demonstrating the successful iron oxide-to-PB conversion process in the presence of the target PSA. The stretching band can be attributed to the CN stretching in the formed [FeII–CN–FeIII] structure in PB NPs.25, 26
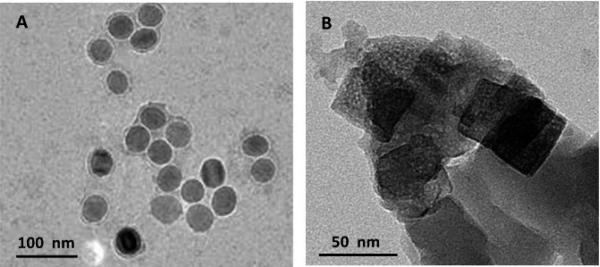
To further confirm the iron oxide-to-PB NPs conversion process, TEM was used to study the morphological change of nanoparticles in the immunosensing solutions. Fig. 3 shows the TEM images of nanoparticles in the immunosensing solutions before and after the nanoparticle conversion process. It can be seen that before the conversion, a number of iron oxide NPs with uniformly spherical morphology at an average diameter of 40 nm were observed in the TEM image, which was in good agreement with the product information from the manufacturer (Ocean NanoTech LLC, USA). However, an obvious change in morphology of the nanoparticles was observed after the nanoparticle conversion process. With the disappearance of the spherical iron oxide NPs, nanoparticles with clear cubic morphology at the size from 20 to 100 nm were observed in the TEM image. The cubic morphology of the nanoparticles was in good agreement with the well-known cubic morphology of PB NPs.19, 27, 28 Spherical iron oxide NPs captured in the sandwich-type immunoassay system were first dissolved in acidic conditions under ultrasonication to release ferric ions (Fe3+), followed by the reaction between ferric ions and the added ferrocyanide ions to produce PB NPs that had a typical cubic morphology. The wide size distribution of PB NPs in the immunosensing solution might be due to the absence of surface capping agents during the nucleation between ferric ions and potassium ferrocyanide.28 These results further confirmed the successful spherical iron oxide-to-cubic PB NPs conversion process.
Fig. 3.
TEM images of nanoparticles in immunosensing solutions at the PSA concentration of 64.0 ng·mL−1 before (A) and after (B) the nanoparticle conversion process
Colorimetric immunosensing using the nanoparticle conversion strategy
To study the feasibility of the iron oxide-to-PB NPs conversion strategy for colorimetric immunosensing, different concentrations of standard PSA in bovine serum albumin (BSA) solutions were tested with the immunoassay method illustrated in Fig. 1.
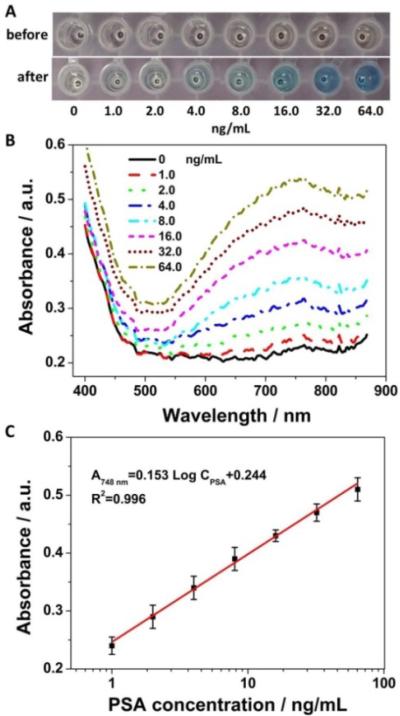
Fig. 4A shows that as the PSA concentration increased in the range from 1.0 to 64.0 ng·mL−1, a gradually deepening tendency from light yellow to bright blue in the color of the immunosensing solutions was observed after the nanoparticle conversion process. As the PSA concentration increased, the amount of iron oxide NPs captured in the immunosensing system increased accordingly, thereby resulting in the concentration increase of PB NPs generated from the iron oxide-to-PB NPs conversion process. It was reported that PB NPs showed high molar extinction coefficients comparable to that of gold nanorods in the near-infrared region (700-900 nm).19 Therefore, by employing PB NPs with high structural stability and simple transformation as a colorimetric probe, the iron oxide-to-PB NPs conversion process provides a new promising strategy for cost-effective and easy-to-use colorimetric immunosensing. In addition, with the clear color change as the PSA concentration increased, the absorption peak of PB NPs at 748 nm in the UV-Vis spectra also increased (Fig. 4B). Excitingly, it was found that the absorbance at 748 nm was proportional to the logarithm of the PSA concentration in the range from 1.0 to 64.0 ng·mL−1, the common clinically relevant diagnostic level,29 with a correlation coefficient of 0.996 (Fig. 4C). The result demonstrated good correspondence between the colorimetric immunosensing and the UV-Vis spectrometry.
Fig. 4.
Photographs (A) and UV-Vis spectra (B) of the immunosensing solutions at different PSA concentrations (5% BSA) before and after the nanoparticle conversion process. (C) Calibration plot of absorbance at 748 nm in UV-Vis spectra vs. logarithm of the PSA concentration. Error bars indicate standard deviations (n=3).
It was also found that visible color difference between 1.0 ng·mL−1 PSA and the control can be distinguished by the naked eye, as shown in Fig. 4A, suggesting high sensitivity of the colorimetric immunosensing method without the aid of any nanoparticle stabilizing ligands and signal amplification process. The distinguishable color difference between 1.0 ng·mL−1 PSA and the control was further confirmed by the UV-Vis spectra as shown in Fig. 4B. Hence, PSA could be quickly detected at a concentration as low as 1.0 ng·mL−1 with the naked eye. Although this concentration is higher than that of some electrochemical and fluorescence methods,30, 31 it is much lower (~80 folds) than that of the reported Au NPs-based colorimetric PSA assay (80 ng·mL−1),32 indicating the high-sensitivity of our method. This LOD is also comparable to the conventional ELISA method (LOD: 1.0 ng·mL−1) and commercial PSA ELISA kits (LOD: 1.0 ng·mL−1, Biocell Biotechnol. Co., Ltd., Zhengzhou, China) using spectrometers as reported in the published literature.33 Furthermore, it was worth noting that the colorimetric immunoassay can meet the requirement of clinical diagnostics because the threshold concentration of PSA in human serum in prostate cancer diagnostics is 4.0 ng·mL−1.33
Specificity of the colorimetric immunosensing strategy
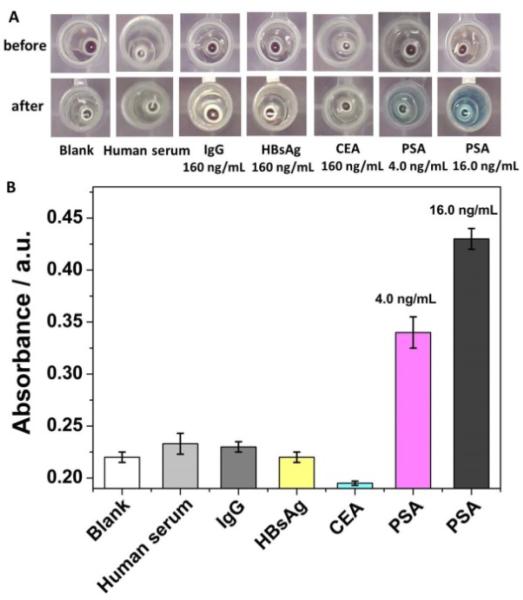
To evaluate the specificity of the colorimetric immunosensing strategy, some other common interfering substances in serum with 10-fold higher concentrations than PSA (16.0 ng·mL−1) including carcino-embryonic antigen (CEA), IgG, and hepatitis B surface antigen (HBsAg) were tested with the colorimetric immunoassay. It should be noted that 4.0 ng·mL−1 was used as the lowest PSA concentration for specificity study because of its clinical diagnostic significance as a lower threshold diagnostic concentration.33 Normal human serum was also used as an interfering substance. As shown in Fig. 5A, only the immunosensing solution obtained from the target PSA (4.0 and 16.0 ng·mL−1) exhibited a clear color change to blue after the nanoparticle conversion process. In addition, the UV-Vis spectra (Fig. 5B) shows that only the immunosensing solution obtained from the target PSA had obvious absorption at 748 nm, while other interfering substances exhibited less than 4.7% absorbance in comparison with PSA (relative to blank). These results confirmed high anti-interference capability of the colorimetric immunosensing strategy for PSA detection in the presence of high concentrations of interfering substances.
Fig. 5.
Specificity study. Photographs (A) and absorbance at 748 nm (B) of the immunosensing solutions obtained from the target PSA and different interfering substances before and after the nanoparticle conversion process. Serum from normal human was pre-diluted 3 folds with PBS. Error bars indicate standard deviations (n=3).
Colorimetric immunosensing in human serum samples
To validate the analytical accuracy of the developed colorimetric immunosensing method for detection of real samples, serum samples from normal human were spiked with different concentrations of standard PSA for the colorimetric determination. As an important lower threshold concentration for clinical prostate cancer diagnostics,33 4.0 ng·mL−1 was herein selected as the lowest spiked concentration for the validation study.
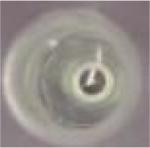
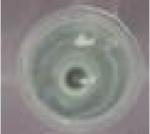
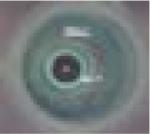
A distinct difference in the color of the immunosensing solutions was observed by the naked eye as shown in Table 1. As the concentration of PSA spiked in the serum increased, a deepening trend of the color to blue was exhibited, which was consistent with that from Fig. 4A. Additionally, in order to confirm the results from color changes, conventional UV-Vis spectrometry was further used to detect PSA in the spiked human serum samples. The detection results obtained from the UV-Vis spectroscopic measurement corresponded well with that of the color changes. The analytical recoveries were in the range from 91.3-93.1%, which were within the acceptable criteria for bioanalytical method validation.34
Table 1.
Detection of PSA spiked in human serum samples by the colorimetric immunoassay (n=4).
| Serum sample number | Standard PSA concentration (ng·mL−1) | Color changes | UV-Vis detection result (ng·mL−1) | Recovery (%) |
|---|---|---|---|---|
| Control | 0 |
|
||
| No. 1 | 4.0 |
|
3.65±0.20 | 91.3±5.0 |
| No. 2 | 8.0 |
|
7.32±0.36 | 91.6±4.6 |
| No. 3 | 16.0 |

|
14.9±0.90 | 93.1±5.7 |
Conclusions
In conclusion, a novel iron oxide-to-PB NPs colorimetric conversion strategy has been developed for cost-effective and sensitive colorimetric assays. We have demonstrated its application in sensitive detection of cancer biomarkers through a new colorimetric immunoassay, during which spherical iron oxide NPs captured in a sandwich-type immunosensing system were transformed into cubic PB NPs which exhibit highly visible blue color and high extinction coefficients. Without the aid of any complex nanoparticle stabilizing ligands and signal amplification processes which are generally required for traditional Au NPs-based colorimetric assays, PSA as a model analyte can be detected at a low concentration of 1.0 ng·mL−1 by our new colorimetric method. In comparison with the reported Au NPs-based colorimetric assay,32 our method is much more sensitive, with the LOD ~80 folds lower than that of the Au NPs-based colorimetric assay. Additionally, the cost of our method is much lower than the Au NPs-based colorimetric method. We estimated that the unit price of Au nanoparticles ($/mg) was ~48000 folds more expensive than PB and iron oxide NPs (See Table S1 in Supporting Information for comparison details). These unique advantages of the colorimetric immunosensing strategy make it particularly promising for development of sensitive, cost-effective and convenient colorimetric POC bioassays for a broad range of bioanalytical and environmental applications, particularly in resource-poor settings. This conversion strategy also provides potential for developing other types of colorimetric methods based on PB NPs. But it should be noted that there are still several limitations of this new method for POC application, such as the relatively long and complicated nanoparticle transformation process. However, these limitations can be addressed to enhance the potential for POC detection by further optimizing the reaction conditions and simplifying the transformation procedure (e.g. carrying out the transformation reaction during ultrasonication). In addition, the integration of the new method on a microfluidic paper-based device using a colorimetric readout card35 or some software like ImageJ36 for quantitative analysis will provide a new opportunity to achieve simpler, faster, more sensitive, more objective and user-friendly POC detection. This work is underway in our group.
Supplementary Material
Acknowledgements
We would like to acknowledge the financial support from NIH/NIGMS (SC2GM105584) and NIH/NIAID (R21AI107415). Financial support from NIH RCMI for the BBRC Pilot grant, UTEP for the IDR and MRAP programs, University of Texas (UT) System for the STARS award, is also greatly acknowledged. We are grateful to the support from Dr. Chuan Xiao's Group at UTEP for the spectroscopic measurement and Dr. Bernal's group for TEM images.
Footnotes
† Electronic Supplementary Information (ESI) available: See DOI: 10.1039/x0xx00000x
Notes and references
- 1.Sun JS, Xianyu YL, Jiang XY. Chem. Soc. Rev. 2014;43:6239–6253. doi: 10.1039/c4cs00125g. [DOI] [PubMed] [Google Scholar]
- 2.Sanjay ST, Fu GL, Dou MW, Xu F, Liu RT, Qi H, Li XJ. Analyst. 2015;140:7062–7081. doi: 10.1039/c5an00780a. [DOI] [PMC free article] [PubMed] [Google Scholar]
- 3.Dou MW, Sanjay ST, Benhabib M, Xu F, Li XJ. Talanta. 2015;145:43–54. doi: 10.1016/j.talanta.2015.04.068. [DOI] [PMC free article] [PubMed] [Google Scholar]
- 4.Zuo P, Li XJ, Dominguez DC, Ye BC. Lab Chip. 2013;13:3921–3928. doi: 10.1039/c3lc50654a. [DOI] [PMC free article] [PubMed] [Google Scholar]
- 5.Al-Ogaidi I, Gou HL, Aguilar ZP, Guo SW, Melconian AK, Al-Kazaz AKA, Meng FK, Wu NQ. Chem. Commun. 2014;50:1344–1346. doi: 10.1039/c3cc47701k. [DOI] [PubMed] [Google Scholar]
- 6.Li YX, Hong M, Lin YQ, Bin Q, Lin ZY, Cai ZW, Chen GN. Chem. Commun. 2012;48:6562–6564. doi: 10.1039/c2cc31990j. [DOI] [PubMed] [Google Scholar]
- 7.Chun C, Joo J, Kwon D, Kim CS, Cha HJ, Chung MS, Jeon S. Chem. Commun. 2011;47:11047–11049. doi: 10.1039/c1cc14024h. [DOI] [PubMed] [Google Scholar]
- 8.Li X, Nie Z, Cheng C, Goodale A, Whitesides G. Proc. Micro Total Analysis Systems. 2010;14:1487–1489. [Google Scholar]
- 9.Qu WS, Liu YY, Liu DB, Wang Z, Jiang XY. Angew. Chem. Int. Edit. 2011;50:3442–3445. doi: 10.1002/anie.201006025. [DOI] [PubMed] [Google Scholar]
- 10.Xia F, Zuo XL, Yang RQ, Xiao Y, Kang D, Vallee-Belisle A, Gong X, Yuen JD, Hsu BBY, Heeger AJ, Plaxco KW. Proc. Natl. Acad. Sci. U.S.A. 2010;107:10837–10841. doi: 10.1073/pnas.1005632107. [DOI] [PMC free article] [PubMed] [Google Scholar]
- 11.Sun ZZ, Zhang N, Si YM, Li S, Wen JW, Zhu XB, Wang H. Chem. Commun. 2014;50:9196–9199. doi: 10.1039/c4cc03851g. [DOI] [PubMed] [Google Scholar]
- 12.Liu DB, Wang Z, Jiang XY. Nanoscale. 2011;3:1421–1433. doi: 10.1039/c0nr00887g. [DOI] [PubMed] [Google Scholar]
- 13.Liu YJ, Zhang LQ, Wei W, Zhao HY, Zhou ZX, Zhang YJ, Liu SQ. Analyst. 2015;140:3989–3995. doi: 10.1039/c5an00407a. [DOI] [PubMed] [Google Scholar]
- 14.Chen C, Luo M, Ye T, Li N, Ji X, He Z. Analyst. 2015 doi: 10.1039/c5an00485c. [DOI] [PubMed] [Google Scholar]
- 15.Liu P, Yang XH, Sun S, Wang Q, Wang KM, Huang J, Liu JB, He LL. Anal. Chem. 2013;85:7689–7695. doi: 10.1021/ac4001157. [DOI] [PubMed] [Google Scholar]
- 16.Guo LH, Xu Y, Ferhan AR, Chen GN, Kim DH. J. Am. Chem. Soc. 2013;135:12338–12345. doi: 10.1021/ja405371g. [DOI] [PubMed] [Google Scholar]
- 17.Verma MS, Rogowski JL, Jones L, Gu FX. Biotechnol. Adv. 2015;33:666–680. doi: 10.1016/j.biotechadv.2015.03.003. [DOI] [PubMed] [Google Scholar]
- 18.Saha K, Agasti SS, Kim C, Li XN, Rotello VM. Chem. Rev. 2012;112:2739–2779. doi: 10.1021/cr2001178. [DOI] [PMC free article] [PubMed] [Google Scholar]
- 19.Fu GL, Liu W, Feng SS, Yue XL. Chem. Commun. 2012;48:11567–11569. doi: 10.1039/c2cc36456e. [DOI] [PubMed] [Google Scholar]
- 20.Fu GL, Liu W, Li YY, Jin YS, Jiang LD, Liang XL, Feng SS, Dai ZF. Bioconjugate Chem. 2014;25:1655–1663. doi: 10.1021/bc500279w. [DOI] [PubMed] [Google Scholar]
- 21.Espinoza-Castaneda M, de la Escosura-Muniz A, Chamorro A, de Torres C, Merkoci A. Biosens. Bioelectron. 2015;67:107–114. doi: 10.1016/j.bios.2014.07.039. [DOI] [PubMed] [Google Scholar]
- 22.Zhang WM, Ma D, Du JX. Talanta. 2014;120:362–367. doi: 10.1016/j.talanta.2013.12.028. [DOI] [PubMed] [Google Scholar]
- 23.Teepoo A, Chumsaeng P, Jongjinakool S, Chantu K, Nolykad W. J. Appl. Sci. 2012;12:568. [Google Scholar]
- 24.Zargar B, Hatamie A. Anal. Methods. 2014;6:5951–5956. [Google Scholar]
- 25.Zhang XQ, Gong SW, Zhang Y, Yang T, Wang CY, Gu N. J. Mater. Chem. 2010;20:5110–5116. [Google Scholar]
- 26.Shokouhimehr M, Soehnlen ES, Khitrin A, Basu S, Huang SPD. Inorg. Chem. Commun. 2010;13:58–61. [Google Scholar]
- 27.Hu M, Furukawa S, Ohtani R, Sukegawa H, Nemoto Y, Reboul J, Kitagawa S, Yamauchi Y. Angew. Chem. Int. Edit. 2012;51:984–988. doi: 10.1002/anie.201105190. [DOI] [PubMed] [Google Scholar]
- 28.Shokouhimehr M, Soehnlen ES, Hao JH, Griswold M, Flask C, Fan XD, Basilion JP, Basu S, Huang SPD. J. Mater. Chem. 2010;20:5251–5259. [Google Scholar]
- 29.Barbosa AI, Castanheira AP, Edwards AD, Reisa NM. Lab Chip. 2014;14:2918–2928. doi: 10.1039/c4lc00464g. [DOI] [PubMed] [Google Scholar]
- 30.Chen XQ, Zhou GB, Song P, Wang JJ, Gao JM, Lu JX, Fan CH, Zuo XL. Anal. Chem. 2014;86:7337–7342. doi: 10.1021/ac500054x. [DOI] [PubMed] [Google Scholar]
- 31.Liu J, Lu CY, Zhou H, Xu JJ, Wang ZH, Chen HY. Chem. Commun. 2013;49:6602–6604. doi: 10.1039/c3cc43532f. [DOI] [PubMed] [Google Scholar]
- 32.Drew A. Honors Theses. 2015:113. [Google Scholar]
- 33.Gao ZQ, Hou L, Xu MD, Tang DP. Sci. Rep. 2014;4:3966. doi: 10.1038/srep03966. [DOI] [PMC free article] [PubMed] [Google Scholar]
- 34.Zhou SY, Zheng W, Chen Z, Tu DT, Liu YS, Ma E, Li RF, Zhu HM, Huang MD, Chen XY. Angew. Chem. Int. Edit. 2014;53:12498–12502. doi: 10.1002/anie.201405937. [DOI] [PubMed] [Google Scholar]
- 35.Hu J, Wang SQ, Wang L, Li F, Pingguan-Murphy B, Lu TJ, Xu F. Biosens. Bioelectron. 2014;54:585–597. doi: 10.1016/j.bios.2013.10.075. [DOI] [PubMed] [Google Scholar]
- 36.Dou MW, Dominguez DC, Li XJ, Sanchez J, Scott G. Anal. Chem. 2014;86:7978–7986. doi: 10.1021/ac5021694. [DOI] [PMC free article] [PubMed] [Google Scholar]
Associated Data
This section collects any data citations, data availability statements, or supplementary materials included in this article.


