Abstract
Chromatin‐associated proteins are essential for the specification and maintenance of cell identity. They exert these functions through modulating and maintaining transcriptional patterns. To elucidate the functions of the Jmjd2 family of H3K9/H3K36 histone demethylases, we generated conditional Jmjd2a/Kdm4a, Jmjd2b/Kdm4b and Jmjd2c/Kdm4c/Gasc1 single, double and triple knockout mouse embryonic stem cells (ESCs). We report that while individual Jmjd2 family members are dispensable for ESC maintenance and embryogenesis, combined deficiency for specifically Jmjd2a and Jmjd2c leads to early embryonic lethality and impaired ESC self‐renewal, with spontaneous differentiation towards primitive endoderm under permissive culture conditions. We further show that Jmjd2a and Jmjd2c both localize to H3K4me3‐positive promoters, where they have widespread and redundant roles in preventing accumulation of H3K9me3 and H3K36me3. Jmjd2 catalytic activity is required for ESC maintenance, and increased H3K9me3 levels in knockout ESCs compromise the expression of several Jmjd2a/c targets, including genes that are important for ESC self‐renewal. Thus, continual removal of H3K9 promoter methylation by Jmjd2 demethylases represents a novel mechanism ensuring transcriptional competence and stability of the pluripotent cell identity.
Keywords: development, epigenetics, histone demethylation, Kdm4, transcription
Subject Categories: Chromatin, Epigenetics, Genomics & Functional Genomics; Stem Cells; Transcription
Introduction
Embryonic development and the establishment of cellular identity are highly complex processes that require tight regulation of gene expression. Modifications on DNA and histones contribute to the establishment and maintenance of transcriptional programmes, and hence, chromatin‐modifying enzymes often play pivotal roles during development (reviewed in Pedersen & Helin, 2010; Young, 2011; Laugesen & Helin, 2014).
The JMJD2 (also known as KDM4) family of histone demethylases has activity towards di‐ and tri‐methylated lysine 9 and lysine 36 on histone H3 (Cloos et al, 2006; Fodor et al, 2006; Klose et al, 2006; Whetstine et al, 2006). While H3K9me3 is a hallmark of heterochromatic areas and is implicated in gene silencing when covering cis‐regulatory elements, H3K36me3 is found within the transcribed regions of active genes (Barski et al, 2007; Mikkelsen et al, 2007; Nestorov et al, 2013). In mammals, Jmjd2a/Kdm4a, Jmjd2b/Kdm4b and Jmjd2c/Kdm4c/Gasc1 are widely expressed, while expression of the fourth family member, Jmjd2d/Kdm4d, is largely confined to testis (Iwamori et al, 2011). The JMJD2 enzymes are considered interesting targets for the development of anti‐cancer therapies, because they are overexpressed in certain human cancers and can contribute to tumour cell proliferation (reviewed in Kooistra & Helin, 2012; Berry & Janknecht, 2013). However, we are still missing a clear understanding of the biological functions of the JMJD2 enzymes as well as their role in transcriptional regulation. Especially, conflicting data have been published regarding the role of Jmjd2 proteins in early development. While depletion of either Jmjd2b or Jmjd2c has been reported to impair ESC self‐renewal through regulation of Nanog or Polycomb targets (Loh et al, 2007; Das et al, 2014), we recently demonstrated that Jmjd2c knockout ESCs display no major phenotype (Pedersen et al, 2014). Additionally, we showed that Jmjd2c is dispensable for embryonic development and post‐natal life (Pedersen et al, 2014) as previously reported for Jmjd2b (Kawazu et al, 2011). In the current study, we have systematically investigated the functional role of Jmjd2 proteins in ESC self‐renewal and early development by conditional deletion of the genes. We show that the Jmjd2 demethylases have essential and redundant functions during early embryogenesis, and our results further uncover a widespread and dynamic regulation of H3K9me3 at transcription start sites. This level of regulation is vital for transcriptional competence, ESC proliferation and stabilization of stem cell identity.
Results
Lack of either Jmjd2a or Jmjd2b is compatible with ESC self‐renewal and embryonic development
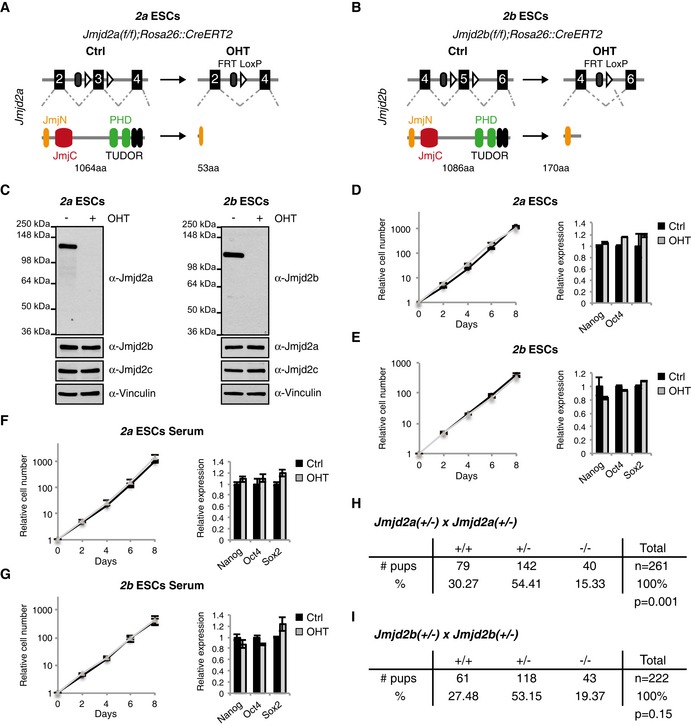
To characterize the functions of the Jmjd2 enzymes in development, we extended our studies of Jmjd2c/Kdm4c knockout (KO) ESCs (Pedersen et al, 2014) with the derivation and characterization of conditional Jmjd2a/Kdm4a and Jmjd2b/Kdm4b KO ESCs. We generated ESCs carrying Jmjd2a or Jmjd2b alleles with loxP sites surrounding critical exons and expressing a 4‐hydroxytamoxifen (OHT) inducible Cre recombinase (CreERT2) from the Rosa26 locus. For these ESCs, deletion of the loxP flanked exons results in frameshift mutations causing translational termination before the catalytic Jumonji C (JmjC) domains (Fig 1A and B). From hereon, these conditional Jmjd2a(f/f);Rosa26::CreERT2 and Jmjd2b(f/f);Rosa26::CreERT2 ESCs are referred to as 2a and 2b ESCs, respectively, as specified in Appendix Table S1.
Figure 1. Jmjd2a and Jmjd2b are individually dispensable for ESC self‐renewal and embryogenesis.
-
A, BSchematic representation of the KO strategies used for the conditional deletion of Jmjd2a (A) and Jmjd2b (B). FRT: flippase recognition site, LoxP: Cre recombinase recognition site.
-
C–E2a and 2b ESCs maintained in 2i medium were cultured in the absence (Ctrl) or presence of OHT and subsequently used for WB (C), growth curves and RT‐qPCR (D, E).
-
F, G2a and 2b ESCs were adapted to grow in serum‐containing ESC medium, exposed to OHT as indicated and subsequently used for growth curves and RT‐qPCR analyses.
-
H, IJmjd2a(+/−); Jmjd2a(+/−) (H) or Jmjd2b(+/−); Jmjd2b(+/−) (I) mice were intercrossed and the number of pups alive at time of weaning are reported. P‐values were calculated using a chi‐square test.
RT‐qPCR analyses confirmed the deletion of exon 3 in Jmjd2a and exon 5 in Jmjd2b upon OHT treatment of 2a and 2b ESCs, respectively. Reduced levels of residual transcripts were observed, suggesting that the mutant transcripts are unstable (Appendix Fig S1A). Upon OHT treatment, Jmjd2a and Jmjd2b became undetectable by Western blot, while expression levels for other Jmjd2 family members were unaltered (Fig 1C and Appendix Fig S1B).
Previously, depletion of Jmjd2b has been reported to impair self‐renewal of ESCs grown in serum‐containing medium, leading to a decline in Nanog levels and enhanced expression of differentiation markers for all embryonic lineages (Das et al, 2014). In contrast, we did not observe impaired proliferation rates or substantially altered expression of pluripotency or differentiation markers upon genetic deletion of Jmjd2a or Jmjd2b in either 2i medium (Fig 1D and E), known to promote homogenous naïve pluripotent cell cultures, or in serum‐containing ESC medium (Fig 1F and G, and Appendix Fig S1C).
To investigate the impact of loss of Jmjd2a or Jmjd2b expression on mouse development, we intercrossed heterozygous mice to obtain KO animals. Both Jmjd2a −/− (Fig 1H) and Jmjd2b −/− mice (Fig 1I) were born and classified as viable (Ayadi et al, 2012; a detailed characterization of these mice will be described elsewhere). The observation that Jmjd2b is dispensable for embryonic development is in agreement with a published study (Kawazu et al, 2011), and we have previously reported that Jmjd2c is not required for ESC maintenance or mouse embryogenesis (Pedersen et al, 2014). Thus, the loss of either Jmjd2a, Jmjd2b or Jmjd2c is compatible with ESC self‐renewal and embryonic development.
Deletion of both Jmjd2a and Jmjd2c impairs ESC self‐renewal and leads to early embryonic lethality
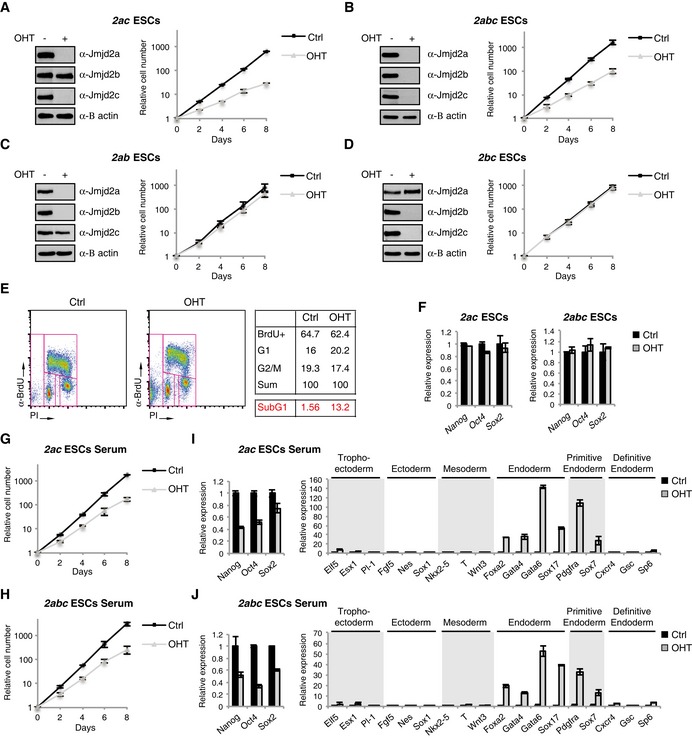
To investigate whether functional redundancy exists within the Jmjd2 family, we generated conditional Jmjd2 double and triple KO ESCs (Appendix Table S1). Strikingly, we found that the combined loss of Jmjd2a and Jmjd2c has a drastic effect on ESC proliferation in 2i medium (Fig 2A). A comparable reduction in growth rate was observed for 2abc triple KO (TKO) ESCs devoid of all three family members (Fig 2B). In contrast, we did not detect impaired growth for Jmjd2a/b or Jmjd2b/c double KO (DKO) ESCs (Fig 2C and D). These data imply that Jmjd2a and Jmjd2c have redundant and vital functions in ESCs that are not shared by Jmjd2b.
Figure 2. The combined functions of Jmjd2a and Jmjd2c are essential for ESC self‐renewal.
-
A–DWB and growth curves of 2ac (A), 2abc (B), 2ab (C) and 2bc (D) ESCs cultured in 2i medium and exposed to OHT as indicated.
-
EFlow cytometric profiles of 2ac ESCs pulsed with BrdU in 2i medium. The upper table shows the percentages of living cells (the subG1 fraction is omitted from the analysis), which can be classified as being in S (BrdU+), G1 (2N DNA content, BrdU−) or G2/M phase (4N DNA content, BrdU−). The percentage of dead cells (subG1, events with a < 2N DNA content) are shown in red.
-
FRT‐qPCR analyses for ESCs cultured in 2i medium.
-
G–J2ac and 2abc ESCs were adapted to grow in serum‐containing ESC medium, exposed to OHT as indicated and subsequently used for growth curves (G, H) and RT‐qPCR analyses (I, J). The RT‐qPCR data are also presented in Appendix Fig S2C and D with a zoom‐in on the lower region of the y‐axis.
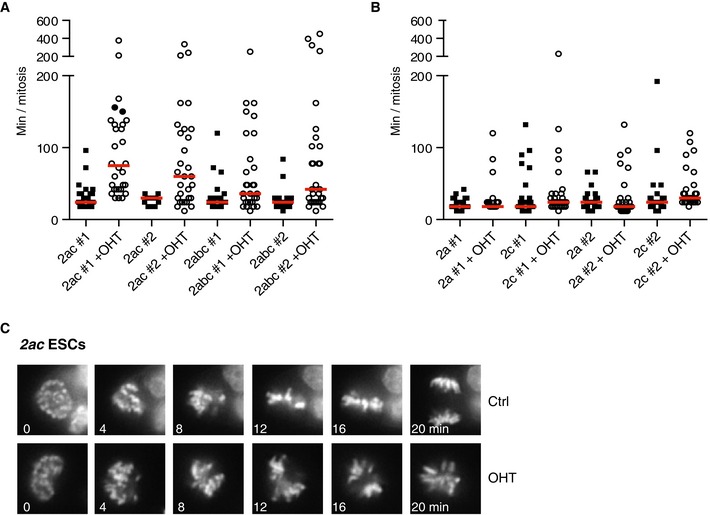
Jmjd2a/c DKO ESCs showed increased levels of cell death (Fig 2E) and appeared to undergo apoptosis as judged by the presence of cleaved caspase‐3 (Appendix Fig S2A). In other cell types, Jmjd2 proteins have been implicated in various aspects of cell cycle regulation (Black et al, 2010, 2013; Kupershmit et al, 2014; Pedersen et al, 2014). While FACS analyses did not show major alterations in cell cycle distribution for KO ESCs (Fig 2E), live cell imaging revealed that 2ac and 2abc KO ESCs are commonly delayed in their progression through mitosis and show evidence of defects in chromosome alignment. At the same time, we did not observe this phenotype in 2a or 2c single KO ESCs (Fig EV1A–C).
Figure EV1. Lack of both Jmjd2a and Jmjd2c impairs mitotic progression in ESCs.
-
A–C2ac and 2abc ESC clones (A) and 2a and 2c ESC clones (B) expressing H2B‐Venus were cultured in 2i medium in the absence or presence of OHT and subsequently subjected to time‐lapse imaging. Y‐axes show the duration of mitosis (from peak chromosome condensation to anaphase onset) for individual cells. Red lines show median values. Data are representative of results obtained in at least two different experiments. (C) Representative images demonstrating proper chromosome alignment after 20 min in mock, but not OHT‐treated 2ac ESCs.
The 2ac and 2abc KO ESCs retained normal levels of Nanog, Oct4 and Sox2 transcripts when maintained in 2i medium (Fig 2F) and were capable of differentiating into all three germ layers (Appendix Fig S2B). 2i culture conditions promote a naïve pluripotent cell state and do not support the growth of differentiated cell types (reviewed in Hackett & Surani, 2014). Thus, in addition to the observed mitotic defects, the impaired growth rate could also reflect cells exiting the pluripotent state. To investigate this idea, we assessed the effect of deleting Jmjd2a and Jmjd2c in serum‐containing ESC medium, known to be permissive for functional and transcriptional heterogeneity (Hackett & Surani, 2014). Interestingly, for ESCs growing in the presence of serum, loss of Jmjd2a and Jmjd2c also led to impaired proliferation (Fig 2G and H), which was accompanied by reduced expression of pluripotency markers (Fig 2I and J). While transcript levels for markers of trophectoderm, early ectoderm and mesoderm were not substantially altered, significant increases in the levels of the general endodermal markers Foxa2, Gata4, Gata6 and Sox17 were observed for the 2ac and 2abc KO cells cultured in serum‐supplemented medium (Fig 2I and J, and Appendix Fig S2C and D).
During the second cell fate decision in the embryo, cells from the inner cell mass segregate into either epiblast or extra‐embryonic primitive endoderm lineages. While the pluripotent epiblast gives rise to the future foetus, the primitive endoderm forms the visceral and parietal endoderm of the yolk sac (reviewed in Lanner, 2014). Interestingly, further analyses showed that specifically markers for primitive endoderm (Pdgfra and Sox7), but not embryonic definitive endoderm (Cxcr4, Gsc and Sp6), were induced upon OHT treatment of 2ac and 2abc ESCs in serum‐containing medium (Fig 2I and J). Single knockout ESCs did not show such gene expression pattern under these culture conditions (Appendix Fig S1C). In summary, ESCs devoid of Jmjd2a and Jmjd2c are characterized by strong proliferation defects and destabilization of the naïve pluripotent cell state with spontaneous differentiation towards primitive endoderm in permissive culture conditions.
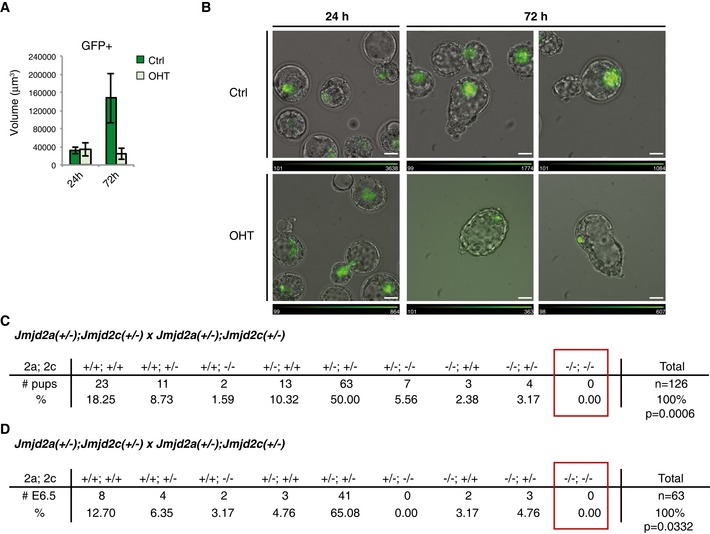
To explore the developmental potential of Jmjd2a/c deficient ESCs, we injected control and OHT‐treated GFP‐labelled 2ac ESCs (Appendix Fig S3A) into E2.5 morulas and monitored their embryonic contribution during in vitro culture. Twenty‐four hours after injection (early blastocyst stage), wt and 2ac DKO cells contributed to the embryonic inner cell mass to the same extent (Fig 3A and B). Interestingly, after two additional days of culture (transition to the late blastocyst stage), DKO cells failed to expand (Fig 3A and B) despite majorly maintaining Nanog expression (Appendix Fig S3B). This indicates that while ESC identity and homing to the proper embryonic compartment are preserved, 2ac DKO ESCs exhibit in vivo self‐renewal defects. This is consistent with the results observed in 2i culture, a condition that most closely resembles the embryonic epiblast in vitro (Boroviak et al, 2014). Interestingly, in a few rare cases, we observed Nanog‐negative DKO cells in late chimeric blastocysts (Appendix Fig S3B), which could indicate their differentiation into primitive endoderm in an embryonic context.
Figure 3. The combined functions of Jmjd2a and Jmjd2c are essential for early embryonic development.
-
A, B2ac ESCs expressing GFP were cultured in the absence or presence of OHT and subsequently used for morula injections. (A) Average volume of the GFP‐positive area in chimeric embryos at 24 and 72 h after morula injection. Number of embryos used for quantification: Ctrl 24 h n = 18; +OHT 24 h n = 15; Ctrl 72 h n = 5; +OHT 72 h n = 5. Data are presented as mean ± SD. (B) Representative images of chimeric embryos. The white bars indicate a length of 32 μm. Relative intensities of the GFP signal are indicated for each image.
-
C, DJmjd2a(+/−);Jmjd2c(+/−) mice were intercrossed. The number of (C) pups alive at weaning or (D) embryos recovered at E6.5 is presented. P‐values were calculated using exact binomial test with the most conservative estimate of expected (−/−;−/−) embryos (6.25%, assuming no linkage between the Jmjd2a and Jmjd2c loci even though they are located on the same chromosome).
To investigate the requirement for Jmjd2a and Jmjd2c in embryogenesis, we determined the viability of DKO mice. The loci encoding Jmjd2a and Jmjd2c are both located on chromosome 4 ~40 MB apart and are thus expected to co‐segregate with a frequency related to the rate of meiotic recombination. No live homozygous null pups were obtained from Jmjd2a +/− ; Jmjd2c +/− intercrosses (Fig 3C), and no DKO embryos were recovered early in development at embryonic day 6.5 (E6.5; Fig 3D). Furthermore, at E6.5, the Jmjd2a +/−; Jmjd2c +/− females contained a large number of empty decidua (23%, compared to 4% in controls), indicating that DKO embryos possibly implant in the uterus, but are resorbed shortly thereafter, which could be due to the observed phenotypic defects in pluripotent cells.
Taken together, we conclude that Jmjd2a and Jmjd2c have vital and redundant functions that are essential for ESC self‐renewal and early embryogenesis.
Jmjd2a and Jmjd2c both localize to H3K4me3‐positive regions
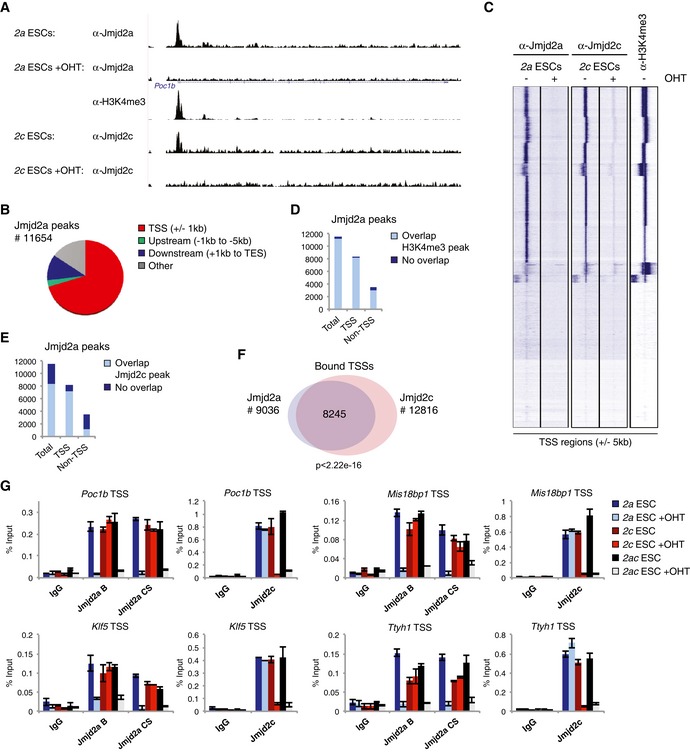
To gain insight into how Jmjd2a and Jmjd2c regulate ESC self‐renewal, we identified Jmjd2a binding patterns genomewide. All mechanistic studies were performed with ESCs grown in 2i medium to ensure homogeneity of the analysed cell populations. ChIP sequencing was performed using mock‐ and OHT‐treated conditional 2a ESCs. The OHT‐treated sample devoid of Jmjd2a was used as the negative control in subsequent bioinformatics analyses identifying 11,654 Jmjd2a binding sites, of which 70% were located within ± 1 kb of an annotated transcription start site (TSS) (Fig 4A–C, Table EV1). We have previously reported that Jmjd2c is targeted to H3K4me3‐positive regions by its double Tudor domain, which specifically recognizes this modified residue (Pedersen et al, 2014). H3K4me3 marks CpG islands and TSSs of actively transcribed genes (Mikkelsen et al, 2007; Illingworth et al, 2010). The double Tudor domain of Jmjd2a has been shown to bind methylated H3K4 and methylated H4K20 in vitro (Huang et al, 2006; Kim et al, 2006; Lee et al, 2008). As observed for Jmjd2c, we found that Jmjd2a localizes to H3K4me3‐positive TSSs (Fig 4A and C). Indeed, 99% of TSS‐associated and 88% of non‐TSS‐associated Jmjd2a peaks directly overlap an H3K4me3 peak (Fig 4D). In agreement with the comparable binding patterns (Fig 4, Appendix Fig S4A–C and Table EV1), a strong co‐localization between Jmjd2a and Jmjd2c was detected: 88% of TSS‐associated Jmjd2a peaks overlap a Jmjd2c peak (Fig 4E), and 8,245 TSSs were bound by both Jmjd2a and Jmjd2c (Fig 4F).
Figure 4. Jmjd2a and Jmjd2c both localize to H3K4me3‐marked TSSs.
-
AExamples of ChIP‐seq data obtained for Jmjd2a, Jmjd2c (Pedersen et al, 2014) and H3K4me3.
-
BDiagram illustrating the distribution of Jmjd2a peaks with regard to TSSs and open reading frames. TES: transcription end site.
-
CUnsupervised k‐means clustering of ChIP‐seq tags over all TSSs (± 5 kb).
-
D, EBar graphs showing the number of Jmjd2a peaks displaying at least 1 bp overlap with (D) a H3K4me3 or (E) a Jmjd2c peak. Jmjd2a peaks were classified as TSS associated (“TSS”) if overlapping a region of ± 1 kb of a TSS.
-
FVenn diagram illustrating the number of TSSs containing binding sites for Jmjd2a and/or Jmjd2c within ± 1 kb. The P‐value was calculated using hypergeometric test.
-
GChIP‐qPCR validations. Graphs show mean ± SD for three technical replicates and are representative of results obtained in at least two independent experiments.
Jmjd2a association with selected targets was validated in independent ChIP experiments with different antibodies recognizing Jmjd2a (Fig 4G). Experiments using single KO ESCs showed that loss of Jmjd2c expression did not alter the binding pattern of Jmjd2a, and that Jmjd2a −/− ESCs displayed normal levels of Jmjd2c binding at tested binding sites (Fig 4G). Thus, Jmjd2a and Jmjd2c localize to chromatin independently of each other in agreement with the hypothesis that Jmjd2a, like Jmjd2c, is recruited to chromatin through the double Tudor domains recognizing H3K4me3. Supporting this notion, sequential ChIP (re‐ChIP) experiments showed that chromatin precipitated with either Jmjd2a or Jmjd2c antibodies was enriched for the H3K4me3 mark. In contrast, these experiments did not provide evidence that Jmjd2a and Jmjd2c bind simultaneously to the same DNA fragments (Appendix Fig S4D and E). This suggests that Jmjd2a and Jmjd2c dynamically replace each other at H3K4me3‐marked regions instead of co‐localizing in vivo.
Jmjd2a has been reported to bind to repetitive sequences (Black et al, 2010), which are complicated to annotate in ChIP‐seq studies. However, as shown in Appendix Fig S5A and B, we failed to detect significant binding of Jmjd2a or Jmjd2c to any tested repetitive elements in ESCs by ChIP‐qPCR.
In summary, we have shown that both Jmjd2a and Jmjd2c occupy H3K4me3‐marked TSSs in ESCs. Their highly similar binding pattern is consistent with their functional redundancy.
Jmjd2a and Jmjd2c redundantly prevent accumulation of H3K9me3 and H3K36me3
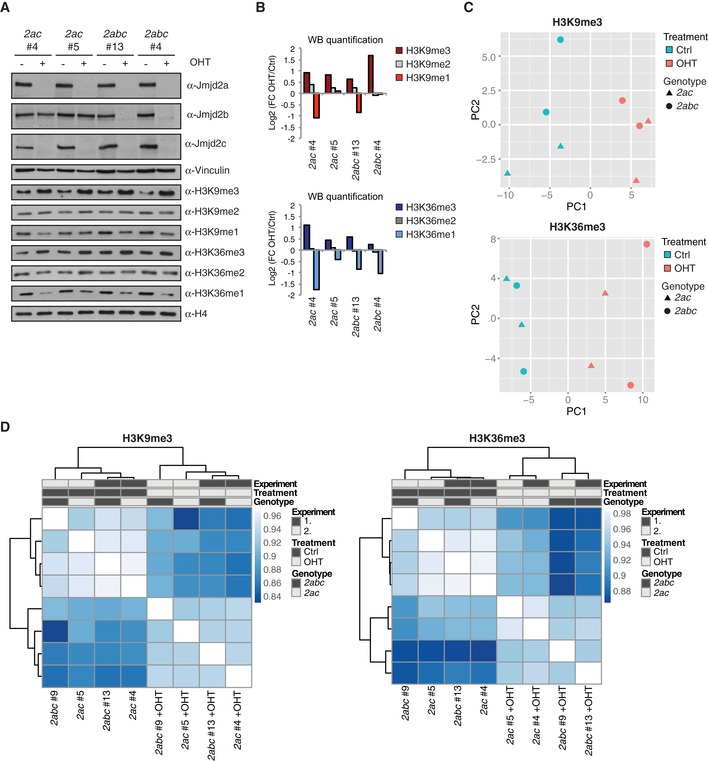
The Jmjd2 enzymes catalyse the demethylation of lysine 9 and lysine 36 on histone H3, and increased levels of H3K9me3 and H3K36me3 could be detected for both 2ac and 2abc KO ESCs by Western blotting (Fig EV2A and B). To characterize the impact of Jmjd2 proteins on histone methylation levels in more detail, ChIP sequencing was conducted with antibodies specifically recognizing H3K9me3 and H3K36me3. Notably, we observed a clear change in overall histone methylation patterns at Jmjd2a/c occupied sites upon OHT treatment of 2ac ESCs. Density plots revealed that bound TSSs exhibit a decrease in average H3K9me3 levels specifically at the Jmjd2 occupied region in wt cells. Importantly, this dip was resolved in DKO ESCs, which show an overall accumulation of H3K9me3 at the same regions (Fig 5A). Furthermore, H3K36 methylation levels were also increased at Jmjd2a/c bound sites in DKO ESCs as OHT treatment induced a shift in the average H3K36me3 distribution towards the TSS (Fig 5A). In contrast, TSSs not occupied by Jmjd2a or Jmjd2c did not show comparable gain in H3K9 or H3K36 methylation, confirming that only specific genomic elements are affected upon loss of Jmjd2 function (Fig 5A lower panel).
Figure EV2. 2ac and 2abc KO ESCs show reproducible and comparable changes in H3K9me3 and H3K36me3 patterns.
-
AWB analyses of 2ac and 2abc ESC lines. Results are representative of at least three independent experiments.
-
BQuantification of the histone modification WB presented in (A). Each membrane was reprobed with an antibody detecting H4 for normalization. Data are presented as log2 fold change (OHT versus control treated).
-
C, DResults of (C) principal component analyses and (D) Pearson's correlation coefficient analyses of H3K9me3 and H3K36me3 read counts across all TSS regions (± 1 kb). ChIP‐seq data were generated in two different experiments involving a total of four independently derived ESC lines cultured in the absence or presence of OHT.
Figure 5. Jmjd2a and Jmjd2c redundantly regulate histone methylation levels.
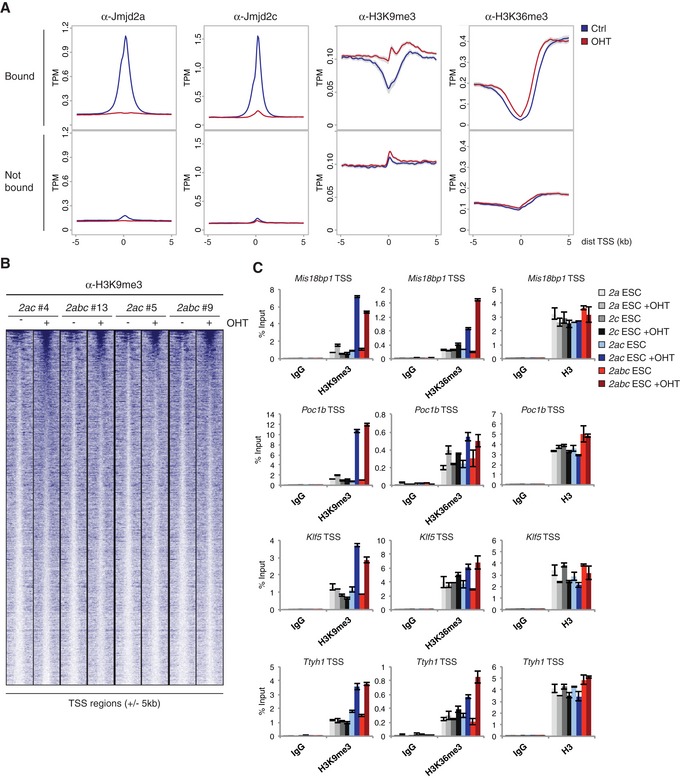
- Density plots showing average ChIP‐seq signals with 95% confidence intervals of the mean indicated in grey. Y‐axes show mean tags per million (TPM). Data were obtained using the 2ac ESC line #4. TSSs were classified as “Bound” if containing binding sites for both Jmjd2a and Jmjd2c within ± 1 kb (see Fig 4F), or “Not bound” if neither protein binds within the same region.
- Heat map showing H3K9me3 ChIP‐seq data for Jmjd2a/c bound TSSs (± 5 kb) sorted according to read number in 2abc #13+OHT.
- ChIP‐qPCR validations for selected Jmjd2a/c targets (see Fig 4G). Graphs show mean ± SD for technical triplicates and are representative of results obtained in at least two independent experiments.
To ensure reproducibility, ChIP‐seq data were obtained for 2 independent experiments involving different 2ac and 2abc ESC lines. Correlation and principal component analyses (PCA) of H3K9me3 and H3K36me3 distributions across TSS regions demonstrated that the KO samples were more similar to each other than to the mock‐treated controls (Fig EV2C and D). Density plots showed a shift in H3K9me3 and H3K36me3 profiles specifically at Jmjd2a/c occupied TSSs for all OHT‐treated samples (Fig EV3A). Further analyses revealed that a substantial fraction of TSS regions consistently displayed altered methylation patterns upon loss of Jmjd2a/c function with the gain in H3K9 and/or H3K36 trimethylation differing between the bound sites (see e.g. Figs 5B and C, and EV3B and C). Only subtle alterations in histone H3 levels were detected by ChIP‐seq and in ChIP validations demonstrating that the changes in methylation patterns did not simply reflect alterations in nucleosome density (Figs EV3A and C, EV4 and 5C). Interestingly, 2ac and 2abc ESCs showed comparable changes in methylation levels upon OHT treatment at analysed regions (Figs 5B and EV3A and B), as confirmed by independent ChIP‐qPCR validations (Figs 5C, EV3C and EV4B). In agreement with this, the H3K9me3 2ac+OHT and 2abc+OHT samples clustered together instead of forming 2 distinct groups in the PCA and correlation analyses (Fig EV2C and D). Thus, Jmjd2b appears to play a minor role in the regulation of H3K9 trimethylation at Jmjd2a/c bound sites in ESCs. Furthermore, Jmjd2 single KO ESCs did not display comparable increases in H3K9me3 or H3K36me3 levels at regions analysed by ChIP‐qPCR (Fig 5C), implying that Jmjd2a and Jmjd2c function redundantly in the regulation of histone methylation. The synergistic effect of loss of both family members is in agreement with their redundant role in maintaining ESC self‐renewal and normal embryonic development.
Figure EV3. 2ac and 2abc KO ESCs show consistent and comparable changes in H3K9me3 and H3K36me3 distributions.
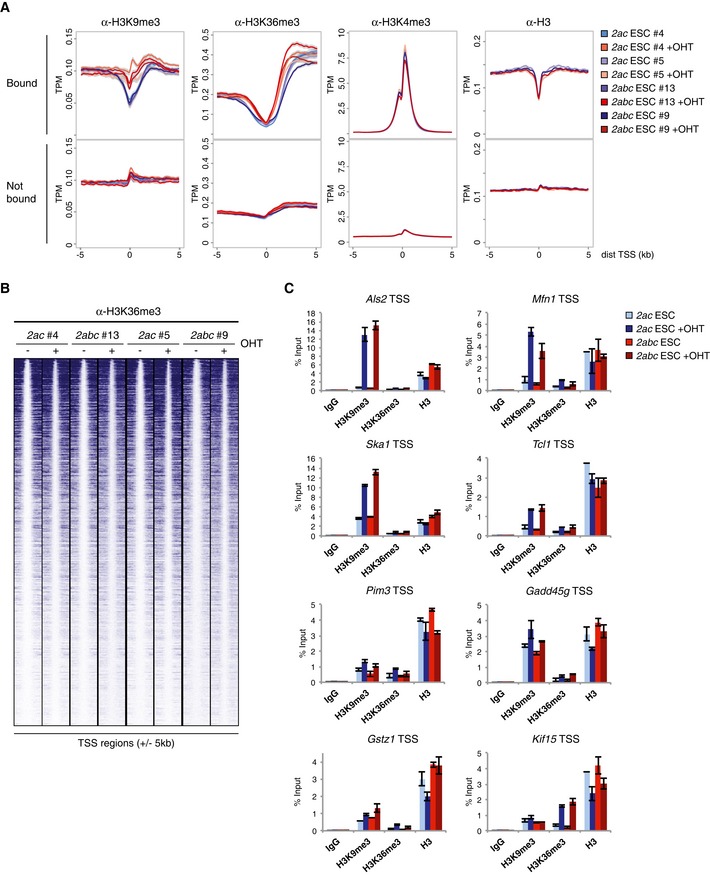
- Density plots showing average ChIP‐seq signals with 95% confidence intervals of the mean indicated in grey. Y‐axes show mean tags per million (TPM). Data were obtained using the indicated ESC lines. TSSs were classified as “Bound” if containing binding sites for both Jmjd2a and Jmjd2c within ± 1 kb. Note that H3K4me3 and H3 ChIP‐seq data were only obtained for the ESC lines 2ac #5 and 2abc #9.
- Heat map showing H3K36me3 ChIP‐seq data for Jmjd2a/c bound TSSs (± 5 kb) sorted according to read number in 2abc #13+OHT.
- ChIP‐qPCR validations exemplifying differential effects on histone methylation. Als2, Mfn1, Ska1, Tcl1 and Pim3 are examples of down‐regulated target genes, Gadd45g is induced, while the expression levels of Gstz1 and Kif15 are unaltered upon loss of Jmjd2a/c expression. Graphs show mean ± SD for three technical replicates and are representative of results obtained in at least two independent experiments.
Figure EV4. TSS regions with substantial gain of H3K9me3 show reduced levels of H3K4me3.
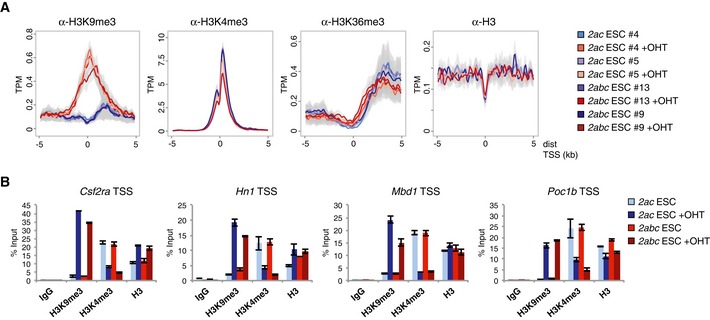
- Density plots are presented for the 100 Jmjd2a/c bound TSSs showing the greatest increase in average H3K9me3 levels. Fold change in H3K9me3 read counts was calculated for each ESC line (OHT versus Ctrl) for regions of ± 1 kb of TSSs. Plots show average ChIP‐seq signals with 95% confidence intervals of the mean.
- Independent ChIP‐qPCR validations. Note that the target genes show impaired expression upon loss of Jmjd2a/c expression. Graphs show mean ± SD for three technical replicates and are representative of results obtained in at least two independent experiments.
Recruitment of the Jmjd2 H3K9/H3K36 demethylases to H3K4me3‐marked nucleosomes provides an example of the complex interplay between histone modifications. To assess whether loss of Jmjd2a/c function also had an impact on H3K4me3 levels, we included this mark in the ChIP‐seq analyses. While only minor alterations were observed for the overall H3K4me3 profiles upon loss of Jmjd2a/c expression (Fig EV3A), a modest reduction in average H3K4me3 levels could be observed at the TSS regions with the greatest increase in H3K9me3 (Fig EV4A and B). These data suggest that Jmjd2a/c‐dependent accumulation of H3K9me3 can directly or indirectly affect H3K4me3 levels.
Taken together, we conclude that Jmjd2a and Jmjd2c have general and redundant roles in shaping the chromatin signature of H3K4me3‐marked TSSs by preventing accumulation of H3K9me3 and H3K36me3.
Jmjd2a/c‐dependent control of H3K9me3 at TSSs is important for transcriptional competence
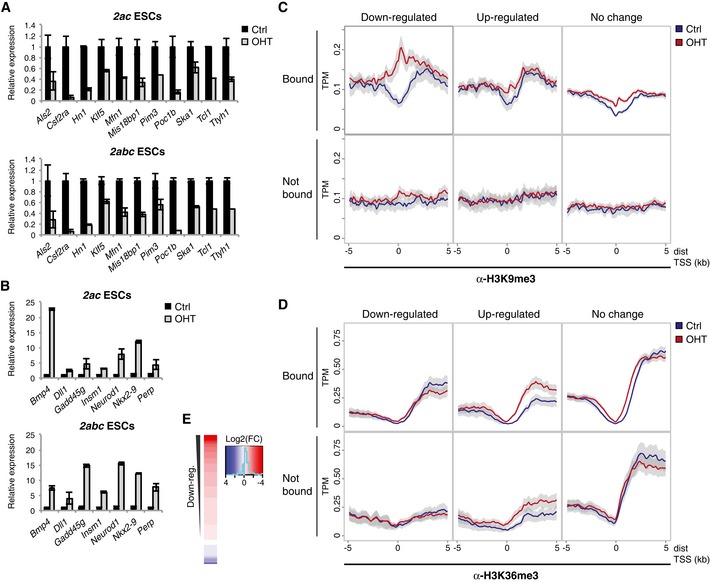
To elucidate whether Jmjd2 proteins contribute to transcriptional regulation, we performed gene expression analyses on 2ac and 2abc ESC lines. Loss of Jmjd2 proteins led to the deregulated expression of several hundred genes of which ~40% were found to contain binding sites for both Jmjd2a and Jmjd2c within ± 1 kb of their TSS (Appendix Fig S6A and B and Table EV2). Most down‐ or up‐regulated genes showed similar trends of deregulation in the 2ac and 2abc KO cells (Appendix Fig S6A, C and D), and validation experiments confirmed that 2ac and 2abc KO ESCs exhibit comparable transcriptional changes (Fig 6A and B). In contrast, the transcriptional effects were generally not recapitulated in the Jmjd2 single KO ESCs (Appendix Fig S6E), in agreement with the results from the phenotypic characterization.
Figure 6. H3K9me3 accumulation in Jmjd2a/c KO ESCs impairs gene expression.
-
A, BIndependent RT‐qPCR validations of genes identified as being (A) down‐regulated or (B) up‐regulated by expression arrays. Graphs show mean ± SD for technical triplicates and are representative of results obtained with at least two different ESC lines of each genotype in independent experiments.
-
C, DDensity plots showing average ChIP‐seq signals for (C) H3K9me3 or (D) H3K36me3 with 95% confidence intervals of the mean indicated in grey. Plots are shown for genes, which are down‐ or up‐regulated according to the microarray analyses (FDR < 0.05, absolute fold change log2(|FC|) > 0.5) for both 2ac and 2abc KO ESCs (overlaps presented in Appendix Fig S6A), or do not show strong expression changes (log2(|FC|) < 0.2). Genes are further classified as “Bound” if containing binding sites for both Jmjd2a and Jmjd2c within ± 1 kb of a TSS. ChIP‐seq data are presented for the 2ac #4 ESC line.
-
EHeat map presenting array data in the form of log2(fold change) values comparing OHT with control treated ESCs. Genes are shown for which TSS regions (± 1 kb) show the most substantial increase in H3K9me3 levels in OHT‐treated cells according to the ChIP‐seq analyses (defined in Fig EV4).
The expression analysis was conducted using ESCs maintained in 2i medium to prevent confounding effects of differentiated cells in the culture and therefore did not recapitulate the altered expression of, for example, endodermal markers observed for DKO/TKO ESCs in serum culture. Nevertheless, Gene Ontology (GO) analyses showed that genes with deregulated expression upon loss of Jmjd2a/c were enriched for functions related to various developmental processes (Appendix Fig S6F). In line with the phenotypic characterization, the GO analyses thus support the notion that lack of Jmjd2a and Jmjd2c can destabilize pluripotent stem cell identity even under conditions promoting a naïve ground state.
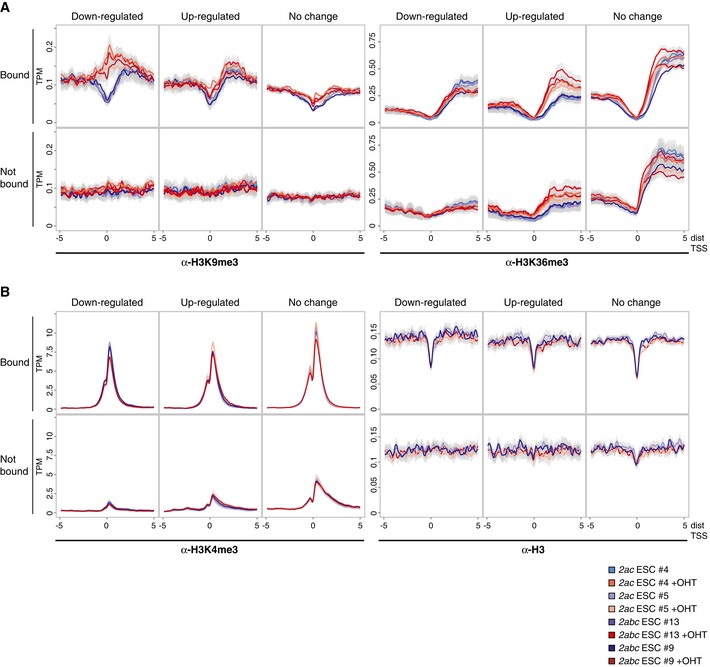
To investigate whether there was a correlation between changes in gene expression and Jmjd2‐dependent demethylation, we analysed methylation levels at the TSS regions of deregulated genes (Figs 6C and D, and EV5). Strikingly, we observed a very strong and reproducible increase in H3K9me3 specifically at the TSSs of Jmjd2a/c bound genes with impaired expression upon OHT treatment (Figs 6C and EV5A). Genes with unaltered or enhanced expression levels displayed only modest alterations in H3K9 methylation, and a comparable gain in H3K9me3 was also not observed at down‐regulated genes without Jmjd2a/c binding, demonstrating that it did not represent a secondary effect of transcriptional silencing (Figs 6C and EV5A).
Figure EV5. Consistent accumulation of H3K9me3 at Jmjd2a/c targets with impaired expression.
-
A, BDensity plots showing average ChIP‐seq signals with 95% confidence intervals of the mean. Plots are shown for the gene subsets defined for Fig 6C and D, and data were obtained using antibodies specific for (A) H3K9me3 or H3K36me3 or (B) H3K4me3 or H3.
Focusing on H3K36me3, we found only slightly elevated average methylation levels near Jmjd2a/c binding sites for genes with unaltered or increased expression (Figs 6D and EV5). As expected, the increase in H3K36me3 extended downstream from the TSS for up‐regulated genes. For this group of genes, comparable methylation patterns were seen independent of Jmjd2a/c binding, implying that the observed effects related to transcription levels rather than reflecting Jmjd2a/c‐mediated demethylation. Thus, in contrast to the data obtained for H3K9me3, these analyses did not show a strong correlation between Jmjd2a/c‐dependent control of H3K36me3 and transcriptional changes.
The profiles presented in Figs 6C and EV5A demonstrate that Jmjd2a/c targets with impaired transcription in KO ESCs have an overall increase in promoter H3K9me3 levels. As an alternative approach to investigate how H3K9me3 demethylation correlates with transcriptional changes, we again focused on the TSS regions with the greatest increase in average H3K9me3 levels across all ChIP‐seq experiments (see Fig EV4). Importantly, the microarray data revealed that most corresponding genes showed a decline in overall expression levels upon depletion of Jmjd2a and Jmjd2c (Fig 6E). These data further support the conclusion that Jmjd2‐mediated control of H3K9 methylation is important for transcriptional activity.
Among the down‐regulated Jmjd2a/c target genes with a substantial increase in H3K9me3 levels were several that could contribute to the observed phenotypes (Figs 6A, 5C, EV3C and EV4B). Particularly, lack of either Ttyh1 or Klf5 impairs embryo development around the blastocyst stage (Ema et al, 2008; Kumada et al, 2010). Whereas loss of Ttyh1 leads to mitotic failure (Kumada et al, 2010), lack of Klf5 impairs epiblast expansion and promotes primitive endoderm differentiation (Lin et al, 2010). Results suggest that Csf2ra is important for blastocyst viability (Robertson et al, 2001), Tcl1 and Pim3 have reported roles in ESC self‐renewal (Aksoy et al, 2007; Bourillot et al, 2009; Miyazaki et al, 2013), and Poc1b, Mis18bp1 and Ska1 have all been implicated in the regulation of chromosome segregation and/or mitosis (Hanisch et al, 2006; Fujita et al, 2007; Venoux et al, 2013).
In summary, these results show that H3K9me3 accumulation caused by loss of Jmjd2a and Jmjd2c can compromise transcription of genes required for ESC pluripotency and proliferation.
The catalytic activity of Jmjd2a/c is essential for ESC maintenance
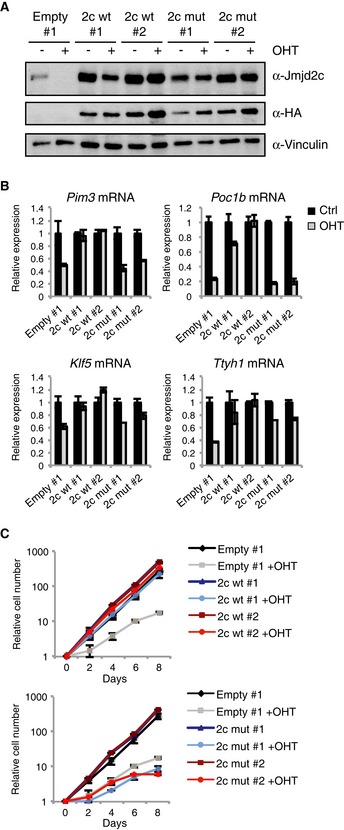
To test the importance of Jmjd2a/c catalytic activity for ESC self‐renewal, we exploited the fact that single KO Jmjd2 ESCs do not display a severe phenotype. We established 2ac ESC clones with ectopic expression of wild‐type HA‐tagged Jmjd2c (2c wt) or a catalytic dead version (2c mut) (Fig 7A and Appendix Fig S7A and B). Ectopic expression of wt Jmjd2c, but not the catalytic mutant, reverted the global increase in H3K9me3 observed upon depletion of endogenous Jmjd2a/c as well as the expression of selected important target genes (Fig 7B and Appendix Fig S7B). Additionally, the growth defect caused by loss of Jmjd2a and Jmjd2c was rescued by ectopic expression of wt, but not catalytically inactive Jmjd2c (Fig 7C).
Figure 7. The catalytic activity is essential for Jmjd2a/c functions.
-
A–C2ac clones established after transfection with an empty vector (empty) or plasmids expressing wild‐type Jmjd2c (2c wt) or a catalytic mutant (2c mut) were exposed to OHT as indicated and subsequently used for (A) WB, (B) RT‐qPCR analyses or (C) serial plating for the generation of growth curves. Data are representative of results obtained in at least two independent experiments, and graphs show mean ± SD for three cultures counted in parallel (growth curves) or three technical replicates (RT‐qPCR).
Taken together, these data show that the catalytic activity of Jmjd2a/c is essential for their functions in ESCs. This supports the conclusion that Jmjd2a/c‐dependent regulation of histone methylation is vital for ESC self‐renewal and embryonic development.
Discussion
One of the main findings of this study is that lack of either Jmjd2a or Jmjd2b is compatible with mouse ESC self‐renewal and embryonic development, analogous to what we have previously demonstrated for Jmjd2c (Pedersen et al, 2014). These results are in contrast to previous reports. Loh et al (2007) concluded, based on siRNA‐depletion experiments, that Jmjd2c directly regulates Nanog expression in mouse ESCs, a finding that was not reproduced in other studies (Das et al, 2014; Pedersen et al, 2014). Wang et al (2010) observed a developmental arrest prior to the blastocyst stage upon dsRNA‐mediated knockdown of Jmjd2c in mouse oocytes. More recently, Das et al found that depletion of either Jmjd2b or Jmjd2c in mESCs caused a general differentiation towards most lineages. Jmjd2b depletion was reported to affect Nanog levels, and Jmjd2c was suggested to repress Polycomb target genes, but the phenotypes were not linked to regulation of H3K9 methylation (Das et al, 2014). The discrepancies between the reported phenotypes could relate to differences in genetic backgrounds, culture conditions and the use of knockdown constructs versus the study of KO cells. Importantly, the conclusions presented in our study are based on characterization of conditional KO ESCs, thus ruling out off‐target effects commonly associated with the use of si/shRNA. Additionally, our findings regarding ESC self‐renewal are supported by the observations that single Jmjd2 KO mice are born and viable, demonstrating that individual Jmjd2 family members are dispensable for pluripotency in vivo (this study and Iwamori et al, 2011; Kawazu et al, 2011; Pedersen et al, 2014).
In contrast to the dispensability of any single Jmjd2 gene product, we found that Jmjd2a and Jmjd2c have redundant, essential functions at early developmental stages. The combined loss of Jmjd2a and Jmjd2c impairs pluripotent cell proliferation in vitro and in vivo and destabilizes their cellular state leading to spontaneous differentiation towards primitive endoderm under permissive culture conditions. In agreement with the central function in pluripotent cells, lack of both Jmjd2a and Jmjd2c causes embryonic lethality prior to E6.5. The observed phenotypes are likely to represent the consequence of deregulated expression of multiple target genes. Indeed, we identified several genes with reported roles in ESC self‐renewal, embryogenesis and cell cycle progression among the Jmjd2a/c targets.
Based on our mechanistic studies, we propose a model in which both Jmjd2a and Jmjd2c are recruited through their double Tudor domains to H3K4me3‐positive TSSs, where they dynamically replace each other and continuously prevent accumulation of H3K9me3 as well as H3K36me3 (Fig 8). Our data imply that the function of Jmjd2b is distinct from that of these two family members, and in agreement with this, a significant fraction of Jmjd2b binding sites was recently reported to be located distant from TSSs (Das et al, 2014). For the regions with a substantial gain in H3K9 methylation, we observe a modest decline in H3K4me3 levels. While this may relate to the impaired transcription, it is also possible that H3K9 methylation more directly interferes with H3K4me3 deposition at these sites. Our results identify Jmjd2a and Jmjd2c as central regulators of the chromatin signature of H3K4me3‐marked regions and provide additional evidence for co‐regulation of H3K4 and H3K9 methylation, as also suggested by other studies (Shi et al, 2011; Binda, 2013).
Figure 8. Model.

We propose the following model: Jmjd2a and Jmjd2c are both recruited through their double Tudor domains to H3K4me3‐marked nucleosomes, where they continuously and redundantly prevent accumulation of H3K9me3 and H3K36me3. In the absence of Jmjd2a/c catalytic activity, substantial increases in H3K9me3 levels at specific loci impair gene expression, which perturb the transcriptional programme required for embryonic stem cell identity, proliferation and embryonic development.
An important implication of our data is that numerous TSSs are continuously targeted by H3K9 and H3K36 methyltransferases. H3K36me3 is deposited within transcribed regions by the methyltransferase Setd2 (reviewed in Venkatesh & Workman, 2013), and our data are consistent with a model in which Jmjd2a and Jmjd2c ensure chromatin boundaries by removing H3K36me3 aberrantly deposited near TSSs during this process. The H3K9me3 methyltransferase Setdb1 localizes to a number of promoter regions in ESCs (Bilodeau et al, 2009; Yuan et al, 2009), but in agreement with the notion that Setdb1 is not the sole enzyme responsible for TSS‐associated H3K9 methylation, Jmjd2a/c‐dependent H3K9me3 accumulation is not restricted to Setdb1‐bound regions (M.T. Pedersen, unpublished observation).
Notably, we further demonstrate that Jmjd2‐dependent control of H3K9me3 levels at promoter regions is vital for transcriptional activity. Our data highlight regulation of H3K9 methylation as an important factor in cell fate specification. This is further supported by the fact that several H3K9 methyltransferases are essential for development (reviewed in Nestorov et al, 2013) and recent studies demonstrating that specifically H3K9 methylation can act as a barrier for reprogramming of somatic cells to the pluripotent stage (Antony et al, 2013; Chen et al, 2013; Matoba et al, 2014).
In conclusion, we demonstrate that spatial regulation of H3K9me3 through demethylation by Jmjd2a/c represents a novel and essential mechanism to ensure transcriptional competence, ESC self‐renewal and normal development.
Materials and Methods
Animals
Targeted Jmjd2a and Jmjd2b C57Bl/6 ESCs (Jmjd2a tm1a(EUCOMM) and Jmjd2b tm1a(EUCOMM)) were obtained from the European Conditional Mouse Mutagenesis Program (EUCOMM). In these cells, a lacZ‐Neo‐reporter cassette flanked by FRT sites is inserted between exons (exons 2 and 3 for Jmjd2a and exons 4 and 5 for Jmjd2b) and LoxP sites surround critical exons (exon 3 of Jmjd2a and exon 5 of Jmjd2b). Targeted ESCs were injected into BALB/c blastocysts and chimeric animals obtained. Black offspring of these chimeras were crossed with Flp‐recombinase expressing mice to obtain mice with conditional Jmjd2a and Jmjd2b alleles (Jmjd2a f/f and Jmjd2b f/f). To determine viability, the conditional mice were first crossed with mice constitutively expressing Cre recombinase, and heterozygous animals (Jmjd2a +/− and Jmjd2b +/−) were subsequently intercrossed. Chi‐square tests were used to obtain P‐values for the observed genotypic distributions. Double KO animals were generated by intercrossing Jmjd2a +/− and Jmjd2c +/− (Pedersen et al, 2014) animals. Jmjd2a and Jmjd2c are both located on chromosome 4. In order to increase the likelihood that heterozygous Jmjd2a +/− ;Jmjd2c +/− mice carried the mutated alleles on the same chromosome, we used the following mating scheme to determine viability:
F0: Jmjd2a +/− ;Jmjd2c −/− × Jmjd2a +/+ ;Jmjd2c +/+.
F1: Jmjd2a +/− ;Jmjd2c +/− × Jmjd2a +/− ;Jmjd2c +/− (only F1 animals with this genotype were intercrossed).
F2: genotyped to analyse the viability of DKO animals.
Exact binomial test was used to determine statistical significance for the number of DKO animals/embryos recovered. Here, we assumed no linkage between Jmjd2a and Jmjd2c loci to obtain the most conservative estimate of the number of expected Jmjd2a −/− ; Jmjd2c −/− animals. Inducible KO animals were obtained by crossing conditional Jmjd2a/b/c mice with Rosa26::CreERT2 mice (obtained from the Jackson Laboratory). Mice were housed in groups at the University of Copenhagen in individually ventilated cages with 12 h of light (6:00 am to 6:00 pm) and had free access to water and a standard mouse chow diet. All mouse work was approved by the Danish Animal Ethical Committee (“Dyreforsøgstilsynet”).
ESC derivation and culture
For the generation of Jmjd2a/b/cf/f;Rosa26::CreERT2 ESCs, blastocysts were isolated from super‐ovulated pregnant female mice at 3.5 days post‐coitus. Single blastocysts were cultured and ICM outgrowths expanded on gelatin‐coated plates in serum‐free 2i medium (Ying et al, 2008): 50% D‐MEM/F‐12 1:1 (Invitrogen), 50% neurobasal (Invitrogen) supplemented with N‐2 Supplement (Invitrogen), B‐27 serum‐free supplement (Invitrogen), β‐mercaptoethanol (Gibco), 0.1 mM non‐essential amino acids (Gibco), 2 mM GlutaMAX (Gibco), 1 mM sodium pyruvate (Gibco), leukaemia inhibitory factor (LIF), 1 μM MEK inhibitor (CT‐99021) and 3 μM GSK inhibitor (PD‐035901). The sex and karyotype were determined as described (Pedersen et al, 2014) and male ESC lines used in all experiments. Cell lines were routinely checked for mycoplasma contamination.
ESCs were grown in the presence of 500 nM OHT (Sigma‐Aldrich) for up to 2 weeks until full recombination was obtained, and all experiments were performed after recovery from OHT treatment. All results were obtained using cells cultured in 2i medium unless otherwise specified. When indicated, cells were adapted to growth in serum‐containing ESC medium: GMEM (Sigma‐Aldrich) supplemented with 15% fetal bovine serum (FBS embryonic stem cell‐qualified, Gibco), 2 mM GlutaMAX (Gibco), 50 μM β‐mercaptoethanol, 0.1 mM non‐essential amino acids, 1 mM sodium pyruvate and LIF.
For monolayer differentiation assays, cells were plated in serum‐containing medium supplemented with all‐trans retinoic acid (ATRA): 50% D‐MEM/F‐12 1:1 (Invitrogen), 50% neurobasal (Invitrogen) supplemented with 10% serum (Hyclone), β‐mercaptoethanol, 0.1 mM non‐essential amino acids, 1 mM sodium pyruvate and 1 μM ATRA.
Flow cytometry analyses
ESCs were pulsed with BrdU for 10 min before harvesting, fixation and staining with anti‐BrdU pure (BD Biosciences #555627) and propidium iodide (PI). Analyses were performed on a FACSCalibur (BD Biosciences) using CellQuest software (BD Biosciences) and FlowJo (FlowJo LLC).
Live cell imaging of mitotic progression
ESCs were transfected to express H2B‐Venus using Lipofectamine 2000 (Life Technologies), clones established and live cell imaging performed after recovery from OHT treatment. ESCs were seeded at 3 × 10⁴ per well, 6 h before filming in an Ibidi μ‐slide (Ibidi) coated with 1% gelatin and imaged in 2i medium supplemented with 20 mM HEPES in a darkened humified chamber at 37°C. Cells were imaged on an DeltaVision Elite time‐lapse microscope (GE Healthcare) using a Plan Apochromat ×40 oil immersion objective, NA = 1.35 with 2 × 2 binning. Fluorescence and bright‐field images were collected every 4 min at 3 Z‐sections 5 μm apart for a total of 16 h. The duration of mitosis was determined as being from peak chromosome condensation to anaphase onset.
Morula injections and analyses
2ac ESCs were co‐transfected with piggyBac PB‐CAG‐GFP‐IRES‐bsd and pBase transposase‐encoding plasmids using Lipofectamine 2000. Since piggyBac transposition mediates random integration of multiple transgene copies per cell, using a pool of piggyBac‐transfected cells ensures robust GFP signal with minimal effect of single transgene copy silencing. After blasticidin selection, control and OHT‐treated cells were injected into 8‐cell morulae of C57BL/6NRj background (Janvier Labs) using a standard procedure in M2 medium (Sigma‐Aldrich) (around 10 cells per embryo injected). Embryos were maintained in KSOMaa Evolve medium (LifeGlobal group) surrounded by mineral oil and imaged 24 and 72 h after injection. Imaging was performed with a widefield‐based microscope (DeltaVision Elite, GE Healthcare). Some embryos were fixed 48 h after injection in 4% PFA, permeabilized in PBS/1% BSA/0.5% Triton X‐100 and stained with chicken anti‐GFP (Abcam ab13970) and rabbit anti‐Nanog (Abcam ab80892) antibodies. The secondary antibodies were conjugated with Alexa 488 and Alexa 647 (Invitrogen). Confocal images were acquired using a Zeiss LSM 510. Detailed information on image capture and processing can be found in Appendix Supplementary Methods.
Western blotting
Protein lysates were made using a high‐salt buffer (300 mM NaCl, 50 mM Tris–HCl (pH 7.5), 0.5% Triton X‐100, 1% SDS) supplemented with protease inhibitors. Samples were sonicated and immunoblotting performed according to standard protocols.
Western blots for modified histones were quantified using the Analyze‐Gels function in ImageJ. Following incubation with antibodies recognizing modified histones, each membrane was extensively washed (PBS + 0.1% Tween + 0.1% NaN3, followed by PBS + 0.1% Tween) and reprobed with an H4 antibody. The obtained H4 signal was used to calculate relative changes in H3K9 and H3K36 methylated histones. Antibodies are listed in Appendix Supplementary Methods.
RNA and gene expression analyses
RNA was purified using RNeasy (Qiagen) and reverse transcribed using TaqMan® Reverse Transcription (RT) Reagents (Applied Biosystems) according to manufacturer's instructions.
For microarray analyses, RNA isolated from three independently established ESC lines of 2ac and 2abc ESCs, respectively, was grown in the absence or presence of OHT for 12 days to obtain full recombination. After additional two passages, cells were harvested and total RNA extracted using RNeasy Mini kit (Qiagen). Samples were labelled and hybridized to Agilent SurePrint G3 Mouse GE 8×60K arrays (Agilent G4852A) according to manufacturer's instructions using LowInput QuickAmp Labeling Kit One Color (Agilent #5190‐2305), One‐Color RNA Spike‐In kit (Agilent #5188‐5282) and Gene Expression Hybridization kit (Agilent #5188‐5242). See Appendix Supplementary Methods for details on bioinformatics analyses.
In RT‐qPCR assays, expression values were normalized to the housekeeping gene, Rplp0. Primers are listed in Table EV3.
Chromatin immunoprecipitation (ChIP), re‐ChIP and ChIP sequencing (ChIP‐seq)
For ChIP experiments, ESCs were fixed for 10 min in 1% formaldehyde in PBS and the reaction was quenched by addition of glycine to a final concentration of 0.125 M. The cross‐linked cells were harvested in SDS lysis buffer (100 mM NaCl, 0.5% SDS, 50 mM Tris–HCl (pH 8.0), 5 mM EDTA, 0.02% NaN3 and protease inhibitors), and nuclei pelleted and resuspended in IP buffer (100 mM NaCl, 0.25% SDS, 2.5% Triton X‐100, 50 mM Tris–HCl (pH 8.3), 5 mM EDTA, 0.02% NaN3 and protease inhibitors). Samples were sonicated (Bioruptor, Diagenode) to an average length of 200–500 bp. Chromatin resuspended in IP buffer was immunoprecipitated with Protein A Sepharose beads (GE healthcare) after overnight incubation with antibodies. Beads were washed 3× with low‐salt wash buffer [150 mM NaCl, 1% Triton X‐100, 0.1% SDS, 2 mM EDTA, 20 mM Tris–HCl (pH 8.0)] and 3× with high‐salt wash buffer [500 mM NaCl, 1% Triton X‐100, 0.1% SDS, 2 mM EDTA, 20 mM Tris–HCl (pH 8.0)] before decross‐linking in 1% SDS, 0.1 M NaHCO3 for 8–16 h at 65°C. Decross‐linked DNA was purified using Qiagen PCR Purification kit.
Re‐ChIP experiments were performed essentially as described above. After a first chromatin IP, beads were subjected to two rounds of elution: incubation with 10 mM EDTA, 10 mM Tris–HCl, 2% SDS, 15 mM DTT shaking at 37°C for 30 min, followed by incubation with 1% SDS, 10 mM EDTA, 50 mM Tris–HCl pH 7.5 at 68°C for 10 min (Geisberg & Struhl, 2004; Truax & Greer, 2012). The eluted chromatin was diluted in IP buffer and divided into five equal fractions for the second ChIP.
Antibodies are listed in Appendix Supplementary Methods. The specificity of all batches of antibodies recognizing histone marks was tested in ELISA experiments with a histone peptide library (Pedersen et al, 2014). Primers are listed in Table EV3.
For ChIP‐seq, adaptor‐ligated libraries were generated from 10 to 25 ng of precipitated DNA using the NEBNext® Ultra DNA library kit for Illumina (New England Biolabs E7370L), subjected to gel selection and PCR‐amplified (15× PCR cycles) using indexed multiplex primers for Illumina sequencing (New England Biolabs E7335) and sequenced on a HiSeq2000 using 50‐bp single‐end sequencing at the National High‐Throughput Sequencing Centre (University of Copenhagen, Denmark) or at Beijing Genomics Institute (BGI, Shenzhen, China). The bioinformatics analyses of ChIP‐seq experiments are described in the Appendix Supplementary Methods.
Rescue experiments with ectopic expression of Jmjd2c
2ac ESCs were transfected using Lipofectamine 2000 with pCAG vectors encoding wild‐type mouse Jmjd2c (NM_144787.2, NP_659036.1) or a catalytic dead version containing mutations disrupting the iron‐binding domain (H190G and E192A) (Cloos et al, 2006) and clones established.
Accession numbers
Raw and processed data sets are available for download at the Gene Expression Omnibus (GEO) database under the accession number GSE64254.
Author contributions
MTP, SMK and KH designed the research. MTP, SMK, AR, KA, AL and DGH performed experiments. JN supervised the live cell imaging of mitotic progression. MTP and JVJ performed bioinformatics analyses. MTP, SMK and KH wrote the manuscript. All authors provided critical editing of the manuscript.
Conflict of interest
The authors declare that they have no conflict of interest.
Supporting information
Appendix
Expanded View Figures PDF
Table EV1
Table EV2
Table EV3
Source Data for Expanded View and Appendix
Review Process File
Source Data for Figure 1C
Source Data for Figure 2A–D
Source Data for Figure 7A
Acknowledgements
We thank the members of the Helin laboratory for discussion, technical advice and support and in particular Lotte Holck and Fengqin Jia for expert technical assistance. We would like to thank Yasuko Antoku for assistance with imaging and image analyses, Fabian Roske for help with microscopy settings for the live cell imaging, Dr. Jose Silva, Cambridge Stem Cell Institute, UK, for PB‐CAG‐GFP‐IRES‐bsd and pBase plasmids, Prof. Heicko Lickert, Helmholtz Center Munich, Germany, for providing the pCAG‐H2B‐Venus vector and Hilmar RJ van Weering for graphic design. SMK was supported by a Rubicon grant from the Netherlands Organization for Scientific Research (NWO, project 825.10.027). AR is supported by a fellowship from EMBO (1204‐2014). This work was supported by the Danish Cancer Society, the Danish National Research Foundation (DNRF 82), the Lundbeck Foundation and through centre grants from the Novo Nordisk Foundation [The Novo Nordisk Foundation Section for Stem Cell Biology in Human Disease and The Novo Nordisk Foundation Center for Protein Research (NNF14CC001)].
The EMBO Journal (2016) 35: 1550–1564
References
- Aksoy I, Sakabedoyan C, Bourillot PY, Malashicheva AB, Mancip J, Knoblauch K, Afanassieff M, Savatier P (2007) Self‐renewal of murine embryonic stem cells is supported by the serine/threonine kinases Pim‐1 and Pim‐3. Stem Cells 25: 2996–3004 [DOI] [PubMed] [Google Scholar]
- Antony J, Oback F, Chamley LW, Oback B, Laible G (2013) Transient JMJD2B‐mediated reduction of H3K9me3 levels improves reprogramming of embryonic stem cells into cloned embryos. Mol Cell Biol 33: 974–983 [DOI] [PMC free article] [PubMed] [Google Scholar]
- Ayadi A, Birling MC, Bottomley J, Bussell J, Fuchs H, Fray M, Gailus‐Durner V, Greenaway S, Houghton R, Karp N, Leblanc S, Lengger C, Maier H, Mallon AM, Marschall S, Melvin D, Morgan H, Pavlovic G, Ryder E, Skarnes WC et al (2012) Mouse large‐scale phenotyping initiatives: overview of the European Mouse Disease Clinic (EUMODIC) and of the Wellcome Trust Sanger Institute Mouse Genetics Project. Mamm Genome 23: 600–610 [DOI] [PMC free article] [PubMed] [Google Scholar]
- Barski A, Cuddapah S, Cui K, Roh TY, Schones DE, Wang Z, Wei G, Chepelev I, Zhao K (2007) High‐resolution profiling of histone methylations in the human genome. Cell 129: 823–837 [DOI] [PubMed] [Google Scholar]
- Berry WL, Janknecht R (2013) KDM4/JMJD2 histone demethylases: epigenetic regulators in cancer cells. Cancer Res 73: 2936–2942 [DOI] [PMC free article] [PubMed] [Google Scholar]
- Bilodeau S, Kagey MH, Frampton GM, Rahl PB, Young RA (2009) SetDB1 contributes to repression of genes encoding developmental regulators and maintenance of ES cell state. Genes Dev 23: 2484–2489 [DOI] [PMC free article] [PubMed] [Google Scholar]
- Binda O (2013) On your histone mark, SET, methylate!. Epigenetics 8: 457–463 [DOI] [PMC free article] [PubMed] [Google Scholar]
- Black JC, Allen A, Van Rechem C, Forbes E, Longworth M, Tschop K, Rinehart C, Quiton J, Walsh R, Smallwood A, Dyson NJ, Whetstine JR (2010) Conserved antagonism between JMJD2A/KDM4A and HP1gamma during cell cycle progression. Mol Cell 40: 736–748 [DOI] [PubMed] [Google Scholar]
- Black JC, Manning AL, Van Rechem C, Kim J, Ladd B, Cho J, Pineda CM, Murphy N, Daniels DL, Montagna C, Lewis PW, Glass K, Allis CD, Dyson NJ, Getz G, Whetstine JR (2013) KDM4A lysine demethylase induces site‐specific copy gain and rereplication of regions amplified in tumors. Cell 154: 541–555 [DOI] [PMC free article] [PubMed] [Google Scholar]
- Boroviak T, Loos R, Bertone P, Smith A, Nichols J (2014) The ability of inner‐cell‐mass cells to self‐renew as embryonic stem cells is acquired following epiblast specification. Nat Cell Biol 16: 516–528 [DOI] [PMC free article] [PubMed] [Google Scholar]
- Bourillot PY, Aksoy I, Schreiber V, Wianny F, Schulz H, Hummel O, Hubner N, Savatier P (2009) Novel STAT3 target genes exert distinct roles in the inhibition of mesoderm and endoderm differentiation in cooperation with Nanog. Stem Cells 27: 1760–1771 [DOI] [PubMed] [Google Scholar]
- Chen J, Liu H, Liu J, Qi J, Wei B, Yang J, Liang H, Chen Y, Chen J, Wu Y, Guo L, Zhu J, Zhao X, Peng T, Zhang Y, Chen S, Li X, Li D, Wang T, Pei D (2013) H3K9 methylation is a barrier during somatic cell reprogramming into iPSCs. Nat Genet 45: 34–42 [DOI] [PubMed] [Google Scholar]
- Cloos PA, Christensen J, Agger K, Maiolica A, Rappsilber J, Antal T, Hansen KH, Helin K (2006) The putative oncogene GASC1 demethylates tri‐ and dimethylated lysine 9 on histone H3. Nature 442: 307–311 [DOI] [PubMed] [Google Scholar]
- Das PP, Shao Z, Beyaz S, Apostolou E, Pinello L, De Los Angeles A, O'Brien K, Atsma JM, Fujiwara Y, Nguyen M, Ljuboja D, Guo G, Woo A, Yuan GC, Onder T, Daley G, Hochedlinger K, Kim J, Orkin SH (2014) Distinct and combinatorial functions of Jmjd2b/Kdm4b and Jmjd2c/Kdm4c in mouse embryonic stem cell identity. Mol Cell 53: 32–48 [DOI] [PMC free article] [PubMed] [Google Scholar]
- Ema M, Mori D, Niwa H, Hasegawa Y, Yamanaka Y, Hitoshi S, Mimura J, Kawabe Y, Hosoya T, Morita M, Shimosato D, Uchida K, Suzuki N, Yanagisawa J, Sogawa K, Rossant J, Yamamoto M, Takahashi S, Fujii‐Kuriyama Y (2008) Kruppel‐like factor 5 is essential for blastocyst development and the normal self‐renewal of mouse ESCs. Cell Stem Cell 3: 555–567 [DOI] [PubMed] [Google Scholar]
- Fodor BD, Kubicek S, Yonezawa M, O'Sullivan RJ, Sengupta R, Perez‐Burgos L, Opravil S, Mechtler K, Schotta G, Jenuwein T (2006) Jmjd2b antagonizes H3K9 trimethylation at pericentric heterochromatin in mammalian cells. Genes Dev 20: 1557–1562 [DOI] [PMC free article] [PubMed] [Google Scholar]
- Fujita Y, Hayashi T, Kiyomitsu T, Toyoda Y, Kokubu A, Obuse C, Yanagida M (2007) Priming of centromere for CENP‐A recruitment by human hMis18alpha, hMis18beta, and M18BP1. Dev Cell 12: 17–30 [DOI] [PubMed] [Google Scholar]
- Geisberg JV, Struhl K (2004) Quantitative sequential chromatin immunoprecipitation, a method for analyzing co‐occupancy of proteins at genomic regions in vivo . Nucleic Acids Res 32: e151 [DOI] [PMC free article] [PubMed] [Google Scholar]
- Hackett JA, Surani MA (2014) Regulatory principles of pluripotency: from the ground state up. Cell Stem Cell 15: 416–430 [DOI] [PubMed] [Google Scholar]
- Hanisch A, Sillje HH, Nigg EA (2006) Timely anaphase onset requires a novel spindle and kinetochore complex comprising Ska1 and Ska2. EMBO J 25: 5504–5515 [DOI] [PMC free article] [PubMed] [Google Scholar]
- Huang Y, Fang J, Bedford MT, Zhang Y, Xu RM (2006) Recognition of histone H3 lysine‐4 methylation by the double tudor domain of JMJD2A. Science 312: 748–751 [DOI] [PubMed] [Google Scholar]
- Illingworth RS, Gruenewald‐Schneider U, Webb S, Kerr AR, James KD, Turner DJ, Smith C, Harrison DJ, Andrews R, Bird AP (2010) Orphan CpG islands identify numerous conserved promoters in the mammalian genome. PLoS Genet 6: e1001134 [DOI] [PMC free article] [PubMed] [Google Scholar]
- Iwamori N, Zhao M, Meistrich ML, Matzuk MM (2011) The testis‐enriched histone demethylase, KDM4D, regulates methylation of histone H3 lysine 9 during spermatogenesis in the mouse but is dispensable for fertility. Biol Reprod 84: 1225–1234 [DOI] [PMC free article] [PubMed] [Google Scholar]
- Kawazu M, Saso K, Tong KI, McQuire T, Goto K, Son DO, Wakeham A, Miyagishi M, Mak TW, Okada H (2011) Histone demethylase JMJD2B functions as a co‐factor of estrogen receptor in breast cancer proliferation and mammary gland development. PLoS ONE 6: e17830 [DOI] [PMC free article] [PubMed] [Google Scholar]
- Kim J, Daniel J, Espejo A, Lake A, Krishna M, Xia L, Zhang Y, Bedford MT (2006) Tudor, MBT and chromo domains gauge the degree of lysine methylation. EMBO Rep 7: 397–403 [DOI] [PMC free article] [PubMed] [Google Scholar]
- Klose RJ, Yamane K, Bae Y, Zhang D, Erdjument‐Bromage H, Tempst P, Wong J, Zhang Y (2006) The transcriptional repressor JHDM3A demethylates trimethyl histone H3 lysine 9 and lysine 36. Nature 442: 312–316 [DOI] [PubMed] [Google Scholar]
- Kooistra SM, Helin K (2012) Molecular mechanisms and potential functions of histone demethylases. Nat Rev Mol Cell Biol 13: 297–311 [DOI] [PubMed] [Google Scholar]
- Kumada T, Yamanaka Y, Kitano A, Shibata M, Awaya T, Kato T, Okawa K, Abe T, Oshima N, Nakahata T, Heike T (2010) Ttyh1, a Ca(2+)‐binding protein localized to the endoplasmic reticulum, is required for early embryonic development. Dev Dyn 239: 2233–2245 [DOI] [PubMed] [Google Scholar]
- Kupershmit I, Khoury‐Haddad H, Awwad SW, Guttmann‐Raviv N, Ayoub N (2014) KDM4C (GASC1) lysine demethylase is associated with mitotic chromatin and regulates chromosome segregation during mitosis. Nucleic Acids Res 42: 6168–6182 [DOI] [PMC free article] [PubMed] [Google Scholar]
- Lanner F (2014) Lineage specification in the early mouse embryo. Exp Cell Res 321: 32–39 [DOI] [PubMed] [Google Scholar]
- Laugesen A, Helin K (2014) Chromatin repressive complexes in stem cells, development, and cancer. Cell Stem Cell 14: 735–751 [DOI] [PubMed] [Google Scholar]
- Lee J, Thompson JR, Botuyan MV, Mer G (2008) Distinct binding modes specify the recognition of methylated histones H3K4 and H4K20 by JMJD2A‐tudor. Nat Struct Mol Biol 15: 109–111 [DOI] [PMC free article] [PubMed] [Google Scholar]
- Lin SC, Wani MA, Whitsett JA, Wells JM (2010) Klf5 regulates lineage formation in the pre‐implantation mouse embryo. Development 137: 3953–3963 [DOI] [PMC free article] [PubMed] [Google Scholar]
- Loh YH, Zhang W, Chen X, George J, Ng HH (2007) Jmjd1a and Jmjd2c histone H3 Lys 9 demethylases regulate self‐renewal in embryonic stem cells. Genes Dev 21: 2545–2557 [DOI] [PMC free article] [PubMed] [Google Scholar]
- Matoba S, Liu Y, Lu F, Iwabuchi KA, Shen L, Inoue A, Zhang Y (2014) Embryonic development following somatic cell nuclear transfer impeded by persisting histone methylation. Cell 159: 884–895 [DOI] [PMC free article] [PubMed] [Google Scholar]
- Mikkelsen TS, Ku M, Jaffe DB, Issac B, Lieberman E, Giannoukos G, Alvarez P, Brockman W, Kim TK, Koche RP, Lee W, Mendenhall E, O'Donovan A, Presser A, Russ C, Xie X, Meissner A, Wernig M, Jaenisch R, Nusbaum C et al (2007) Genome‐wide maps of chromatin state in pluripotent and lineage‐committed cells. Nature 448: 553–560 [DOI] [PMC free article] [PubMed] [Google Scholar]
- Miyazaki T, Miyazaki S, Ashida M, Tanaka T, Tashiro F, Miyazaki J (2013) Functional analysis of Tcl1 using Tcl1‐deficient mouse embryonic stem cells. PLoS ONE 8: e71645 [DOI] [PMC free article] [PubMed] [Google Scholar]
- Nestorov P, Tardat M, Peters AH (2013) H3K9/HP1 and Polycomb: two key epigenetic silencing pathways for gene regulation and embryo development. Curr Top Dev Biol 104: 243–291 [DOI] [PubMed] [Google Scholar]
- Pedersen MT, Helin K (2010) Histone demethylases in development and disease. Trends Cell Biol 20: 662–671 [DOI] [PubMed] [Google Scholar]
- Pedersen MT, Agger K, Laugesen A, Johansen JV, Cloos PA, Christensen J, Helin K (2014) The demethylase JMJD2C localizes to H3K4me3‐positive transcription start sites and is dispensable for embryonic development. Mol Cell Biol 34: 1031–1045 [DOI] [PMC free article] [PubMed] [Google Scholar]
- Robertson SA, Sjoblom C, Jasper MJ, Norman RJ, Seamark RF (2001) Granulocyte‐macrophage colony‐stimulating factor promotes glucose transport and blastomere viability in murine preimplantation embryos. Biol Reprod 64: 1206–1215 [DOI] [PubMed] [Google Scholar]
- Shi L, Sun L, Li Q, Liang J, Yu W, Yi X, Yang X, Li Y, Han X, Zhang Y, Xuan C, Yao Z, Shang Y (2011) Histone demethylase JMJD2B coordinates H3K4/H3K9 methylation and promotes hormonally responsive breast carcinogenesis. Proc Natl Acad Sci USA 108: 7541–7546 [DOI] [PMC free article] [PubMed] [Google Scholar]
- Truax AD, Greer SF (2012) ChIP and Re‐ChIP assays: investigating interactions between regulatory proteins, histone modifications, and the DNA sequences to which they bind. Methods Mol Biol 809: 175–188 [DOI] [PubMed] [Google Scholar]
- Venkatesh S, Workman JL (2013) Set2 mediated H3 lysine 36 methylation: regulation of transcription elongation and implications in organismal development. Wiley Interdiscip Rev Dev Biol 2: 685–700 [DOI] [PMC free article] [PubMed] [Google Scholar]
- Venoux M, Tait X, Hames RS, Straatman KR, Woodland HR, Fry AM (2013) Poc1A and Poc1B act together in human cells to ensure centriole integrity. J Cell Sci 126: 163–175 [DOI] [PMC free article] [PubMed] [Google Scholar]
- Wang J, Zhang M, Zhang Y, Kou Z, Han Z, Chen DY, Sun QY, Gao S (2010) The histone demethylase JMJD2C is stage‐specifically expressed in preimplantation mouse embryos and is required for embryonic development. Biol Reprod 82: 105–111 [DOI] [PubMed] [Google Scholar]
- Whetstine JR, Nottke A, Lan F, Huarte M, Smolikov S, Chen Z, Spooner E, Li E, Zhang G, Colaiacovo M, Shi Y (2006) Reversal of histone lysine trimethylation by the JMJD2 family of histone demethylases. Cell 125: 467–481 [DOI] [PubMed] [Google Scholar]
- Ying QL, Wray J, Nichols J, Batlle‐Morera L, Doble B, Woodgett J, Cohen P, Smith A (2008) The ground state of embryonic stem cell self‐renewal. Nature 453: 519–523 [DOI] [PMC free article] [PubMed] [Google Scholar]
- Young RA (2011) Control of the embryonic stem cell state. Cell 144: 940–954 [DOI] [PMC free article] [PubMed] [Google Scholar]
- Yuan P, Han J, Guo G, Orlov YL, Huss M, Loh YH, Yaw LP, Robson P, Lim B, Ng HH (2009) Eset partners with Oct4 to restrict extraembryonic trophoblast lineage potential in embryonic stem cells. Genes Dev 23: 2507–2520 [DOI] [PMC free article] [PubMed] [Google Scholar]
Associated Data
This section collects any data citations, data availability statements, or supplementary materials included in this article.
Supplementary Materials
Appendix
Expanded View Figures PDF
Table EV1
Table EV2
Table EV3
Source Data for Expanded View and Appendix
Review Process File
Source Data for Figure 1C
Source Data for Figure 2A–D
Source Data for Figure 7A


