Abstract
Species-specific colors and patterns on animal body surfaces are determined primarily by neural-crest-derived pigment cells in the skin (chromatophores). However, even closely related species display widely differing patterns. These contrasting aspects of chromatophores (i.e., the fixed developmental control within species and extreme diversity among species) seem to be a curious and suitable subject for understanding evolution and diversity of organisms. Here we identify a gene responsible for medaka “color interfere” mutants by positional cloning. These mutants do not show any obvious morphological and physiological defects other than defects in chromatophore proliferation and morphogenesis. The mutation has been identified as an 11-base deletion in somatolactin, which causes truncation 91 aa upstream of the C terminus of the protein's 230 aa. Somatolactin transcription changed dramatically during morphological body color adaptation to different backgrounds. This genetic evidence explains somatolactin function. Studying this mutant will provide further insights into the development and regulation of chromatophores and clues for reassessing other functions of somatolactin suggested in other fish.
The development and genetics of chromatophores have been studied extensively by using mouse coat-color mutants (1). However, mammalian models do not permit complete understanding of vertebrate pigmentation, because mammals have lost most types of chromatophores (as well as their color vision), as a result of long periods of nocturnal behavior during evolution (2). Because body colors and patterns are among the most variable and readily recognizable features of animals, chromatophores should be a suitable research subject to understand variation in biology.
The medaka has recently emerged as a model organism whose usefulness and effectiveness in forward genetics compare favorably with those of zebrafish (3). These two fish separated from their last common ancestor ≈110 million years ago (4) and show distinct differences in body color (e.g., stripe formation in zebrafish and an extra type of chromatophore in medaka; see below). Many pigmentation mutants (5–7) and some of the responsible genes (8–14) have been isolated from both species. These studies, along with those on mice, revealed both common and disparate features in the regulation of chromatophore development, and indicated that orthologous genes do not necessarily serve identical functions in different species. Thus, comparison of the functions of pigmentation genes in these diverse model organisms provides invaluable examples and insights into understanding how genes evolve to achieve a diversity of organisms in general.
We analyzed medaka color interfere (ci) mutants, which have unique defects in proliferation and morphogenesis of certain types of chromatophores on skin, and identified a mutation in the gene encoding somatolactin, a hormone of growth hormone/prolactin family, as the cause of the ci mutant phenotypes. This study provides genetic evidence of somatolactin function, and further investigation using the ci medaka will provide insights into development and regulation of chromatophores.
Materials and Methods
Fish and Locus Mapping. We studied the medaka ci mutants maintained at Nagoya University (5). These were crossed to Northern-inbred HNI for locus mapping. We bred the F2 fish until the ci phenotypes could be clearly distinguished from the wild type, and extracted DNA by using a PI-50 automated DNA isolator. Polymorphisms in EST/sequence-tagged sites and bacterial artificial chromosome (BAC) ends were detected by HNI-specific amplification in PCR, difference in length or restriction enzyme sites, or single-nucleotide polymorphisms detected by direct sequence of PCR products.
Motile Responses of Chromatophores. The perfusion chamber described elsewhere (15) was used to examine the responsiveness of melanophores and leucophores on scales to a variety of chemicals.
Background Adaptation. Fish were kept in a 25-liter tank with a background of brown sand. Fish were then adapted to a black- or a white-background aquarium under illumination of 3,000 lux at the surface of the water. Scales were isolated from the dorsal trunks of fish, and chromatophore densities and sizes, measured as the area containing dispersed pigment granules in a pigment cell, were analyzed by using NIH image software. Results in Fig. 2e are shown as means ± SEM.
Fig. 2.
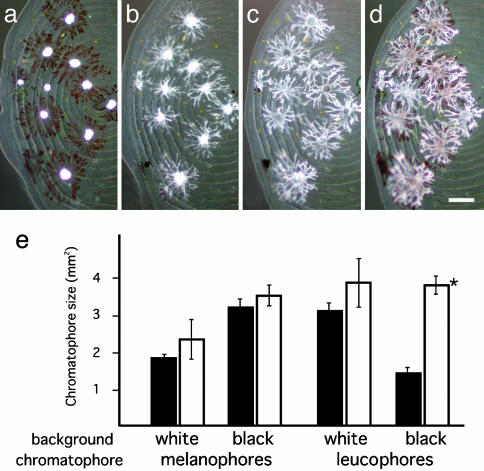
Responses of ci chromatophores to chemicals and backgrounds. (a–d) Chromatosome movements within leucophores and melanophores on ci mutant scales. (a) Movements in Ringer's solution. (b) Movements in 60 mM KCl Ringer's solution. (c) Movements in 10–5 M noradrenaline. (d) Movements in 10–7 M forskolin. Aggregation and dispersion of melanosomes and leucosomes were normal in ci mutants. We also screened α-melanophore-stimulating hormone, melanophore-concentrating hormone, and melatonin, none of which caused abnormal aggregation or dispersion of leucosomes or melanosomes. (Scale bar, 0.1 mm.) (e) Cell size of scale chromatophores of background-adapted fish. Melanophore size increased or decreased in response to black or white backgrounds, respectively, in both the wild type (black) and ci (white). In contrast, leucophores decreased or increased in response to black or white backgrounds, respectively, in the wild type. Leucophores in the ci mutant did not decrease on a black background (asterisk). A similar result was obtained for cell numbers under these conditions (data not shown).
Positional Cloning. We used the BAC library based on the HNI genome (16) for chromosome walking. Probes for screening were amplified by PCR and purified twice by using a QIAquick Gel Extraction kit (Qiagen, Valencia, CA). We used an AlkPhos Direct Labeling and Detection System (Amersham Pharmacia) for membrane screening, a Qiagen Plasmid Midi kit for isolation of BAC DNA from 500 ml of LB culture, and a BigDye Terminator Cycle Sequencing kit (Applied Biosystems) for direct end sequencing of the BAC. In the shotgun library construction, we used a Qiagen Large-Construct kit for BAC DNA isolation and a TOPO Shotgun Subcloning kit (Invitrogen) for sheering and subcloning. Shotgun sequencing was performed on an ABI PRISM 3100 Genetic Analyzer by direct sequencing of colony PCR products. We manually assembled the sequences by using seqmanii software (DNAstar) and used the blastx program for annotation.
Expression and RACE. We used ISOGEN (Nippon Gene) for isolating total RNA from organs and embryos. The first-strand DNA was synthesized by using a 3′ adaptor and ReverTra Ace (Toyobo) following the attached protocol, and a 5′ adaptor was added after the 20-min incubation. The DNA was further incubated for 1 h and used as a template for RT-PCR. RACEs were performed by nested PCR using primers complementary to the 3′ and 5′ adaptors and specific primers complementary to somatolactin-translated sequences. The strongest bands were cut, extracted from the agarose gel, subcloned into a pCR4-TOPO vector (Invitrogen), and sequenced. Semiquantitative RT-PCR was performed by using equal amounts of total RNAs for reverse transcription. Twenty, 23, 27, and 30 PCR cycles were tried to determine optimum conditions before the plateau.
Results
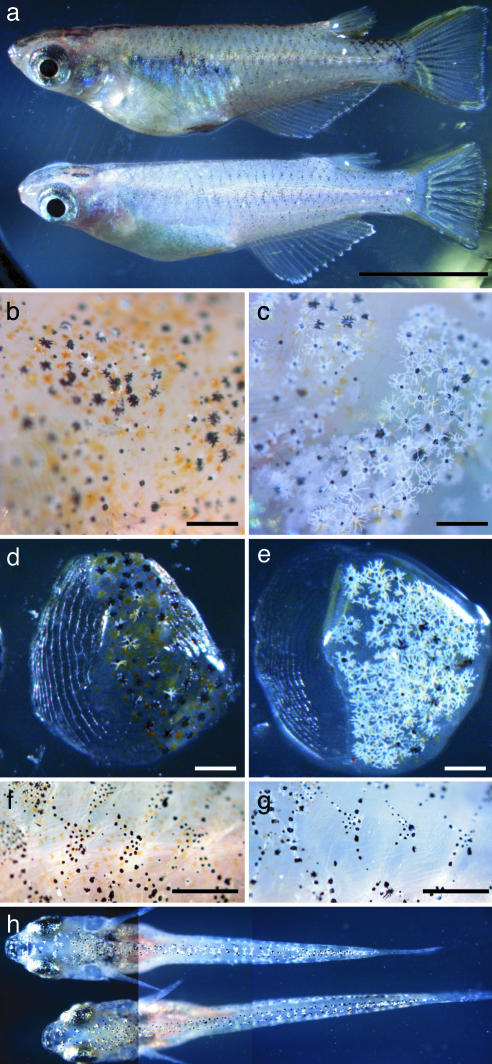
Phenotypes of the Medaka ci Mutant. Medaka ci is one of the pigmentation mutants (5) that exhibit abnormal proliferation and differentiation of chromatophores (Fig. 1a). Its gray body color is caused by a dramatic increase in the number and cell size of white leucophores and concomitant decrease in the number of visible orange xanthophores (Fig. 1 b–g) (17). We observed no apparent phenotypes of silver iridophores and black melanophores (homologue of mammalian melanocyte). Its embryonic and early larval phenotypes were not as apparent as adults (Fig. 1h), but became increasingly obvious during development and growth.
Fig. 1.
Appearance of wild-type and ci fish. (a) Lateral views of male adult wild-type (upper) and ci (lower) fish. (b and c) Larger magnification of body surfaces of wild-type (b) and ci (c) fish. Increased number and more dendritic shape of leucophores are observed. Fewer xanthophores are visible. No apparent differences are observed in melanophores. (d–g) When the scales are peeled off with forceps, epidermis and chromatophores are also removed. Dramatically increased number of scale leucophores could be observed in ci mutants (e) compared with wild type (d). Under the scales, scattered xanthophores in wild type (f) are mostly invisible in ci (g). (h) F2 intercross siblings with phenotype of ci (upper) and wild type (lower). When the larvae reached this size (8 mm), they could be distinguished without the microscope because of their bright color. Note slightly more dendritic leucophores in ci. The phenotype appears even before this stage, although it is more difficult to recognize (data not shown). (Scale bar = 1cmin a; 0.5 mm in b–e; and 1 mm in f and g.)
The increase in number and more dendritic appearance of leucophores in the ci adult was not associated with abnormalities of movement of intracellular chromatosomes (leucosomes) in response to extracellular chemical and hormonal stimuli (Fig. 2 a–d; other data not shown), suggesting normal signal transduction in and terminal differentiation of the ci leucophores. The ci fish did not show any defects in other physiological processes, such as viability, growth, and reproduction, or behavior, such as feeding, swimming, and mating under normal breeding conditions. This observation suggests that the product encoded by the ci locus, or the region disrupted by the ci mutation, participates exclusively in proliferation and morphogenesis of the leucophores and xanthophores.
Fish adapt their body color physiologically (by chromatosome aggregation and dispersion) and morphologically (by changes in cell number and shape) according to the color of their background (18); the black–white background adaptation of melanophores and leucophores has been well characterized in medaka (19). Thus, we questioned whether the number and size of the ci leucophores would decrease on a black background. The number and size of leucophores decreased on the black background in the wild-type fish, but not in the ci fish (Fig. 2e, other data not shown). Considering that ci melanophores respond normally to both black and white backgrounds (Fig. 2e), the abnormal regulation of the ci leucophores is unlikely to be related to visual problems in the eyes or brain (i.e., the fish recognize that the background is black, but cannot properly adapt their body color). Therefore, we believe it likely that the ci locus directly regulates proliferation and morphogenesis of leucophores (and possibly xanthophores), with little or no effect on melanophores and iridophores. Taken together, these observations of gradually appearing phenotypes (Fig. 1 a and h) and defects in morphological background adaptation (Fig. 2e) suggest that a hormone or its receptor might be encoded by the ci locus.
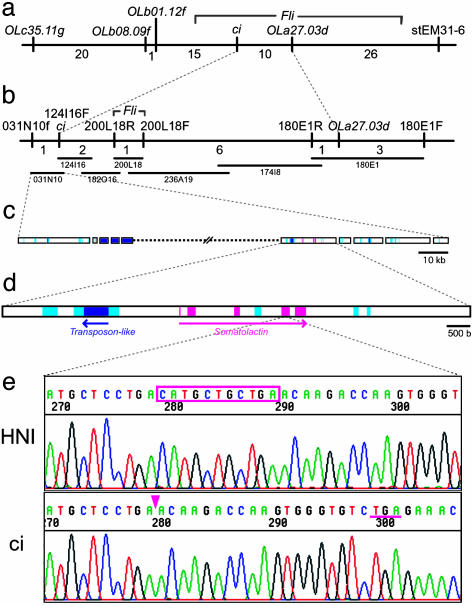
Positional Cloning of the ci Gene. Because little is known about leucophore proliferation and morphogenesis, we took a positional approach to clone the ci gene. We obtained 443 F2 siblings between the ci and Northern-inbred HNI (20) to observe 886 meioses for detailed locus mapping. Because linkage of the ci and tyrosinase (i) loci has already been reported (21), the ci locus should be on medaka linkage group (LG) 13 (22). We constructed a high-resolution recombination map around the ci locus by using several DNA markers on LG13, whose primer and polymorphism information is publicly available in the Mbase database (http://mbase.bioweb.ne.jp/∼dclust/medaka_top.html) (Fig. 3a).
Fig. 3.
Positional cloning of the ci gene. (a) A high-resolution recombination map around the ci locus on linkage group 13. The location of Fli was unclear in this map, although another map (constructed between Northern HNI and Southern AA2) elucidated its location between OLb01.12f and stEM31–6 (data not shown). Numbers under the map are the number of recombinations detected between neighboring markers (among 886 meioses). (b) BAC contig between the ci locus and OLa27.03d. The BAC 031N10 contains the ci mutation candidate region. (c) Diagram of a part of 031N10 insert sequences determined by shotgun sequencing. Assembly was disturbed by multiple copies of repetitive sequences (light blue), including reverse-transcriptase-, transposase-, and small interspersed nuclear element-like sequences (dark blue). Only one ORF (pink) was identified by blastx analyses. (d) Higher magnification of the contig, including the ci candidate gene, somatolactin. Exons are indicated by pink. (e) Partial sequences of the fourth exon of somatolactin (Upper, wild type; Lower, ci). The ci mutation (deleted 11 bases) is boxed and its position in the ci allele is indicated by an arrowhead. A newly created in-frame stop codon caused by the frameshift is underlined.
We then started chromosome walking from the nearest EST OLa27.03d (10 recombinations of 886 meioses), and Friend leukemia virus integration (Fli) homologue, although we could not determine Fli's precise location on our map because of a lack of polymorphism (Fig. 3a). End mapping of Fli-positive BAC revealed Fli's location to be closer to the ci locus than OLa27.03d's location, and we could cross the ci-mutation candidate region at the fourth BAC from Fli (Fig. 3b). We then sequenced this BAC (031N10) with ≈230 kb of insert by the shotgun method. We read 759,505 bp in total and assembled them into 68 contigs of 219,487 bp, as partially summarized in Fig. 3c. However, this assembly might not be perfect because of disturbance by multiple copies of repetitive sequences within the insert. The blastx program identified only one ORF, somatolactin, as a strong candidate for the ci gene (Fig. 3d).
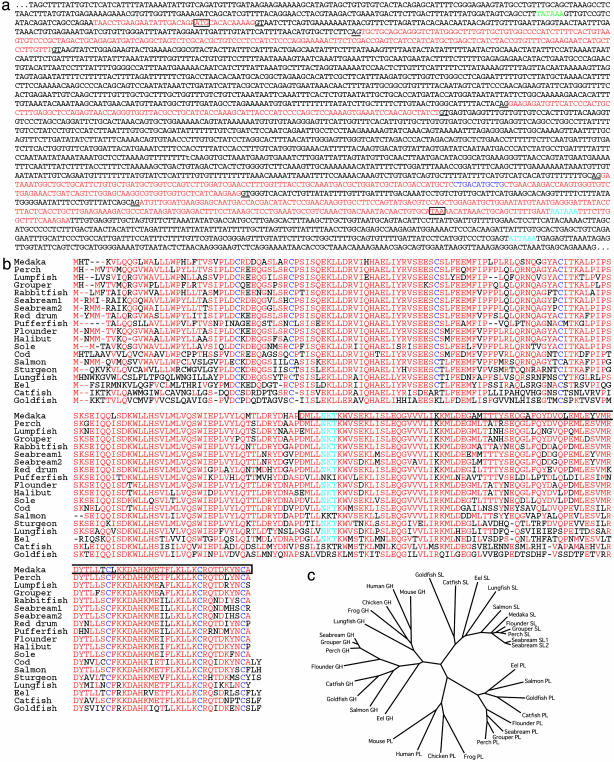
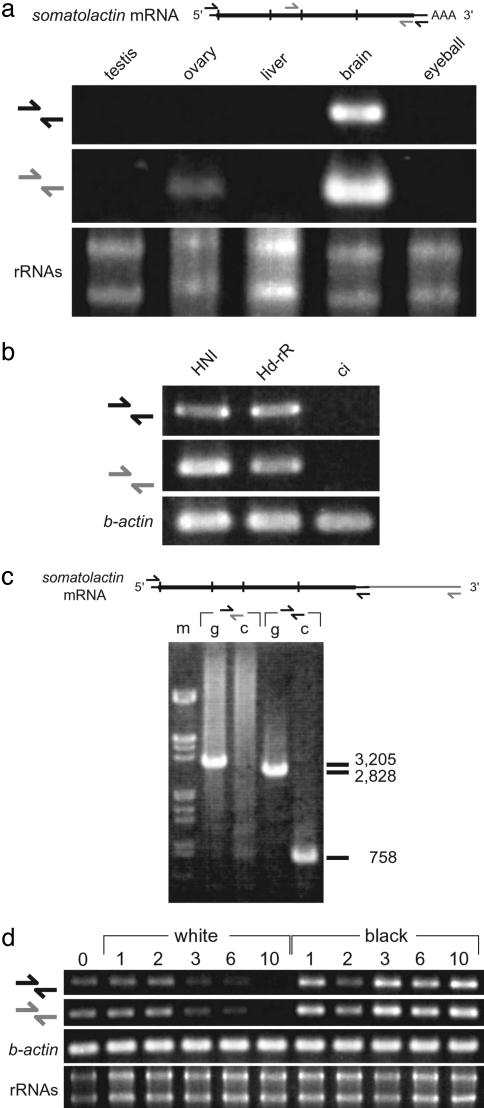
Somatolactin is a hormone of the growth hormone–prolactin family, and was originally found in the flounder pituitary cDNA library (23). It has been implicated in many physiological processes, including energy homeostasis, the stress response, reproduction, fat or ion metabolism, acidosis, pigmentation, and other processes, although there is little supporting direct molecular evidence (for references, see ref. 24). We isolated the whole ORF of medaka somatolactin by 3′ and 5′ RACE, and found that the protein consists of 230 amino acids encoded by five exons (Fig. 4 a and b). We then compared the wild-type and ci ORFs, and identified an 11-bp deletion within the fourth exon (Figs. 3e and 4a), which causes frame-shift and severe truncation of 91 C-terminal amino acids (Fig. 4b). This mutation is likely to result in less- or nonfunctional somatolactin. Moreover, the somatolactin transcript is greatly reduced in the ci mutants (Fig. 5b; discussed further below). Therefore, we conclude that this mutation in somatolactin in the ci mutants causes the abnormal proliferation and morphogenesis of leucophores and xanthophores.
Fig. 4.
The medaka somatolactin and phylogenetic analyses with related proteins. (a) Genomic sequence of the medaka ci locus. Red indicates five exons of somatolactin identified by 3′ and 5′ RACEs. Splice donor and acceptor consensus sequences are underlined. Light blue shows the two putative poly(A) signal sequences (see text). Dark blue shows the deleted 11 bases in the ci allele. Translation initiation and stop codons are boxed. Putative TATA box is indicated by green. (b) The amino acid sequence of medaka somatolactin and its alignment to those of other fish. Residues conserved among the majority of them are shown in red. N-glycosylation sequences are shown by light blue, and seven cysteine residues relatively conserved among the somatolactins are indicated by dark blue. Boxed residues are deleted and substituted with seven different amino acids (EQDQVGV) in medaka ci. (c) The phylogenetic relationship among growth hormone (GH), prolactin (PL), and somatolactin (SL) is redrawn according to the result from the clustalw software. Only fish from which these three hormone sequences are available on the GenBank database are shown, except for medaka and lungfish. Fish somatolactins create a distinct clade to other GH-PL members in higher vertebrates (including placental lactogens and somatostatins, data not shown). Note the similar phylogenetic relationship in fish between growth hormone and prolactin, but not with somatolactin.
Fig. 5.
Expressional analyses of somatolactin mRNA. (a) Expression of the medaka somatolactin mRNA in adult organs. (Upper) Diagram of mRNA. The broad line shows translated regions and the vertical lines show boundaries between exons. Arrows show positions of primers. (Lower) Strong expression was detected only in brain, including pituitary; much weaker expression was detected in gonads and embryos (data not shown). (b) Somatolactin RT-PCR using brain cDNAs of Northern inbred (HNI), Southern inbred (Hd-rR), and ci. No product was detectable in ci. Identical primers to those in a were used. (c) Genomic and RT-PCR using reverse primers designed at two putative poly(A) signal sequences (Fig. 4a). Their forward primers (black) are identical. The reverse primer at the first poly(A) signal (black) amplified products of the expected length from both genomic DNA (g) and brain cDNA (c), but the reverse primer at the second poly(A) signal (gray) amplified only from genomic DNA, indicating few, if any, longer transcripts in medaka. (d) Somatolactin transcription during background adaptation. Identical primers to those shown in a were used. Wild-type fish were adapted to black or white backgrounds for 0, 1, 2, 3, 6, and 10 days, as indicated on top. The total RNAs in brain were quantified by spectrophotometry and gel electrophoreses, and RT-PCR was performed for somatolactin and β-actin using the same amount of template. Although β-actin band intensity did not differ among these fish, somatolactin transcripts gradually and markedly decreased during white-background adaptation. No obvious change was observed during black-background adaptation.
Somatolactin Expression. Somatolactin transcripts were detected in medaka brain, suggesting that it is produced in the pituitary, where it is produced in other species (Fig. 5a). We also found weaker expression of somatolactin in the gonads and during embryonic development, as reported in other fish (25, 26) (data not shown). Interestingly, transcription could not be detected in the ci brain (Fig. 5b). This could have resulted from destabilization of mRNA due to the mutation, or, less likely, from another mutation in a gene-regulating region. Two somatolactin transcripts of different length and two poly(A) signal sites have been reported in several species (see ref. 26 and references therein). We also found another poly(A) signal ≈380 bp downstream from the first one in medaka (Fig. 4a); however, experiments using primers complementary to these two poly(A) sites detected little or very slight expression of this longer form (Fig. 5c). Given the severe truncation of somatolactin (Fig. 4b) and its greatly reduced transcription (Fig. 5b), we believe that the ci medaka is likely to be a somatolactin-null mutant. However, we cannot exclude the possibility that the very low level expression of the N-terminal region alone may be sufficient for regulation of cells other than leucophores and xanthophores.
Lastly, we analyzed the regulation of somatolactin transcription during morphological background adaptation by semiquantitative RT-PCR. As shown in Fig. 5d, somatolactin transcription dramatically decreased in wild-type fish kept on a white background. We observed no up-regulation during black-background adaptation (Fig. 5d). Therefore, we conclude that somatolactin suppresses proliferation and morphogenesis of leucophores, which can be promoted by either a mutation (the ci mutants) or its down-regulation (during white-background adaptation). We also conclude that somatolactin plays little or no role during black-background adaptation by decreasing leucophores (by apoptosis, for example; see ref. 19). Somatolactin seems to have opposite effects on xanthophores (i.e., promoting their proliferation or morphogenesis) (Fig. 1), because the number of visible xanthophores decreases on white background (5.62 ± 1.34 and 11.85 ± 0.77 cells per 0.1 mm2 on white and black background, respectively).
Discussion
Diverged Roles of Somatolactin in Teleosts? We have elucidated that the ci medaka is a putative somatolactin-null mutant and that the medaka somatolactin plays an exclusive role in chromatophore regulation. However, other functions of somatolactin have also been suggested by studies of other fish. These studies have detected up- and down-regulation of somatolactin during processes other than background adaptation (see above). Seasonal or sexual maturation or physical stress, for example, can be accompanied by body color changes, and this might be the reason for the up- and down-regulation of somatolactin detected in these experiments. However, if somatolactin does play an indispensable role in metabolism, growth, or reproduction, there are two possible explanations for this apparent contradiction.
One possible explanation is that all somatolactins reported so far are not true orthologues. Fugu and medaka seem to have only one copy of somatolactin, according to their genome databases (which are still incomplete in medaka). Seabream, however, has two similar somatolactins (27) and goldfish has a unique somatolactin (28) (Fig. 4c). Moreover, a somatolactin-like protein has been recently reported in rainbow trout (29). Thus, careful definition of an orthologous relationship among the putative “somatolactin family” genes is needed for further investigation of somatolactin's functions.
The other possibility is that orthologous somatolactins have different functions in different fish. Medaka and red drum somatolactins seem to be functionally orthologous (30, 31). However, the amino acid sequences of somatolactin do not always share common features (Fig. 4 b and c; see also ref. 31). If the function of somatolactin has changed during evolution, it would be interesting to compare somatolactin's functions in different species in the context of gene and genome variation. Somatolactin is not found in mouse or human genomes, suggesting that these species have lost the gene and its target cells (leucophores and xanthophores) during evolution. It would be one of the next intriguing questions to investigate the existence and function of somatolactin in zebrafish, which have xanthophores but no leucophores (32, 33).
Working Mechanism of Somatolactin on Chromatophores. We found no evidence for direct regulation of leucophores or xanthophores by somatolactin. Another possible mechanism is that somatolactin indirectly regulates either or both of the chromatophores via cell-to-cell interaction. It seems less likely, but we cannot exclude the possibility that another mutation on neighboring gene(s) (but not contained in the 031N10) might be responsible in part for the ci phenotypes, although we did not observe novel body-color alterations (i.e., recombinants) in ≈2,000 HNI-ci F2 siblings (443 of them with ci phenotype were used for locus mapping; Fig. 3a). Protocols for genetic and developmental experiments to study the ci mutant in medaka (3), isolating somatolactin's receptor(s) and downstream genes, and identifying their expression patterns and interactions should address these questions. Future studies should provide insights into development and regulation of these neural-crest derived chromatophores, and will help identify possible functions of somatolactin suggested in other fish.
Acknowledgments
We thank S. Asakawa and N. Shimizu of Keio University for the HNI BAC library; K. Ozato and Y. Wakamatsu of Nagoya University for the ci medaka; K. Naruse of University of Tokyo for EST information; Y. Imai and A. Kudo of Tokyo Institute of Technology for Fli information; A. Shimada, S. Takada, and K. Aizawa of University of Tokyo for fish care; and R. N. Kelsh of University of Bath and S. Oda of University of Tokyo for comments on the manuscript. This research was supported by a Grant-in-Aid from the Ministry of Education, Science, Sports, Culture, and Technology (MEXT), Japan (scientific research on priority areas, area number 813).
This paper was submitted directly (Track II) to the PNAS office.
Abbreviation: BAC, bacterial artificial chromosome.
Data deposition: The sequences reported in this paper have been deposited in the GenBank database (accession nos. AY530202 and AY605289).
References
- 1.Nakamura, M., Tobin, D. J., Richards-Smith, B., Sundberg, J. P. & Paus, R. (2002) J. Dermatol. Sci. 28, 1–33. [DOI] [PubMed] [Google Scholar]
- 2.Walls, G. L. (1942) The Vertebrate Eye and Its Adaptive Radiation (Cranbrook Institute of Science, Bloomfield Hills, MI).
- 3.Wittbrodt, J., Shima, A. & Schartl, M. (2002) Nat. Rev. Genet. 3, 53–64. [DOI] [PubMed] [Google Scholar]
- 4.Nelson, J. S. (1994) Fishes of the World (Wiley, New York).
- 5.Tomita, H. (1990) in Biology of the Medaka, eds. Egami, N., Yamagami, K. & Shima, A. (Univ. of Tokyo Press, Tokyo), pp. 111–128.
- 6.Odenthal, J., Rossnagel, K., Haffter, P., Kelsh, R. N., Vogelsang, E., Brand, M., van Eeden, F. J., Furutani-Seiki, M., Granato, M., Hammerschmidt, M., et al.. (1996) Development (Cambridge, U.K.) 123, 391–398. [DOI] [PubMed] [Google Scholar]
- 7.Kelsh, R. N., Brand, M., Jiang, Y. J., Heisenberg, C. P., Lin, S., Haffter, P., Odenthal, J., Mullins, M. C., van Eeden, F. J., Furutani-Seiki, M., et al. (1996) Development (Cambridge, U.K.) 123, 369–389. [DOI] [PubMed] [Google Scholar]
- 8.Koga, A., Inagaki, H., Bessho, Y. & Hori, H. (1995) Mol. Gen. Genet. 249, 400–405. [DOI] [PubMed] [Google Scholar]
- 9.Fukamachi, S., Shimada, A. & Shima, A. (2001) Nat. Genet. 28, 381–385. [DOI] [PubMed] [Google Scholar]
- 10.Lister, J. A., Robertson, C. P., Lepage, T., Johnson, S. L. & Raible, D. W. (1999) Development (Cambridge, U.K.) 126, 3757–3767. [DOI] [PubMed] [Google Scholar]
- 11.Parichy, D. M., Rawls, J. F., Pratt, S. J., Whitfield, T. T. & Johnson, S. L. (1999) Development (Cambridge, U.K.) 126, 3425–3426. [DOI] [PubMed] [Google Scholar]
- 12.Parichy, D. M., Ransom, D. G., Paw, B., Zon, L. I. & Johnson, S. L. (2000) Development (Cambridge, U.K.) 127, 3031–3044. [DOI] [PubMed] [Google Scholar]
- 13.Parichy, D. M., Mellgren, E. M., Rawls, J. F., Lopes, S. S., Kelsh, R. N. & Johnson, S. L. (2000) Dev. Biol. 227, 294–306. [DOI] [PubMed] [Google Scholar]
- 14.Dutton, K. A., Pauliny, A., Lopes, S. S., Elworthy, S., Carney, T. J., Rauch, J., Geisler, R., Haffter, P. & Kelsh, R. N. (2001) Development (Cambridge, U.K.) 128, 4113–4125. [DOI] [PubMed] [Google Scholar]
- 15.Fujii, R. & Miyashita, Y. (1975) Comp. Biochem. Physiol. C 51, 171–178. [DOI] [PubMed] [Google Scholar]
- 16.Kondo, M., Froschauer, A., Kitano, A., Nanda, I., Hornung, U., Volff, J. N., Asakawa, S., Mitani, H., Naruse, K., Tanaka, M., et al. (2002) Gene 295, 213–222. [DOI] [PubMed] [Google Scholar]
- 17.Takeuchi, T. (1969) Biol. J. Okayama Univ. 15, 1–24. [Google Scholar]
- 18.Sugimoto, M. (2002) Microsc. Res. Tech. 58, 496–503. [DOI] [PubMed] [Google Scholar]
- 19.Sugimoto, M., Uchida, N. & Hatayama, M. (2000) Cell Tissue Res. 301, 205–216. [DOI] [PubMed] [Google Scholar]
- 20.Hyodo-Taguchi, Y. (1980) Zool. Mag. (Tokyo) 89, 283–301. [Google Scholar]
- 21.Yamamoto, T. & Oikawa, T. (1973) Jpn. J. Genet. 48, 361–375. [Google Scholar]
- 22.Naruse, K., Fukamachi, S., Mitani, H., Kondo, M., Matsuoka, T., Kondo, S., Hanamura, N., Morita, Y., Hasegawa, K., Nishigaki, R., et al. (2000) Genetics 154, 1773–1784. [DOI] [PMC free article] [PubMed] [Google Scholar]
- 23.Ono, M., Takayama, Y., Rand-Weaver, M., Sakata, S., Yasunaga, T., Noso, T. & Kawauchi, H. (1990) Proc. Natl. Acad. Sci. USA 87, 4330–4334. [DOI] [PMC free article] [PubMed] [Google Scholar]
- 24.Vega-Rubin de Celis, S., Gomez, P., Calduch-Giner, J. A., Medale, F. & Perez-Sanchez, J. (2003) Mar. Biotechnol. 5, 92–101. [DOI] [PubMed] [Google Scholar]
- 25.Yang, B. Y., Greene, M. & Chen, T. T. (1999) Mol. Reprod. Dev. 53, 127–134. [DOI] [PubMed] [Google Scholar]
- 26.Herrero-Turrion, M. J., Rodriguez, R. E., Velasco, A., Aijon, J. & Lara, J. M. (2003) Gen. Comp. Endocrinol. 132, 77–87. [DOI] [PubMed] [Google Scholar]
- 27.Cavari, B., Funkenstein, B. & Kawauchi, H. (2000) Fish. Physiol. Biochem. 22, 145–150. [Google Scholar]
- 28.Cheng, K. W., Chan, Y. H., Chen, Y. D., Yu, K. L. & Chan, K. M. (1997) Biochem. Biophys. Res. Commun. 232, 282–287. [DOI] [PubMed] [Google Scholar]
- 29.Yang, B. Y. & Chen, T. T. (2003) Endocrinology 144, 850–857. [DOI] [PubMed] [Google Scholar]
- 30.Zhu, Y. & Thomas, P. (1995) Gen. Comp. Endocrinol. 99, 275–288. [DOI] [PubMed] [Google Scholar]
- 31.Zhu, Y., Yoshiura, Y., Kikuchi, K., Aida, K. & Thomas, P. (1999) Gen. Comp. Endocrinol. 113, 69–79. [DOI] [PubMed] [Google Scholar]
- 32.Quigley, I. K. & Parichy, D. M. (2002) Microsc. Res. Tech. 58, 442–455. [DOI] [PubMed] [Google Scholar]
- 33.Zhu, Y., Stiller, J. W., Shaner, M. P., Baldini, A., Scemama, J. L. & Capehart, A. A. (2004) J. Endocrinol., in press. [DOI] [PubMed]


