Abstract
Objective:
This study aims to screen and validate five individual warfarin dosing models (four Asian model algorithms, namely, Ohno, Wen, Miao, Huang, and the algorithm of International Warfarin Pharmacogenetic Consortium, namely IWPC algorithm) with the aim of evaluating their accuracy, practicality, and safety.
Materials and Methods:
Patients’ CYP2C9*3 and VKORC1–1639G >A genes were genotyped, and patient-related information and steady warfarin doses were recorded. The difference between the predicted dose and actual maintenance dose of each model was compared.
Results:
The prediction accuracies of the Huang and Wen models were the highest. In terms of clinical practicality, the Huang model rated the highest for the low-dose group, whereas the Ohno and IWPC models rated the highest for the middle-dose group. The models tended to markedly overpredict the doses in the low-dose group, especially the IWPC model. The Miao model tended to severely underpredict the doses in the middle-dose group, whereas no model exhibited severe overprediction.
Conclusions:
Since none of the models ranked high for all the three criteria considered, the impact of various factors should be thoroughly considered before selecting the most appropriate model for the region's population.
KEY WORDS: Mechanical heart valve replacement, model, pharmacogenomics, verification, warfarin
Introduction
Mechanical heart valve replacement (MHVR) patients require lifelong warfarin administration to prevent thromboembolic diseases. However, many patients exhibited high sensitivity to warfarin 3 months postsurgery, which increased the incidences of bleeding events.[1,2,3] If the patients were administered a uniform initial dose, the individual with gene mutations might respond rapidly or slowly, and the risks of bleeding and thrombosis would be high.[2] Warfarin has been widely used clinically but has a narrow therapeutic window, and doses of warfarin vary markedly among patients, which was mainly owing to genetic factors. Thus far, the relationships of differences in warfarin dose and CYP2C9 and VKORC1 genotypes have been recognized.[4] In 2007, the Food and Drug Administration updated instructions regarding warfarin use and mandated the indication of a disclaimer, since CYP2C9 and the genotype of the target protein gene VKORC1 might influence patients’ responses.[5] The pharmacogenomics-based individualized warfarin dosing model (PIWDM) considers the genotypes of different individuals and predicts the dose, reducing adverse effects caused by differences in doses to some extent.[6,7] Although a number of PIWDMs existed, few domestic researches have been performed to compare these models, and the conclusions of partial researches abroad also exhibited wide differences.[8,9,10] To choose the most suitable administration model among the many available PIWDMs, and to promote the use of these models in clinics, it is important to verify the accuracy and clinical practicality of the models. Therefore, it was necessary to address the mentioned concerns in Chinese Han patients post-MHVR, to identify the most suitable administration model, and to avoid the huge risks caused by models that were used in clinics without enough assessment, as well as to provide a strong basis for the next clinical model application.
Materials and Methods
Subjects
Two-hundred and eight MHVR patients, for whom steady anticoagulation were achieved within 3 months after warfarin began, were selected from September 2009 to September 2011. This study was conducted in accordance with the Declaration of Helsinki. This study was conducted with approval from the Ethics Committee. Written informed consent was obtained from all participants.
Inclusion Criteria
Patients with MHVR, aged 18 years or more, who were administered warfarin for the first time and achieved steady anticoagulation status, and who agreed to participate in the study by signing the written informed consent.
Exclusion Criteria
History of liver disease or serum transaminases levels 1.5-fold higher than normal, history of kidney disease, renal impairment, or serum creatinine >135 μmol/L, congestive heart failure (ejection fraction <40%, Class IV heart function), thyroid dysfunction, coagulation system disorders such as basic international normalized ratio (INR) values >1.3, cancer; pregnancy or breastfeeding period.
Data Collection
Demographics: Gender, age, height, and weight. Body surface area (BSA) (m2) = 0. 61 × height (m) + 0.0128 × body weight (kg) − 0.1529. Steady-state warfarin dose is the warfarin dose that could maintain the INR values within the target range for 3 consecutive times (the interval was not <7 days).
Determination of Genotypes
The polymerase chain reaction-restriction fragment length polymorphism method was used to detect patients’ CYP2C9*3 and VKORC1–1639G > A genotype.[11,12]
Standards of Anticoagulation
Low-intensity anticoagulation program: The expected INR values were 1.5–2.0 for aortic valve replacement (AVR), 1.7–2.3 for mitral valve replacement (MVR) and mitral and aortic double valve replacement (DVR), and about 2.5 for tricuspid valve replacement. The overall value was within 1.5–2.5.
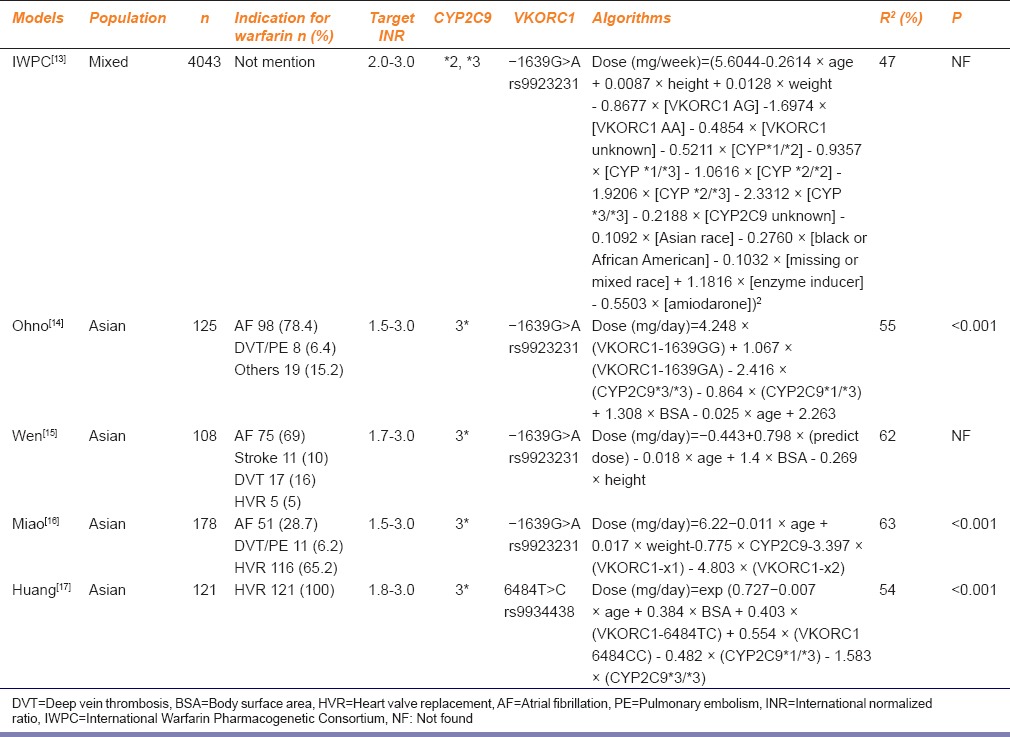
The Asian model algorithms, namely, Ohno, Wen, Miao, Huang, and International Warfarin Pharmacogenetic Consortium (IWPC) (for the mixed population) were reviewed. Specific situations are shown in Table 1.[13,14,15,16,17]
Table 1.
Basic information and prediction formula of five kinds of pharmacogenomics-based individualized warfarin dosing model
Factors Need to be Controlled
The factors that might affect the efficacies of warfarin were strictly controlled through educating the patients with medication-related knowledge (issuing-related educational materials, interpreted by pharmacists, and the educational results were verified) including diet and lifestyle guidance: Informing the patients to maintain a relative intake balance of Vitamin K-rich green vegetables, to avoid long-term drinking; grasping other coadministrated drugs, and during the dose adjustment period of warfarin, such drugs that might affect the liver drug enzymes, the INR values, and coagulation as rifampin and barbiturates should be avoided; avoiding the use of traditional Chinese medicine.
Model Validation
The patients’ information was input into the above models, which estimated the doses (expressed by weekly dose: mg/week), to evaluate the accuracy, clinical practicality, and safety of each model.
The accuracy of prediction was compared using three indicators: The mean absolute error (MAE), the mean relative error (MRE), and the coefficient of determination R2.[8,9] MAE is referred to as the average of the absolute values for the difference between the predicted dose and actual dose; MRE is referred to as the average of the relative values for the difference between the predicted dose and actual dose; correlation of determination R2 is referred to as the coefficient of determination obtained by analysis of relationship between the actual dose and predicted dose.
Absolute error = predicted dose − actual dose
Relative error = (predicted dose − Actual dose)/Actual dose × 100%
Clinical practicality
The patients were divided into groups according to the actual doses, namely, the low-dose (≤21 mg/week), middle-dose (21–49 mg/week), and high-dose (≥49 mg/week).[13] The proportion of patients in each group that showed the absolute error within −7 mg/week ~7 mg/week (ideal absolute error range),[18] as well as the relative error range between -20% to 20% (ideal relative error range), was compared.[10,13]
Clinical safety
The proportion of patients in each group with absolute error ≤−14 mg/week and relative error ≤−50% (severe underprediction) or absolute error ≥14 mg/week and relative error ≥100% (severe overprediction)[19] was used to evaluate the clinical safety.
Statistical Analysis
The SPSS 17.0 statistical software (Statistical Package for Social Sciences Statistics for Windows, Chicago, SPSS Inc.) was used for statistical analysis. The Spearman correlation analysis was used to compare the correlations between the predicted dose and the actual dose.
Results
Comparison of Mean Absolute Error and Mean Relative Error
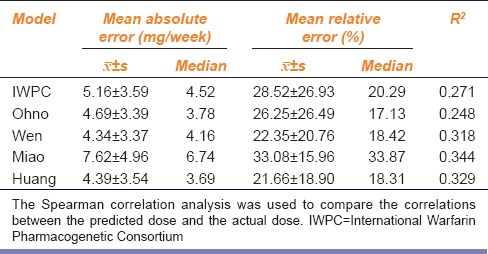
The results are shown in Table 2. MAEs of the Wen and Huang model were smaller (4.30 mg/week) than those of the other models, followed by the Ohno and IWPC model. The Miao model had the highest MAE, which was about 7.62 mg/week. The Huang and Wen models had the lowest MREs, which were about 22%, followed by the Ohno and IWPC model. The Miao model had the highest MRE (about 33.08%).
Table 2.
Comparison of mean absolute error, mean relative error, and correlation coefficient between the predicted dose and the actual dose of five pharmacogenomics-based individualized warfarin dosing model kinds of pharmacogenomics-based individualized warfarin dosing model
Correlation Analysis
The results of the correlation analysis of the actual doses and the predicted doses of the five models are shown in Table 2. The coefficient of determination R2 of the Miao model was the highest (0.344) followed by the Huang, Wen, and IWPC models, whereas that of the Ohno model was the smallest (0.248). The R2 values of the five models were lower than 0.5, indicating that the correlation between the predicted dose and the actual dose was not significant.
Comparison of Clinical Practicality
The absolute error was used to evaluate the predictive accuracy of all the models. As shown in Table 3, over 65% of dose predictions by all the models in the low-dose group were within the ideal dose range, among which the Huang model tended to predict warfarin doses most accurately (89%). Approximately, >70% of dose predictions by the IWPC, Ohno, Wen, and Huang models were within the ideal dose range in the middle-dose group, with the Miao model accounting for 17.59%, which seriously underestimated the actual doses of the patients.
Table 3.
Proportions of patients of different dose groups that showed the absolute errors and relative error between the predicted doses and the actual doses of five kinds of pharmacogenomics-based individualized warfarin dosing model
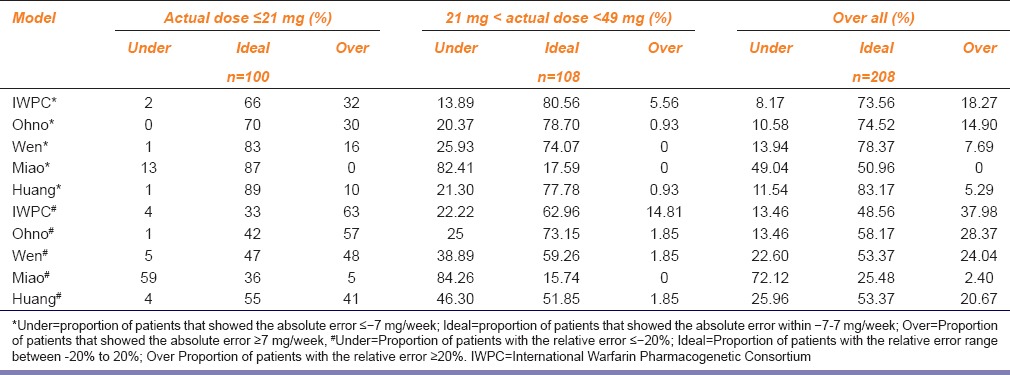
The relative error was set as the evaluation indicator, as shown in Table 3, in the low-dose group. The IWPC, Ohno, and Wen models tended to overestimate the warfarin doses in patients to varying degrees; the predicted dose by the Miao model was low (59% of people were underestimate), and only the Huang model exhibited better predictive ability (55% of people were within the ideal range). In the middle-dose group, four models, except for the Miao model, tended to predict the doses within the ideal dose range, with over 50% of predictions being accurate; 73.15% of dose predictions by the Ohno model were within the ideal dose range while that by the Miao model was 15.74%, which severely underestimated the actual doses of the patients. No patients were included in the high-dose group in this study.
Comparison of Clinical Safety
All the five models tended to underestimate warfarin doses in 0% of the patients in the low-dose group; hence, the five models predicted low risk of embolism in the low-dose group. As for the middle-dose group, the Miao model tended to markedly underestimate the warfarin doses in patients, with 29.63% and 22.22%, respectively, when considering relative error and absolute error. The proportion of patients in whom the warfarin doses were underestimated by the IWPC model was the smallest, which was 0% [Table 4].
Table 4.
Proportion of patients of five models among different dose groups that had the absolute error between the predicted dose and the actual dose ≤−14 mg/week* and the relative error between the predicted dose and the actual dose ≤−50%#
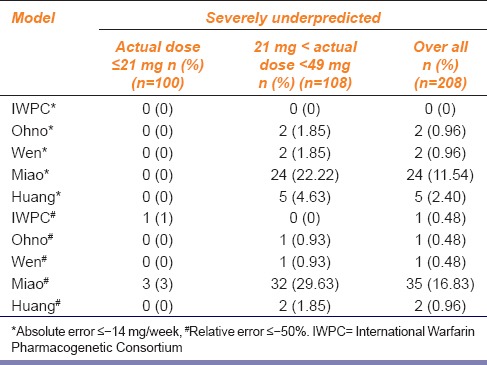
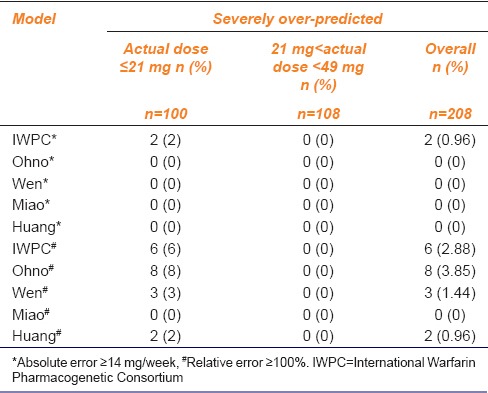
The results of two evaluation methods exhibited significant differences in overprediction for low-dose range evaluation. The proportion of patients predicted with absolute error ≥14 mg/week by all models was 0%, except for that by the IWPC model (2%); when compared the proportion of patients with relative error ≥100%, The order of overprediction by the models is Ohno > IWPC > Wen > Huang > Miao. In general, the Miao model exhibited the lowest risk of bleeding in both the evaluation methods. As for the middle-dose group, 0% dose predictions were overestimated by all the models regardless of the evaluation method; however, the bleeding risk was low. The specific conditions are outlined in Table 5.
Table 5.
Proportion of patients of five models among different dose groups that had the absolute error between the predicted dose and the actual dose ≤14 mg/week* and relative error between the predicted dose and the actual dose ≤100%#
Discussion
Accuracy of the Models
The Miao model had the highest MAE among the five models. Shin and Cao[8] compared the MAE of different models in Asians, and the results were consistent with those observed in this study. MAE of the Huang model was relatively small, consistent with Liu et al.[20] The MRE of the different models were in the order, Huang > Wen > Ohno > IWPC > Miao. Overall, the results of these two evaluation indicators were consistent.
The correlation analysis showed that the R2 values of the five models were in the order Miao > Huang > Wen > IWPC > Ohno. The application of this evaluation method was different from the other two, mainly because R2 could only be used to measure the linear relationship and concentration degree between the predicted dose and the actual dose; however, it could not reflect the closeness of these two parameters; therefore, this study only compared the R2 of each model study [Table 1] and the R2 of this study [Table 2] in the five models to explain individual differences of warfarin stable dose. All the five models exhibited the individual differences >45% in their respective study population; however, they were lower (<35%) in the population of this study, suggesting that the feasibilities of these five models toward the MHVR patients were poor, which might be owing to the different basic features of modeling populations. A study showed that treatment regimens differ for different races;[21] the warfarin sensitivity of Asians was significantly higher than that of Caucasians; thus, the warfarin dose required to achieve the same anticoagulant action would be lower in Asians. Since the main population studied by the IWPC model was Caucasians, the predicted dose should be higher, and R2 was found to be 27.1%. In contrast, the warfarin dose was related to the intake of Vitamin K.[22] Different races and regional eating habits influence the warfarin dose; hence, the R2 value in Japan's Ohno model was also low, only 24.8%, whereas the target population of the Wen, Miao, and Huang model were Chinese people, so the R2 values were similar. Meanwhile, except for the Huang and Miao model, the other three models mostly studied patients with atrial fibrillation and used the moderate-intensity anticoagulation standards (the target INR values were normally 2.0–3.0), whereas the subjects of this study included Chinese Han MHVR patients; this study used low-intensity anticoagulation standards (the target INR values were 1.5–2.5 value), which indirectly led to overestimation of doses by the three models relative to the actual stable maintenance doses.
Clinical Practicality
All the five models performed well in the low-dose prediction; however, comparison of relative error showed that, except for the Miao model, the other four models exhibited high relative errors to different degrees, especially the IWPC, Ohno, and Wen model. The low-dose group would most likely exhibit bleeding events caused by excessive anticoagulation; hence, the predicted doses obtained from these three models might be associated with increased bleeding risks. The two evaluation methods of the middle-dose group showed that except for the Miao model, the other four models performed well in predicting the patients’ warfarin doses. Shin and Cao[8] also found that the proportion of patients with the predicted dose within the ideal dose range was the highest in the middle dose range evaluation, which was consistent with the results of this study. The predicted dose by the Miao model was significantly low; hence, the risk of embolism was the highest. In addition, because Chinese Han population was susceptible to warfarin, the dose required was much lower than that required for Caucasians, which explains why no patients were included in the high-dose group.
Clinical Safety
The results of the two evaluation methods were similar, and the five models performed better in the low-dose range evaluations when considering clinical safety. In the middle-dose range evaluation, the Miao model tended to markedly underestimate the warfarin doses in many patients; therefore, the predicted dose was markedly lower than the actual dose, and the risk of embolism was the highest. In addition, evaluation of the predicted doses by the models showed that the Miao model did not markedly overestimate doses (0%) in the low-dose group; hence, the risk of bleeding was low. As for the middle-dose range evaluation, 0% of the predicted doses by the five models were severely overestimated, and the risk of bleeding was low. In addition, the IWPC model tended to overestimate warfarin doses in only 2.88% of the patients, a proportion relatively lower than that obtained by Shaw et al. (7%),[19] indicating that the IWPC model used in this study performed safer than Shaw’s.
Impacts of Nongenetic Factors on the Stable Maintenance Dose of Warfarin
Among the nongenetic factors that would affect the individual warfarin dosages, we selected eight factors, namely, gender, age, BSA, smoking, drinking, hypertension accompanying, and valve replacement surgery, to analyze their impacts on the stable maintenance dose of warfarin, and the results revealed that the valve replacement type, age, and BSA exhibited significant correlations with the stable maintenance dose of warfarin (P < 0.05).
As for the patients with different valve replacement surgeries, different target INR values might affect the stable maintenance dose of warfarin to a certain extent. Our correlation analysis showed the comparison results of the stable maintenance doses of warfarin among the patients with four types of valve replacement surgeries were TVP > MVR > DVR > AVR, and the differences were significant (P = 0.001). However, the parameters in the five included models did not include the valve type, which might because it was not included in the influencing factors when establishing the models, or because its impacts had no statistical significance. In addition, because the valve replacement types toward the patients included in this study were mainly MVR or DVR (76.9%), and during regulating the doses, INR was more controlled within 1.7–2.3 to guarantee one stable INR fluctuation in the patients. Therefore, it could be considered that the valve replacement type had certain impacts on the steady dose, but during the process of verifying the five models that all did not include this factor, the impacts could be ignored. Our future researches targeting to establish suitable models for the populations with heart valve diseases would consider the valve replacement type as a factor so as to maximize the predictive abilities of the models.
Age and BSA had certain contributions to the dose prediction in the relevant models. Their impacts on warfarin doses might be caused by aging-induced liver function reduction, so the abilities of synthesizing clotting factors II, VII, IX, VII, IX, and X were diminished; in addition, aging caused the decreasing of liver cells and liver blood flow, so the content and activity of hepatic cytochrome P450 enzyme were gradually declined, leading to the metabolic clearance rate of warfarin to be reduced. These were the reasons that the warfarin dose was reduced in the elderly patients; furthermore, the plasma drug concentration is related with the blood volume, and only the surface area is linearly related with the blood volume inside human bodies, so the BSA is also associated with the drug dose.
Limitations of this Study
This study also had several limitations. First, the sample size included in this study was still small, and among the 208 patients, only 16 were with CYP2C9*1/*3 (7.7%), and no CYP2C9*3/*3 patient was included; only 32 were with VKORC1–1639 AG (15.38%), and no patient with mutated homozygote was included. Therefore, there might have certain deviations when comparing the stable doses among the patients with different genotypes. Second, the factors included in different models varied, thus existing certain prediction errors. Finally, this study was only a retrospective validation study, and only the safeties and clinical feasibilities of five models were evaluated, so it could not explain the benefits of the pharmacogenomics-based model; therefore, our research group would establish the local patient model in our future studies and carry out prospective case–control studies so as to explain the contributions of genetic testing toward these patients.
Conclusions
Although different studies adopted different evaluation methods, the overall outcomes were more consistent; the Huang model was relatively better in predicting the initial dose for the patients in this region. While there was no absolute “winner” among these models, the Huang model should be considered while screening for the most appropriate model for the patients of this region, to achieve intended benefits.
Financial Support and Sponsorship
Nil.
Conflicts of Interest
There are no conflicts of interest.
Acknowledgment
This study was conducted in accordance with the Declaration of Helsinki. This study was conducted with approval from the Ethics Committee of Fuzhou General Hospital of Nanjing Command, PLA. Written informed consent was obtained from all participants.
References
- 1.Meijer K, Kim YK, Schulman S. Decreasing warfarin sensitivity during the first three months after heart valve surgery: Implications for dosing. Thromb Res. 2010;125:224–9. doi: 10.1016/j.thromres.2009.02.012. [DOI] [PubMed] [Google Scholar]
- 2.Liu Y, Zhong SL, Tan HH, Yang M, Fei HW, Yu XY, et al. Impact of CYP2C9 and VKORC1 polymorphism on warfarin response during initiation of therapy. Zhonghua Xin Xue Guan Bing Za Zhi. 2011;39:929–35. [PubMed] [Google Scholar]
- 3.Verhoef TI, Redekop WK, Buikema MM, Schalekamp T, Van Der Meer FJ, Le Cessie S, et al. Long-term anticoagulant effects of the CYP2C9 and VKORC1 genotypes in acenocoumarol users. J Thromb Haemost. 2012;10:606–14. doi: 10.1111/j.1538-7836.2012.04633.x. [DOI] [PubMed] [Google Scholar]
- 4.Krishna Kumar D, Shewade DG, Loriot MA, Beaune P, Balachander J, Sai Chandran BV, et al. Effect of CYP2C9, VKORC1, CYP4F2 and GGCX genetic variants on warfarin maintenance dose and explicating a new pharmacogenetic algorithm in South Indian population. Eur J Clin Pharmacol. 2014;70:47–56. doi: 10.1007/s00228-013-1581-x. [DOI] [PubMed] [Google Scholar]
- 5.Anthony M, Romero K, Malone DC, Hines LE, Higgins L, Woosley RL. Warfarin interactions with substances listed in drug information compendia and in the fda-approved label for warfarin sodium. Clin Pharmacol Ther. 2009;86:425–9. doi: 10.1038/clpt.2009.95. [DOI] [PubMed] [Google Scholar]
- 6.Wang M, Lang X, Cui S, Fei K, Zou L, Cao J, et al. Clinical application of pharmacogenetic-based warfarin-dosing algorithm in patients of Han Nationality after rheumatic valve replacement: A randomized and controlled trial. Int J Med Sci. 2012;9:472–9. doi: 10.7150/ijms.4637. [DOI] [PMC free article] [PubMed] [Google Scholar]
- 7.Pirmohamed M, Burnside G, Eriksson N, Jorgensen AL, Toh CH, Nicholson T, et al. Arandomized trial of genotype-guided dosing of warfarin. N Engl J Med. 2013;369:2294–303. doi: 10.1056/NEJMoa1311386. [DOI] [PubMed] [Google Scholar]
- 8.Shin J, Cao D. Comparison of warfarin pharmacogenetic dosing algorithms in a racially diverse large cohort. Pharmacogenomics. 2011;12:125–34. doi: 10.2217/pgs.10.168. [DOI] [PubMed] [Google Scholar]
- 9.Tan GM, Wu E, Lam YY, Yan BP. Role of warfarin pharmacogenetic testing in clinical practice. Pharmacogenomics. 2010;11:439–48. doi: 10.2217/pgs.10.8. [DOI] [PubMed] [Google Scholar]
- 10.Roper N, Storer B, Bona R, Fang M. Validation and comparison of pharmacogenetics-based warfarin dosing algorithms for application of pharmacogenetic testing. J Mol Diagn. 2010;12:283–91. doi: 10.2353/jmoldx.2010.090110. [DOI] [PMC free article] [PubMed] [Google Scholar]
- 11.Wang SL, Huang J, Lai MD, Tsai JJ. Detection of CYP2C9 polymorphism based on the polymerase chain reaction in Chinese. Pharmacogenetics. 1995;5:37–42. doi: 10.1097/00008571-199502000-00004. [DOI] [PubMed] [Google Scholar]
- 12.Sconce EA, Khan TI, Wynne HA, Avery P, Monkhouse L, King BP, et al. The impact of CYP2C9 and VKORC1 genetic polymorphism and patient characteristics upon warfarin dose requirements: Proposal for a new dosing regimen. Blood. 2005;106:2329–33. doi: 10.1182/blood-2005-03-1108. [DOI] [PubMed] [Google Scholar]
- 13.Klein TE, Altman RB, Eriksson N, Gage BF, Kimmel SE, et al. International Warfarin Pharmacogenetics Consortium. Estimation of the warfarin dose with clinical and pharmacogenetic data. N Engl J Med. 2009;360:753–64. doi: 10.1056/NEJMoa0809329. [DOI] [PMC free article] [PubMed] [Google Scholar]
- 14.Ohno M, Yamamoto A, Ono A, Miura G, Funamoto M, Takemoto Y, et al. Influence of clinical and genetic factors on warfarin dose requirements among Japanese patients. Eur J Clin Pharmacol. 2009;65:1097–103. doi: 10.1007/s00228-009-0685-9. [DOI] [PubMed] [Google Scholar]
- 15.Wen MS, Lee M, Chen JJ, Chuang HP, Lu LS, Chen CH, et al. Prospective study of warfarin dosage requirements based on CYP2C9 and VKORC1 genotypes. Clin Pharmacol Ther. 2008;84:83–9. doi: 10.1038/sj.clpt.6100453. [DOI] [PubMed] [Google Scholar]
- 16.Miao L, Yang J, Huang C, Shen Z. Contribution of age, body weight, and CYP2C9 and VKORC1 genotype to the anticoagulant response to warfarin: Proposal for a new dosing regimen in Chinese patients. Eur J Clin Pharmacol. 2007;63:1135–41. doi: 10.1007/s00228-007-0381-6. [DOI] [PubMed] [Google Scholar]
- 17.Huang SW, Chen HS, Wang XQ, Huang L, Xu DL, Hu XJ, et al. Validation of VKORC1 and CYP2C9 genotypes on interindividual warfarin maintenance dose: A prospective study in Chinese patients. Pharmacogenet Genomics. 2009;19:226–34. doi: 10.1097/FPC.0b013e328326e0c7. [DOI] [PubMed] [Google Scholar]
- 18.Moreau C, Pautas E, Gouin-Thibault I, Golmard JL, Mahé I, Mulot C, et al. Predicting the warfarin maintenance dose in elderly inpatients at treatment initiation: Accuracy of dosing algorithms incorporating or not VKORC1/CYP2C9 genotypes. J Thromb Haemost. 2011;9:711–8. doi: 10.1111/j.1538-7836.2011.04213.x. [DOI] [PubMed] [Google Scholar]
- 19.Shaw PB, Donovan JL, Tran MT, Lemon SC, Burgwinkle P, Gore J. Accuracy assessment of pharmacogenetically predictive warfarin dosing algorithms in patients of an academic medical center anticoagulation clinic. J Thromb Thrombolysis. 2010;30:220–5. doi: 10.1007/s11239-010-0459-3. [DOI] [PubMed] [Google Scholar]
- 20.Liu Y, Yang J, Xu Q, Xu B, Gao L, Zhang Y, et al. Comparative performance of warfarin pharmacogenetic algorithms in Chinese patients. Thromb Res. 2012;130:435–40. doi: 10.1016/j.thromres.2012.02.003. [DOI] [PubMed] [Google Scholar]
- 21.Jeong YH. East Asian paradox: Challenge for the current antiplatelet strategy of one-guideline-fits-all races in acute coronary syndrome. Curr Cardiol Rep. 2014;16:485. doi: 10.1007/s11886-014-0485-4. [DOI] [PubMed] [Google Scholar]
- 22.Rasmussen MA, Skov J, Bladbjerg EM, Sidelmann JJ, Vamosi M, Jespersen J. Multivariate analysis of the relation between diet and warfarin dose. Eur J Clin Pharmacol. 2012;68:321–8. doi: 10.1007/s00228-011-1123-3. [DOI] [PubMed] [Google Scholar]


