Abstract
Aims
To determine the causative role of the REDD (regulated in development and DNA damage)-1 protein, a known negative regulator of mTOR kinase, in changes in muscle protein synthesis induced by acute alcohol administration.
Methods
Adult female REDD1−/− or wild-type (WT) mice were injected IP with ethanol (alcohol; 3 g/kg BW) or saline and the skeletal muscle was removed 1 h later. In vivo protein synthesis was assessed as were selected endpoints related to the activation of mTOR and protein degradation.
Results
Acute alcohol decreased muscle protein synthesis similarly in WT and REDD1−/− mice. In contrast, mTORC1 signaling was largely unaffected by either EtOH or genotype as evidenced by the lack of change in the phosphorylation of its downstream targets, S6K1 T389 and 4E-BP1 S65. Although alcohol decreased p62 and ULK1 S757 protein in muscle from WT and REDD1−/− mice, there was no change in LC3B lipidation, or beclin1, Atg7 and Atg12 protein suggesting no change in autophagy. MuRF1 and atrogin-1 mRNAs were elevated in alcohol-treated REDD1−/− mice compared with WT mice suggesting activation of the ubiquitin proteasome activity. While there was no genotype or alcohol effect on plasma corticosterone, REDD1−/− mice failed to demonstrate the alcohol-induced hyperinsulinemia seen in WT mice.
Conclusion
REDD1 does not appear to play a role in the acute alcohol-mediated decrease in protein synthesis or mTOR activity, but may contribute to the regulation of ubiquitin-proteasome mediated protein breakdown.
INTRODUCTION
Skeletal muscle myopathy is a recognized consequence of the prolonged intake of high levels of alcohol and can occur independent of liver disease and other associated co-morbidities (Preedy et al., 2003). As the maintenance of skeletal muscle mass and strength is linked to decreased mortality, and the loss of muscle mass is detrimental to health especially during disease, a more complete understanding of the mechanisms by which alcohol causes myopathy are important (Rantanen et al., 2012). Muscle loss results from an imbalance between rates of protein synthesis and degradation, with breakdown outpacing synthesis. While acute alcohol intoxication can produce rhabdomyolysis, it does not result in loss of muscle mass per se because of its short duration (Haller and Knochel, 1984). However, the acute administration of alcohol does recapitulate molecular changes observed following chronic intake and is therefore a useful model system to study the consequences of alcohol on skeletal muscle (Steiner and Lang, 2015b). Moreover, the incidence of binge drinking appears to be rising and may result in muscle wasting when sustained over time (Centers for Disease Control and Prevention, 2012).
While protein synthesis is regulated by several factors, the mammalian target of rapamycin protein complex 1 (mTORC1) predominates (Ge and Chen, 2012) and a schematic of this pathway is presented in Fig. 1. Signals from several metabolic processes including those resulting from changes in energy status [e.g., AMP-activated protein kinase (AMPK); regulated in development and DNA damage-1 (REDD1)] and the presence or absence of growth factors [insulin; insulin-like growth factor (IGF)-I] converge at mTORC1 to ultimately modulate the rate of protein synthesis. For example, activation of the IGF-I receptor initiates the PI3K signaling cascade resulting in Akt phosphorylation at T308 by phosphoinositide-dependent kinase-1 (PDK1) and S473 by mTORC2 (Guertin et al., 2006). Akt can then stimulate mTOR activity via phosphorylation and inhibition of tuberous sclerosis complex 1/2 (TSC1/2) leading to Rheb-GTP loading (Inoki et al., 2002). Rheb-GTP subsequently binds to and activates mTORC1 (Avruch et al., 2009). Activation of mTORC1 leads to phosphorylation of ribosomal protein S6 kinase-1 (S6K1) and eukaryotic initiation factor 4E-binding protein-1 (4E-BP1) which increases translation initiation (Hanrahan and Blenis, 2006). In rats, both acute and chronic alcohol intake impair phosphorylation of several proteins within the mTORC1 pathway and decrease the rate of synthesis within skeletal muscle (Steiner and Lang, 2015b), a response similar to that seen in humans (Pacy et al., 1991).
Fig. 1.
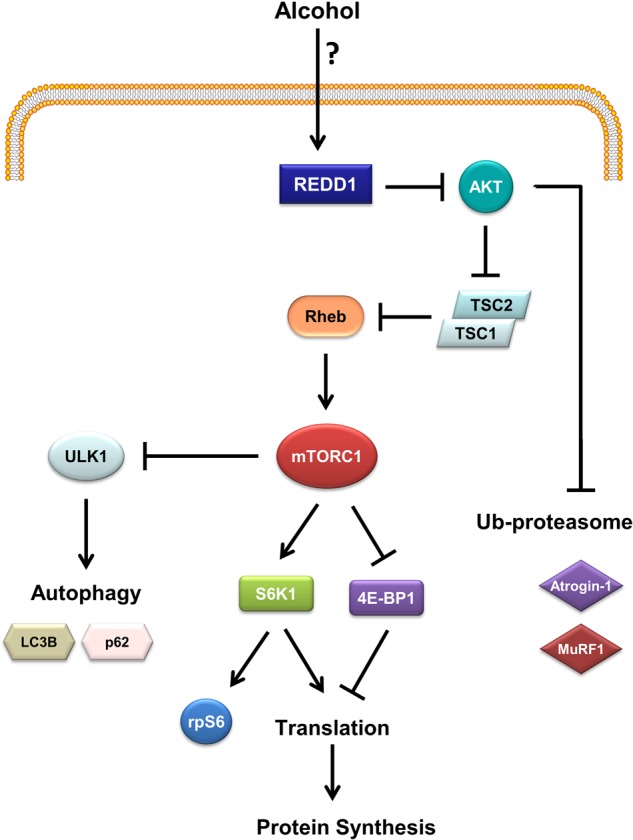
Model for the role of REDD1 in the regulating muscle protein balance in response to acute alcohol. In the present study, we tested the hypothesis that alcohol, similar to other metabolic stressors, inhibits mTOR kinase activity, mRNA translation and protein synthesis via increases in REDD1. Such increases either directly or indirectly also may modulate protein degradation by regulating autophagy (via ULK1) and/or the ubiquitin-proteasome pathway (via atrogenes). Abbreviations used include: REDD1, regulated in development and DNA damage responses 1; TSC, tuberous sclerosis complex; Rheb, Ras homolog enriched in brain; S6K1, ribosomal protein S6 kinase-1; rpS6, ribosomal protein S6; 4E-BP1, eukaryotic protein initiation factor 4E binding protein-1; ULK-1, Unc-51 like autophagy activating kinase-1; AKT/PKB, protein kinase B.
REDD1 is a negative regulator of mTORC1 that is transcriptionally upregulated by cellular stress and catabolic illness including acute alcohol administration, glucocorticoids, starvation, AMPK activation, sepsis, DNA damage, hypoxia and reactive oxygen species (Ellisen et al., 2002; Brugarolas et al., 2004; Lang et al., 2008; McGhee et al., 2009). The mechanism by which REDD1 suppresses mTORC1 has not been fully elucidated, although it has been proposed that a REDD1-induced increase in PP2A-mediated dephosphorylation of Akt T308 decreases TSC2 phosphorylation, enhances Rheb-GTPase activity (i.e., increased Rheb-GDP loading) and thereby inhibits mTORC1 activity (Dennis et al., 2014). We have previously reported that REDD1 mRNA and protein are both increased in skeletal muscle by acute alcohol in male and female rats (Lang et al., 2008). However, the impact of this increase on directing the concomitant reduction in mTORC1 signaling and protein synthesis observed following acute alcohol is unknown. To address this question, mice with a global deletion of REDD1 were used to test the hypothesis that lack of REDD1 would prevent or ameliorate the alcohol-induced inhibition of protein synthesis in association with maintenance of mTORC1 signaling.
METHODS
Animals
Female 9–11 week old wild-type (WT; B6/129F1) or REDD1 knockout (REDD1−/−) mice were used and average body weights provided in the Results. REDD1−/− mice were generated by Lexicon Genetics (The Woodlands, TX, USA) specifically for Quark Pharmaceuticals, Fremont, CA, USA (Brafman et al., 2004). The REDD1−/− mice (and WT littermates) were bred in the Penn State College of Medicine animal facility. All mice were housed in shoe-box cages with corn cob bedding under controlled environmental conditions (12:12 light:dark; 22–24°C), and were provided Teklad Global no. 8604 diet (Harlan Teklad, Boston, MA, USA) and water ad libitum until the start of the experiment.
The current study did not control for the stage of estrous. While ovariectomy with and without replacement of estradiol and progesterone has demonstrated ovarian hormones can regulate skeletal muscle protein synthesis in rodents (Toth et al., 2001), to our knowledge there are no data that directly address the effect of endogenous cycling of ovarian hormones on muscle protein synthesis. However, no difference in muscle protein synthesis was reported between women in the follicular and luteal stage of the menstrual cycle (Miller et al., 2006). Hence, while this random assignment of female mice regardless of stage of estrous makes the current study less well controlled, it is also more physiologically relevant.
All experimental procedures were performed in accordance with the National Institutes of Health guidelines for the use of experimental animals and were approved by the Institutional Animal Care and Use Committee of Penn State College of Medicine.
Alcohol protocols
WT and REDD1−/− mice were randomly assigned to receive either alcohol (EtOH) or saline (Con) (WT-Con, n = 10; WT-EtOH, n = 15; REDD1−/−-Con, n = 18; REDD1−/−-EtOH, n = 20). Mice were administered alcohol (i.e., ethanol) at a dose of 3 g/kg or given an equal volume of 0.9% sterile saline (Control) via intraperitoneal (IP) injection (Steiner and Lang, 2014). While injection of alcohol does provide a nominal increase in caloric content, compared to saline, WT and REDD1−/− mice both received the same dose of alcohol. As acute alcohol injection decreases muscle protein synthesis (Steiner and Lang, 2014), the difference in total caloric intake between control and alcohol-treated mice is preferable to injecting an isocaloric substance (e.g., maltodextrin) which might alter insulin levels and secondarily increase muscle protein synthesis. One hour thereafter the gastrocnemius and plantaris muscles were excised and all subsequent analysis was performed on a representative sample of this entire complex. Experiments were performed between 08:00 (end of dark cycle) and 11:00 with animals allowed ab libitum access to food and water. The majority of prior investigations have used animals fasted overnight or fasted for several hours immediately prior to acute alcohol administration. Fasting was avoided in the present experiment as it increases REDD1, reduces mTOR activity and diminishes phosphorylation of S6K1 and 4E-BP1 which could potentially mask further alcohol-induced decreases (McGhee et al., 2009; Gordon et al., 2015). Therefore, it was assumed and later confirmed that WT and REDD1−/− mice consume the majority of their food during the dark cycle and were therefore in a post-absorptive state at the time of the experiment. Similar rates of alcohol absorption and clearance, based on blood alcohol concentrations (BAC), are seen in rodents administered alcohol via either IP injection or via oral gavage (Chen et al., 2013). The experimental time point was specifically chosen to correspond with the peak BAC which was shown to occur at 1 h post-IP injection in mice (Livy et al., 2003).
A separate group of WT and REDD1−/− female mice (n = 8/genotype) were used to assess food consumption during the light and dark cycle after a 1-week period of acclimation. Food consumption was determined in a blinded manner at the end of the light and dark cycle (08:00 and 20:00) for 4 consecutive days and the average is reported.
Protein synthesis
Mice were injected with L-[2,3,4,5,6-3H]phenylalanine [Phe; 150 mM, 30 µCi/ml; 0.5 ml] 15 min prior to tissue collection (45 min post EtOH intoxication). Mice were then anesthetized with isoflurane (3% in oxygen; Butler Schein Animal Health, Dublin, OH, USA) and blood was collected in heparinized syringes from the vena cava for measurement of plasma Phe concentration and radioactivity. The entire gastrocnemius/plantaris muscle complex from one leg was excised, homogenized, and used to assess the global rate of [3H]Phe incorporation into protein within muscle exactly as described (Vary and Lang, 2008).
Plasma alcohol and hormone concentrations
The plasma alcohol concentration was determined in all samples using a rapid analyzer (Analox Instruments, Lunenburg, MA, USA). Plasma concentrations of corticosterone and insulin were determined by ELISA (ALPCO, Salem, NH, USA).
Western blotting
Fresh muscle (gastrocnemius/plantaris complex; ∼50–90 mg) from the contralateral limb was homogenized in 10 volumes of ice cold buffer consisting of (in mmol/l): 50 HEPES, 0.1% Triton-X, 4 EGTA, 10 EDTA, 15 sodium pyrophosphate, 100 β-Glycerophosphate, 25 sodium fluoride, 5 sodium orthovanadate and Protease Inhibitor cocktail 10 µl/ml (P8340, Sigma Aldrich, St Louis, MO, USA). Protein concentration was quantified using the Bio-Rad Protein Assay Dye reagent (Hercules, CA, USA) and SDS-PAGE was carried out using equal amounts of total protein per sample loaded onto 4–20% gradient gels (Biorad, Hercules, CA, USA). Following washes in TBST, membranes were blocked in 5% nonfat milk, and primary antibody was added for overnight incubation at 4°C. Antibodies included (Cell Signaling, Beverly, MA, USA, unless otherwise noted): REDD1 (ProteinTech, Chicago, IL, USA), S6K1, S6K1 phospho-T389, ribosomal protein S6 (rpS6), rpS6 phospho-S240/244, tuberous sclerosis complex 2 (TSC2), TSC2 phospho-S939, Unc-51 Like Autophagy Activating Kinase 1 (ULK1), ULK1 phospho-S757, p62, light chain-3B (LC3B), Atg12, Atg7, Akt, phospho-Akt S473 and phospho-T308, mTOR phospho-S2481, mTOR, 4E-BP1 phospho-S65, and 4E-BP1. A FluorChem M Multifluor System (ProteinSimple, San Jose, CA, USA) was used for visualization following exposure to ECL reagent (Thermo Scientific, Waltham, MA, USA). Images were analyzed using AlphaView (ProteinSimple) and ImageJ software (NIH, Bethesda, MD, USA).
Muscle mRNA content
Total RNA was extracted using Tri-reagent (Molecular Research Center, Cincinnati, OH, USA) and RNeasy mini kit (Qiagen, Valencia, CA, USA) following the manufacturers’ protocols. Fresh muscle (∼50–90 mg of gastrocnemius/plantaris) was homogenized in Tri-reagent after chloroform extraction. An equal volume of 70% ethanol was added to the aqueous phase, and the mixture was loaded on a Qiagen mini spin column. The Qiagen mini kit protocol was followed from this step onward, including the on-column DNase I treatment to remove residual DNA contamination. RNA was eluted from the column with RNase-free water and an aliquot was used for quantitation (NanoDrop 2000, Thermo Fisher Scientific, Waltham, MA, USA). The quality of the RNA was analyzed on a 1% agarose gel. Total RNA was reverse transcribed using superscript III RT (Invitrogen, Carlsbad, CA, USA) following the manufacturer's instructions. Real-time quantitative PCR was performed with the reverse transcription reaction in a QuantStudio™ 12K Flex Real-Time PCR System using TaqMan gene expression assays (Applied Biosystems, Foster City, CA, USA) for atrogin 1 (F-box protein 32) NM_026346.2, muscle RING-finger 1 (MuRF1) NM_001039048.2; IGF-I Mn01233690_m1; REDD1 Mm00512504_g1; and ribosomal protein L32 (Rpl32) Mm02528467_g1. The comparative quantification method 2−ΔΔCq was used in presenting gene expression of target genes in reference to the endogenous control.
Statistical analysis
Data were analyzed on commercial statistic software (SigmaPlot, Systat, San Jose, CA, USA) using a two-way ANOVA (genotype × alcohol) with Student-Newman-Keuls post hoc test when appropriate. Data are presented as mean ± SE and considered significant when P < 0.05.
RESULTS
An initial study indicated there was no effect of genotype on food consumption during the dark phase between WT (2.74 ± 0.13 Kcal/12 h/10 g body weight) and REDD1−/− (2.64 ± 0.16 Kcal/12 h/10 g) mice, or during the light phase (WT = 1.42 ± 0.09 Kcal/12 h/10 g; REDD1−/− = 1.49 ± 0.11 Kcal/12 h/10 g). On average, both groups consumed 66% of total calories during the dark phase and the remaining calories during the light phase. These data suggest little overt difference in the feeding behavior between WT and REDD1−/− mice.
Body weight did not differ among the four groups at the time of sacrifice (Table 1). Also, the BAC determined 1 h after acute alcohol administration did not differ between WT and REDD1−/− mice (Table 1). This is equivalent to ∼267 mg/dl (0.27%) and is similar to levels we have previously reported in male mice using a comparable protocol (Steiner and Lang, 2014).
Table 1.
Body weight, and blood alcohol, corticosterone and insulin concentrations
| Control |
Alcohol |
|||
|---|---|---|---|---|
| WT | REDD1−/− | WT | REDD1−/− | |
| Body weight, g | 21.5 ± 0.7 | 20.9 ± 0.3 | 21.7 ± 0.4 | 21.2 ± 0.3 |
| Blood alcohol, mmol/l | ND | ND | 59 ± 4 | 59 ± 7 |
| Corticosterone, ng/ml | 88 ± 5 | 92 ± 11 | 95 ± 6 | 94 ± 9 |
| Insulin, ng/ml | 0.74 ± 0.11a | 0.54 ± 0.07a | 2.81 ± 0.39b | 0.69 ± 0.05a |
Values are means ± SE; where n = 10, 18, 15 and 20, respectively. ND signifies below detection of the analyzer. Values with different superscript letters (a,b) are statistically different (P < 0.05).
Changes in circulating concentrations of catabolic and anabolic hormones can also impact REDD1 expression and/or protein synthesis. For example, alcohol can increase circulating glucocorticoids, a major stress hormone, which may indirectly regulate REDD1 and mTOR. However, the plasma corticosterone concentration did not differ statistically among the four groups (Table 1). Conversely, if deletion of REDD1 alters the plasma concentration of insulin, a major anabolic hormone, this might indirectly regulate protein balance. The insulin concentration in WT-alcohol mice was 3.5-fold higher than in WT-control mice (Table 1); however, this alcohol-induced increase was absent in REDD1−/−- alcohol-treated mice.
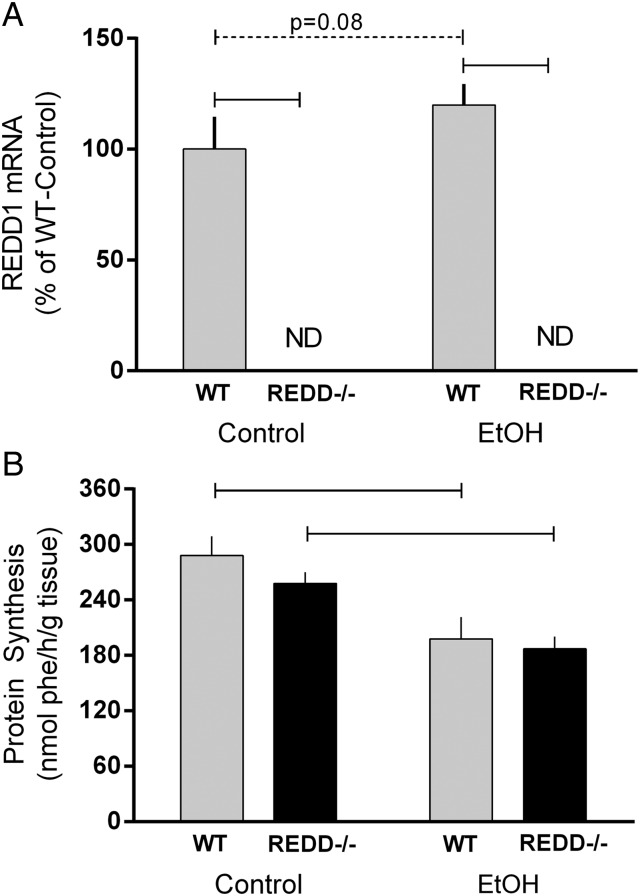
Expression of REDD1 within the muscle was first assessed to confirm all mice were of the appropriate genotype. As illustrated in Fig. 2, the REDD1 gene (aka DDIT4) was not detected in the muscle from REDD1−/− mice (Fig. 2A). A trend for an increase in REDD1 mRNA expression was detected in WT mice treated with alcohol (P = 0.08).
Fig. 2.
REDD1 mRNA expression and in vivo-determined protein synthesis in muscle from wild-type (WT) mice and REDD1−/− mice. Horizontal bars indicate statistical differences between groups (P < 0.05). ND signifies that REDD1 mRNA was not detected in REDD1−/− animals. Dashed line indicates a trend for differences and the corresponding P-value is listed. WT-Con, n = 10; WT-EtOH, n = 15; REDD1−/−-Con, n = 18; REDD1−/−-EtOH, n = 20. Values are expressed as means ± SE.
No effect of genotype was observed for the rate of protein synthesis in muscle under control conditions. Alcohol decreased muscle protein synthesis ∼30% in WT mice and ∼20% in REDD1−/− mice so values in alcohol-treated WT and REDD1−/− mice did not differ (Fig. 2B).
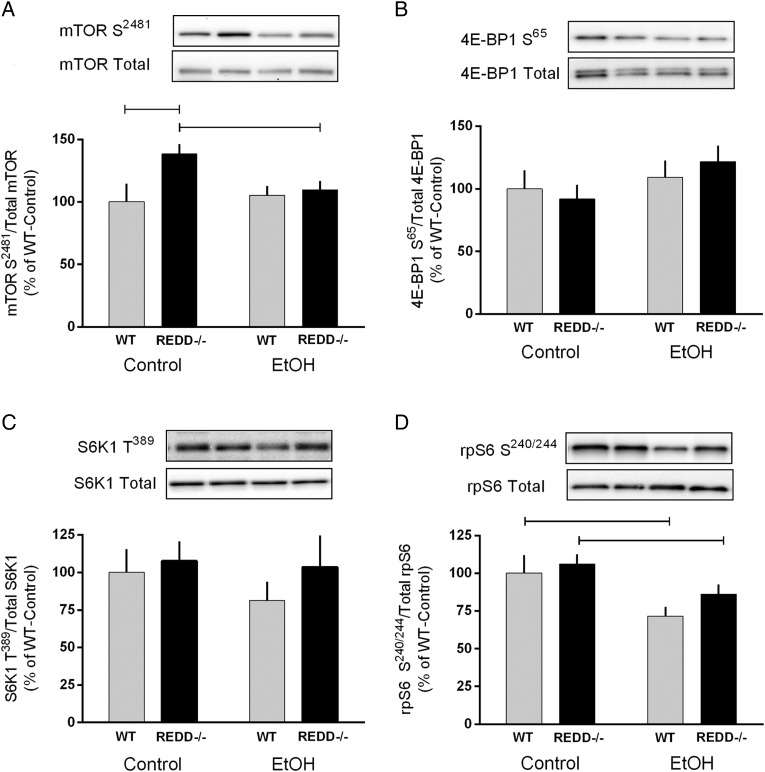
Elimination of the REDD1 gene increased the phosphorylation of mTOR on both S2481 and S2448 in control mice (compared with WT) (Fig. 3A and data not shown, respectively). No change in the phosphorylation of these sites was detected after alcohol in WT mice; however, phosphorylation of mTOR S2481 was reduced by alcohol in REDD1−/− mice. Phosphorylation of S6K1 T389 and 4E-BP1 S65 and T37/46 did not differ between genotypes and was not altered by alcohol (Fig. 3B and C and data not shown). In contrast, phosphorylation of rpS6 S240/244, an S6K1 substrate, was decreased in WT alcohol-treated mice but not REDD1−/− mice (Fig. 3D).
Fig. 3.
Phosphorylation of mTOR and its substrates was measured in response to acute alcohol intoxication in wild-type (WT) and REDD1−/− mice. Bar graphs represent the quantification of western blot images for phosphorylated proteins relative to the total amount of the respective protein for mTOR S2481(A), 4E-BP1 S65 (B), S6K1 T389 (C) and rpS6 S240/244 (D). Gray bars represent WT mice and black bars correspond to REDD1−/− mice. Lanes shown in the representative image correspond to the order in the graph. All values are expressed relative to Control-WT which was set to 100%. Horizontal bars indicate statistical differences between groups (P < 0.05). WT-Con, n = 10; WT-EtOH, n = 15; REDD1−/−-Con, n = 18; REDD1−/−-EtOH, n = 20. Values are expressed as means ± SE.
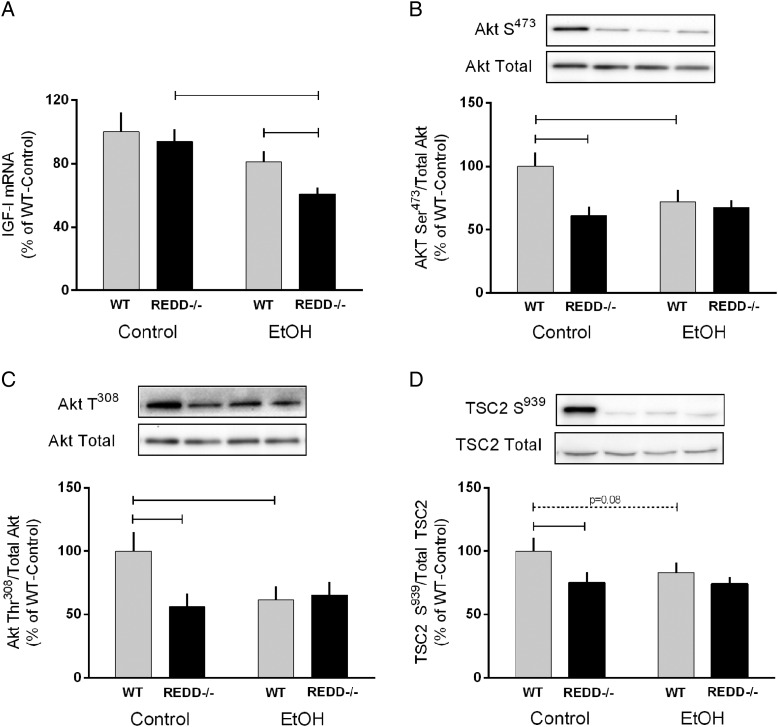
Previous in vitro data highlighted a role for Akt signaling in the regulation of mTOR by REDD1 (Dennis et al., 2014). While IGF-I mRNA content did not differ between the genotypes under basal conditions, alcohol reduced expression in REDD1−/− mice by 33% resulting in levels lower than those observed in WT-EtOH mice (Fig. 4A). A trend (P = 0.1) for a decrease in IGF-I mRNA expression (20%) with alcohol was also observed in WT mice. Phosphorylation of Akt on its regulatory sites T308 and S473 was lower in REDD1−/− mice compared with WT mice under control conditions (Fig. 4B and C). WT mice showed a significant reduction in Akt phosphorylation at each site after acute alcohol but this alcohol-induced decrease was not evident in REDD1−/− mice. Lastly, a main effect of genotype was detected for the phosphorylation of TSC2 on S939, including a decrease under basal conditions in REDD1−/− mice (Fig. 4D).
Fig. 4.
Disruption of the REDD1 gene reduced Akt and TSC2 phosphorylation independent of alcohol intoxication. IGF-I mRNA is shown in (A) while the remaining bar graphs correspond to the quantification of western blot images for the phosphorylated and total amount of Akt S473(B), Akt T308 (C), and TSC2 S939 (D). Gray bars represent wild-type (WT) mice and black bars correspond to REDD1−/− mice. Lanes shown in the representative image correspond to the order in the graph. All values are expressed relative to Control-WT which was set to 100%. Horizontal bars indicate statistical differences between groups (P < 0.05) and dashed line indicate a trend for differences with the corresponding P-value listed above. WT-Con, n = 10; WT-EtOH, n = 15; REDD1−/−-Con, n = 18; REDD1−/−-EtOH, n = 20. Values are expressed as means ± SE.
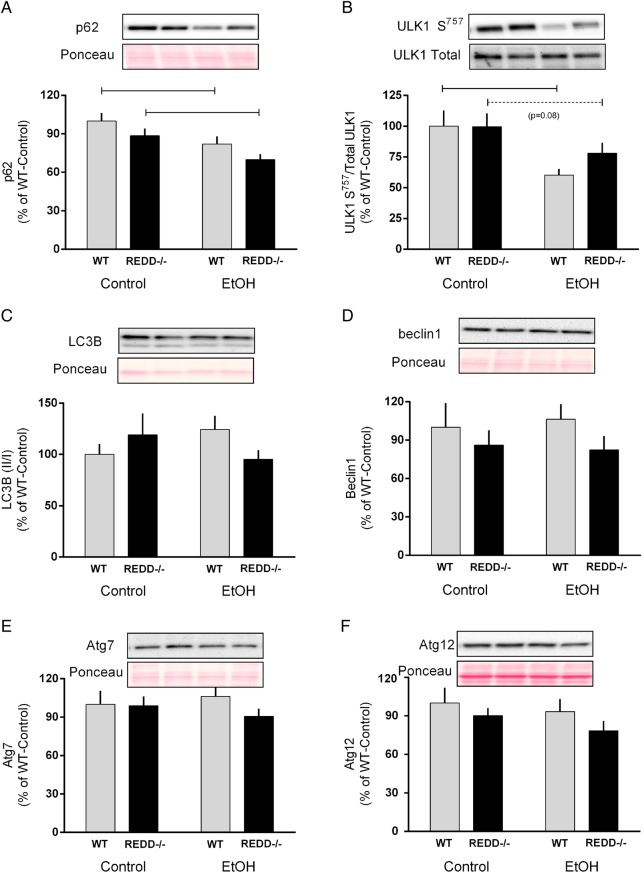
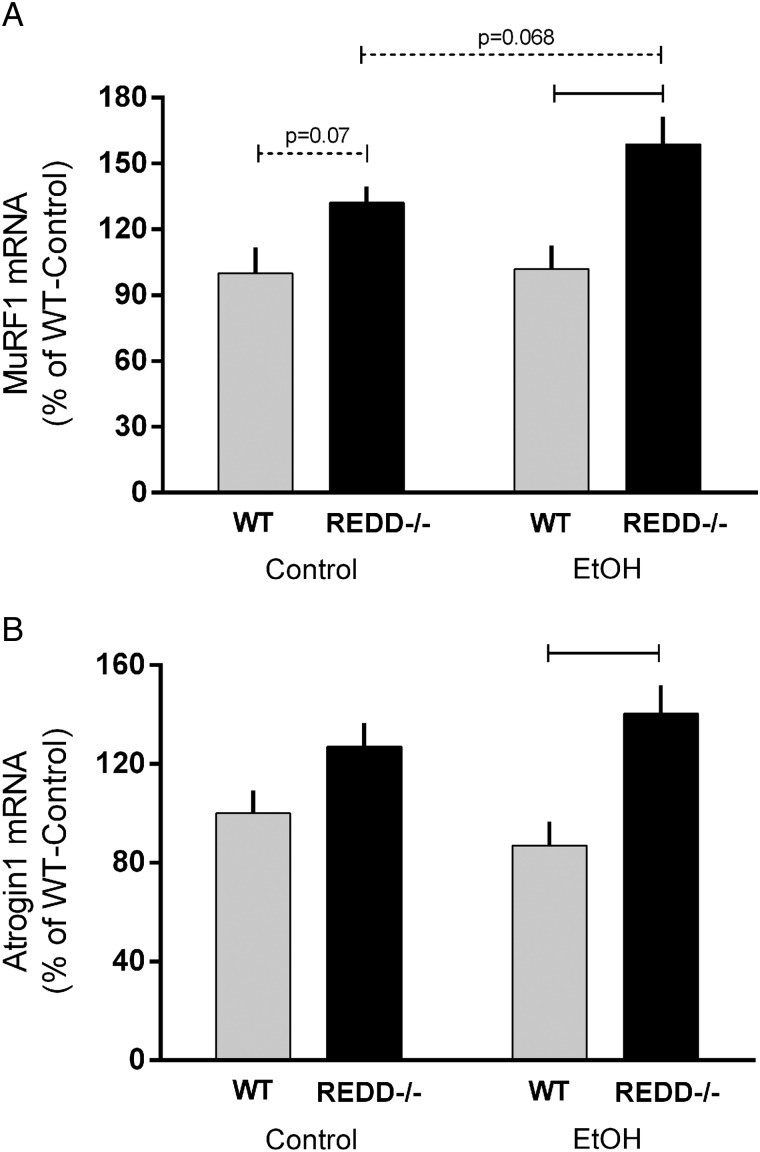
Protein breakdown, which also contributes to the overall protein balance within skeletal muscle, is modulated by two major pathways including ubiquitin-mediated proteolysis and autophagy (Sandri et al., 2013). Disruption of the REDD1 gene did not appear to alter autophagy as assessed by several surrogate autophagic markers including ULK1, p62, LC3, beclin-1, Atg-7 and Atg12 (Fig. 5A–F). In contrast, acute alcohol decreased protein content of p62 and ULK1 S757 phosphorylation in WT and REDD1−/− mice, possibly suggesting enhanced autophagy within the muscle. However, alcohol did not significantly alter the protein content for LC3B, beclin1, Atg7 or Atg12 in either genotype. Similarly, alcohol did not change the mRNA content of the atrogenes, MuRF1 and atrogin-1, in either genotype despite a trend in the REDD1−/− mice for an increase in MuRF1 mRNA (P = 0.068) (Fig. 6A and B). Lastly, MuRF1 and atrogin-1 mRNAs were increased in REDD1−/− muscle compared with WT in mice after acute alcohol.
Fig. 5.
Markers of autophagy were assessed in wild-type (WT) and REDD1−/− mice after acute alcohol intoxication. Indicators of autophagy including p62 (A), ULK-1 S757 (B), LC3B (C), beclin1 (D), Atg7 (E) and Atg12 (F) were quantified from western blot images and are expressed relative to the total amount of the respective protein when available. Where the corresponding total protein was not measured, Ponceau S stain was used to verify loading. Gray bars represent WT and black bars correspond to REDD1−/− mice. Lanes shown in the representative image correspond to the order in the graph. All values are expressed relative to control-WT which was set to 100%. Horizontal bars indicate statistical differences between groups (P < 0.05). WT-Con, n = 10; WT-EtOH, n = 15; REDD1−/−-Con, n = 18; REDD1−/−-EtOH, n = 20. Values are expressed as means ± SE.
Fig. 6.
Atrogene mRNA content in muscle from wild-type (WT) and REDD1−/− mice. RT–PCR was used to measure mRNA expression of MuRF1 (A) and atrogin-1 (B) in muscle. Gray bars represent WT mice and black bars correspond to REDD1−/− mice with all values expressed relative to control-WT value set to 100%. Horizontal bars indicate statistical differences between groups (P < 0.05) and dashed lines indicate a trend for differences with the corresponding P-value listed above. WT-Con, n = 10; WT-EtOH, n = 15; REDD1−/−-Con, n = 18; REDD1−/−-EtOH, n = 20. Values are expressed as means ± SE.
DISCUSSION
Previous work has shown REDD1 is elevated by acute alcohol administration in muscle from male and female rats and this change was associated with impaired mTORC1 signaling and protein synthesis (Lang et al., 2008); however, causality has not been verified. Presently, utilizing mice globally lacking REDD1 expression, we show that the alcohol-induced decrease in protein synthesis is independent of REDD1 and modulation of mTORC1 signaling. Moreover, the alcohol-induced hyperinsulinemia seen in WT mice was absent in REDD1−/− mice.
As a negative regulator of mTORC1, it was hypothesized that deletion of the REDD1 gene would ameliorate the acute alcohol-induced decrease in muscle protein synthesis. Instead, our data indicate the acute decrease in muscle protein synthesis observed 1 h after alcohol did not differ in WT and REDD1−/− mice. Further, the phosphorylation of the mTORC1 substrates S6K1 and 4E-BP1 did not differ between WT and REDD1−/− mice after a bolus injection of alcohol. REDD1−/− mice are phenotypically similar to their littermates, and in agreement with the present findings no change in protein synthesis or mTORC1 signaling has been previously reported in female REDD1 knockout mice (Britto et al., 2014). However, REDD1 deletion did decrease phosphorylation of Akt (both S473 and T308) and TSC2 under basal conditions compared to WT controls. A reduction in Akt activity when REDD1 is deleted corroborates previous work showing male REDD1−/− mice to have impaired insulin signaling (Britto et al., 2014; Dungan et al., 2014; Williamson et al., 2014). For example, REDD1 contributes to the maximal insulin-stimulated phosphorylation of IRS1 and Akt S473 in muscle and as Akt S473 phosphorylation is necessary for optimal phosphorylation of Akt T308, a lack of REDD1 could therefore decrease Akt phosphorylation (Dungan et al., 2014).
The majority of research investigating the acute and chronic effects of alcohol on skeletal muscle protein balance has been performed in rats and shows mTOR activity and protein synthesis to be consistently impaired, while changes in protein breakdown are less definitive (Steiner and Lang, 2015b). In contrast, we show that phosphorylation of mTOR and its direct substrates S6K1 and 4E-BP1 is unchanged by acute alcohol in WT and REDD1−/− mice. Despite the apparent lack of effect on mTOR kinase activity, acute alcohol did decrease rpS6 phosphorylation, a known substrate of S6K1. Such internally inconsistent results have been reported in the mouse model of acute intoxication in relation to modulation of this signaling pathway (Lang et al., 2010). Although this observation is consistent with data from in vitro studies demonstrating mTOR-independent phosphorylation of rpS6 (Rosner and Hengstschlager, 2010), we cannot exclude the possibility that these discordant results may stem from temporal differences in the activation/inactivation of mTOR and S6K1 kinase activity after alcohol.
The lack of increase in REDD1 mRNA following acute alcohol intoxication in WT mice contrasts with that reported in rats and may therefore contribute to the lack of an acute alcohol-mediated change in mTORC1 signaling. In support of a species-specific effect of alcohol, there was no increase in REDD1 protein in muscle from male mice 5 h after an acute alcohol challenge (3 g/kg BW) (Steiner and Lang, 2015a). We also cannot exclude the possibility that genotype/strain and/or nutritional status of the animal may influence the effects of alcohol on skeletal muscle signaling. This is the first report of acute alcohol intoxication in female mice, although male and female rats were previously shown to respond similarly to an acute dose of alcohol independent of nutritional status and mode of administration (gavage or IP injection) (Lang et al., 2008). Further, previous investigations using acute alcohol in mice were performed on animals of the C57BL/6 background. However, female mice on a B6/129F1 background were used in the current study and therefore this difference may have contributed to the differential metabolic response to alcohol. Lastly, the majority of previous work has been performed following a short fast (1–5 h) or an overnight fast to standardize the nutritional/energy status of the animals. Fasting not only elevates REDD1 but also suppresses phosphorylation of S6K1 and 4E-BP1 which makes it difficult to detect additional alcohol-related changes in these proteins (McGhee et al., 2009; Gordon et al., 2015). Therefore, herein we used animals in a freely fed, basal, post-absorptive state; however, this led to increased variability between animals and treatment groups and could potentially be a reason for the smaller than anticipated effect of acute alcohol on mTOR signaling. Finally, although glucocorticoids can transcriptionally regulate REDD1 and pretreatment with the glucocorticoid receptor antagonist RU486 can block dexamethasone-induced increases in REDD1 (Wang et al., 2006; Lang et al., 2008), such a mechanism does not appear operational in the current study as the circulating corticosterone concentration did not differ with genotype or alcohol treatment.
Protein degradation also regulates skeletal muscle mass and while a decrease in the protein content of the autophagic markers p62 and ULK1 would be suggestive of increased autophagy with acute alcohol, the lack of changes in other key proteins in this pathway precludes us from reaching a definitive conclusion. Previously, prolonged (6 weeks) alcohol feeding increased the mRNA content for LC3B and Beclin1 while decreasing p62 indicating chronic alcohol feeding increased muscle autophagy (Thapaliya et al., 2014). As WT and REDD1−/− mice exhibited similar reductions in p62 and ULK in response to acute alcohol, any alcohol-induced change in autophagy signaling appears to be REDD1-independent despite ULK1 being a downstream target of mTOR. In contrast, the mRNA content of the atrogenes MuRF1 and atrogin1 was not responsive to acute alcohol in WT mice, but tended to be increased in REDD1−/− mice. Therefore, REDD1 may play a yet to be recognized role in ubiquitin-mediated proteolysis during catabolic conditions.
In summary, acute alcohol administration decreased the rate of protein synthesis while protein breakdown appeared to be largely unaltered in skeletal muscle of female mice. These effects were independent of REDD1 as the response to acute alcohol did not differ between WT and REDD1−/− mice. A more in-depth appreciation of potential modulating factors (e.g., species, mouse strain, nutritional status) is central to establishing the most appropriate preclinical research model for future alcohol-related projects, and to help formulate the appropriate design of future clinical studies.
FUNDING
This work was supported in part by R37 AA011290 (C.H.L), F32 AA023422 (J.L.S), and DK15658 (S.R.K.).
CONFLICT OF INTEREST STATEMENT
None declared.
ACKNOWLEDGEMENTS
The authors thank Chen Yang for breeding the REDD1−/− mice; Dr David Williamson for supplying the REDD1−/− breeding animals; Quark Pharmaceuticals for permission to use the REDD1−/− mice; and Maithili Navaratnarajah, Anne Pruznak and Gina Deiter for their excellent technical assistance.
REFERENCES
- Avruch J, Long X, Lin Y et al. (2009) Activation of mTORC1 in two steps: Rheb-GTP activation of catalytic function and increased binding of substrates to raptor. Biochem Soc Trans 37:223–6. [DOI] [PubMed] [Google Scholar]
- Brafman A, Mett I, Shafir M et al. (2004) Inhibition of oxygen-induced retinopathy in RTP801-deficient mice. Invest Ophthalmol Vis Sci 45:3796–805. [DOI] [PubMed] [Google Scholar]
- Britto FA, Begue G, Rossano B et al. (2014) REDD1 deletion prevents dexamethasone-induced skeletal muscle atrophy. Am J Physiol Endocrinol Metab 307:E983–93. [DOI] [PubMed] [Google Scholar]
- Brugarolas J, Lei K, Hurley RL et al. (2004) Regulation of mTOR function in response to hypoxia by REDD1 and the TSC1/TSC2 tumor suppressor complex. Genes Dev 18:2893–904. [DOI] [PMC free article] [PubMed] [Google Scholar]
- Centers for Disease Control and Prevention. (2012) Vital signs: binge drinking prevalence, frequency, and intensity among adults—United States 2010. MMWR Morb Mortal Wkly Rep 61:14–9. [PubMed] [Google Scholar]
- Chen MM, Palmer JL, Ippolito JA et al. (2013) Intoxication by intraperitoneal injection or oral gavage equally potentiates postburn organ damage and inflammation. Mediators Inflamm 2013:971481. [DOI] [PMC free article] [PubMed] [Google Scholar]
- Dennis MD, Coleman CS, Berg A et al. (2014) REDD1 enhances protein phosphatase 2A-mediated dephosphorylation of Akt to repress mTORC1 signaling. Sci Signal 7:ra68. [DOI] [PMC free article] [PubMed] [Google Scholar]
- Dungan CM, Wright DC, Williamson DL (2014) Lack of REDD1 reduces whole body glucose and insulin tolerance, and impairs skeletal muscle insulin signaling. Biochem Biophys Res Commun 453:778–83. [DOI] [PubMed] [Google Scholar]
- Ellisen LW, Ramsayer KD, Johannessen CM et al. (2002) REDD1, a developmentally regulated transcriptional target of p63 and p53, links p63 to regulation of reactive oxygen species. Mol Cell 10:995–1005. [DOI] [PubMed] [Google Scholar]
- Ge Y, Chen J (2012) Mammalian target of rapamycin (mTOR) signaling network in skeletal myogenesis. J Biol Chem 287:43928–35. [DOI] [PMC free article] [PubMed] [Google Scholar]
- Gordon BS, Williamson DL, Lang CH et al. (2015) Nutrient-induced stimulation of protein synthesis in mouse skeletal muscle is limited by the mTORC1 repressor REDD1. J Nutr 145:708–13. [DOI] [PMC free article] [PubMed] [Google Scholar]
- Guertin DA, Stevens DM, Thoreen CC et al. (2006) Ablation in mice of the mTORC components raptor, rictor, or mLST8 reveals that mTORC2 is required for signaling to Akt-FOXO and PKCalpha, but not S6K1. Dev Cell 11:859–71. [DOI] [PubMed] [Google Scholar]
- Haller RG, Knochel JP (1984) Skeletal muscle disease in alcoholism. Med Clin North Am 68:91–103. [DOI] [PubMed] [Google Scholar]
- Hanrahan J, Blenis J (2006) Rheb activation of mTOR and S6K1 signaling. Methods Enzymol 407:542–55. [DOI] [PubMed] [Google Scholar]
- Inoki K, Li Y, Zhu T et al. (2002) TSC2 is phosphorylated and inhibited by Akt and suppresses mTOR signalling. Nat Cell Biol 4:648–57. [DOI] [PubMed] [Google Scholar]
- Lang CH, Frost RA, Vary TC (2008) Acute alcohol intoxication increases REDD1 in skeletal muscle. Alcohol Clin Exp Res 32:796–805. [DOI] [PubMed] [Google Scholar]
- Lang CH, Lynch CJ, Vary TC (2010) Alcohol-induced IGF-I resistance is ameliorated in mice deficient for mitochondrial branched-chain aminotransferase. J Nutr 140:932–8. [DOI] [PMC free article] [PubMed] [Google Scholar]
- Livy DJ, Parnell SE, West JR (2003) Blood ethanol concentration profiles: a comparison between rats and mice. Alcohol 29:165–71. [DOI] [PubMed] [Google Scholar]
- McGhee NK, Jefferson LS, Kimball SR (2009) Elevated corticosterone associated with food deprivation upregulates expression in rat skeletal muscle of the mTORC1 repressor, REDD1. J Nutr 139:828–34. [DOI] [PMC free article] [PubMed] [Google Scholar]
- Miller BF, Hansen M, Olesen JL et al. (2006) No effect of menstrual cycle on myofibrillar and connective tissue protein synthesis in contracting skeletal muscle. Am J Physiol Endocrinol Metab 290:E163–68. [DOI] [PubMed] [Google Scholar]
- Pacy PJ, Preedy VR, Peters TJ et al. (1991) The effect of chronic alcohol ingestion on whole body and muscle protein synthesis—a stable isotope study. Alcohol Alcohol 26:505–13. [DOI] [PubMed] [Google Scholar]
- Preedy VR, Ohlendieck K, Adachi J et al. (2003) The importance of alcohol-induced muscle disease. J Muscle Res Cell Motil 24:55–63. [DOI] [PubMed] [Google Scholar]
- Rantanen T, Masaki K, He Q et al. (2012) Midlife muscle strength and human longevity up to age 100 years: a 44-year prospective study among a decedent cohort. Age (Dordr) 34:563–70. [DOI] [PMC free article] [PubMed] [Google Scholar]
- Rosner M, Hengstschlager M (2010) Evidence for cell cycle-dependent, rapamycin-resistant phosphorylation of ribosomal protein S6 at S240/244. Amino Acids 39:1487–92. [DOI] [PubMed] [Google Scholar]
- Sandri M, Coletto L, Grumati P et al. (2013) Misregulation of autophagy and protein degradation systems in myopathies and muscular dystrophies. J Cell Sci 126:5325–33. [DOI] [PubMed] [Google Scholar]
- Steiner JL, Lang CH (2014) Alcohol impairs skeletal muscle protein synthesis and mTOR signaling in a time-dependent manner following electrically stimulated muscle contraction. J Appl Physiol (1985) 117:1170–9. [DOI] [PMC free article] [PubMed] [Google Scholar]
- Steiner JL, Lang CH (2015a) Alcohol intoxication following muscle contraction in mice decreases muscle protein synthesis but not mTOR signal transduction. Alcohol Clin Exp Res 39:1–10. [DOI] [PMC free article] [PubMed] [Google Scholar]
- Steiner JL, Lang CH (2015b) Dysregulation of skeletal muscle protein metabolism by alcohol. Am J Physiol Endocrinol Metab 308:E699–712. [DOI] [PMC free article] [PubMed] [Google Scholar]
- Thapaliya S, Runkana A, McMullen MR et al. (2014) Alcohol-induced autophagy contributes to loss in skeletal muscle mass. Autophagy 10:677–90. [DOI] [PMC free article] [PubMed] [Google Scholar]
- Toth MJ, Poehlman ET, Matthews DE et al. (2001) Effects of estradiol and progesterone on body composition, protein synthesis, and lipoprotein lipase in rats. Am J Physiol Endocrinol Metab 280:E496–501. [DOI] [PubMed] [Google Scholar]
- Vary TC, Lang CH (2008) Assessing effects of alcohol consumption on protein synthesis in striated muscles. Methods Mol Biol 447:343–55. [DOI] [PubMed] [Google Scholar]
- Wang H, Kubica N, Ellisen LW et al. (2006) Dexamethasone represses signaling through the mammalian target of rapamycin in muscle cells by enhancing expression of REDD1. J Biol Chem 281:39128–34. [DOI] [PubMed] [Google Scholar]
- Williamson DL, Li Z, Tuder RM et al. (2014) Altered nutrient response of mTORC1 as a result of changes in REDD1 expression: effect of obesity vs. REDD1 deficiency. J Appl Physiol (1985) 117:246–56. [DOI] [PMC free article] [PubMed] [Google Scholar]


