Abstract
Background
Nonalcoholic fatty liver disease (NAFLD) is a common cause of abnormal liver tests in the U.S. population. NAFLD represents a histological spectrum ranging from benign hepatic steatosis (NAFL) to nonalcoholic steatohepatitis (NASH). NAFLD is closely associated with features of metabolic syndrome, particularly insulin resistance (IR). Although the role of IR in NAFL and NASH has been an area of intense investigation, there is limited evaluation of pancreatic β-cell in NASH, particularly in the United States.
Aim
The aim of the current study was to evaluate the status of pancreatic β-cell function in NAFLD using the homeostatic model assessment-β (HOMA-β) and β-cell index (BI).
Method
HOMA-β was measured in ninety-nine non-diabetic subjects with histologically confirmed NAFLD and compared to lean (age and gender matched) and obese (age-, gender-, and BMI-matched) controls. Using the values from an oral glucose tolerance test β-cell index (BI) was compared in 31 subjects with non-diabetic, non-cirrhotic subjects with NASH and gender- and BMI matched controls.
Results
The subjects with NAFLD had higher HOMA- β compared to both lean and obese controls (43.1% vs. 9% vs. 22.1, respectively, P<.05). HOMA-β was directly related to serum alkaline phosphate, total bilirubin, weight and inversely to age. There was no difference in HOMA-β between subjects with NAFL and NASH. Subjects with NASH had lower pancreatic β-cell function as measured by a lower BI (2.09±1.64 vs. 7.74±25.12; P = .04). In patients with NASH, BI was inversely associated with fibrosis independent of age, BMI, and serum ALT levels. In contrast, HOMA-β was directly associated with fibrosis stage.
Conclusion
NASH is associated with strained pancreatic β-cell function in non-diabetic subjects. Future studies are necessary to evaluate the temporal relationship between β-cell function and hepatic histology.
Keywords: Nonalcoholic fatty liver disease, Nonalcoholic steatohepatitis, pancreatic B-cell function, insulin resistance
INTRODUCTION
Nonalcoholic fatty liver disease (NAFLD) is the leading cause of elevated aminotransferases in the United States and encompasses a spectrum of disorders characterized by intrahepatic fat accumulation (simple steatosis or NAFL) to varying degrees of necroinflammatory activity (nonalcoholic NASH or NASH) (1, 2). NASH is associated with an increase in all-cause mortality and progression to end-stage liver disease (3, 4). NASH is closely associated with features of metabolic syndrome, particularly insulin resistance (5, 6). Even in the absence of overt diabetes, almost all patients with NASH have subclinical insulin resistance and a propensity for developing diabetes (5, 7).
Progression to diabetes is a complex interplay between insulin resistance, insulin sensitivity and pancreatic β-cell function. A decrease in sensitivity to insulin demands compensation through a proportionate adjustment in insulin secretion by pancreatic β-cell to maintain glucose homeostasis (8). Therefore, accurate assessment of β-cell function can only be made in the context of insulin sensitivity. Since the functional β-cell mass cannot be directly measured in patients, alternative methods that evaluate β-cell function are used. While clamp and frequent sampling intravenous glucose tolerance tests (FSIVGTTs) are considered to be the gold standard in assessing β-cell function, they are limited by their resource and time-intense nature making them difficult to implement in larger cohort studies (9, 10). Therefore, simpler models are used in practice/research based on oral glucose tolerance test (OGTT) and models derived from basal measurements (i.e. homeostasis model assessment or HOMA indexes) (11–13) Homeostatic model assessment of β-cell function (HOMA- β) has been used to compare pancreatic β-cell function across different populations. HOMA- β assesses pancreatic β-cell function from basal glucose and insulin concentrations and reflects pancreatic β-cell insulin secretion under non-stimulated conditions (14). However, since the model relies on fasting serum insulin and glucose concentrations, it does not provide information about the β-cell response to a glucose load. In contrast, the β-cell index (BI) uses values from OGTT to estimate β-cell function in stimulated conditions while accounting for insulin sensitivity and thus provides a dynamic assessment pancreatic β-cell response to glucose (15) An additional advantage of BI over other indices of pancreatic β-cell function is that BI accounts for β-cell compensatory measures in subjects with impaired glucose tolerance (8, 15, 16) and is a more robust and dynamic measure of pancreatic β-cell function.
The relationship between insulin sensitivity and NAFLD is well established (5). However, there are a limited number of studies evaluating pancreatic β-cell in NASH (17–20). Despite rigorous methodology, these studies are limited by either a small sample size (19, 20), lack of differentiation between NAFLD and NASH (18–20) and the association between all histological parameters of NAFLD and pancreatic β-cell function were not reported (17–20). Additionally, these studies were conducted in an Italian cohort and there is no data regarding pancreatic β-cell function and NAFLD in a North American cohort. Therefore, we hypothesized that NAFLD is associated with a decline in pancreatic β-cell function in a North American cohort. In order to bridge these gaps in knowledge, the present study was designed to: (1) evaluate HOMA-β in non-diabetic subjects with NAFLD compared to lean and obese controls (2) determine the relationship between the histological severity of NAFLD and HOMA-β (3) evaluate the BI in patients with histologically-confirmed NASH using BMI-matched controls and (4) determine the effects of individual histological features of NASH on BI.
METHODS
Study Design
This was an ancillary study that is part of a larger ongoing study of NAFLD related outcomes and the factors driving these outcomes at the authors’ institution. The Institutional Review Board (IRB) approved the study and the data was analyzed in its entirety by the investigators who are fully responsible for the data and conclusions. The manuscript was reviewed and approved by all investigators prior to its submission.
The Study Population
The data analysis was done in two separate cohorts of patients with varying histological severity of NAFLD. For the first set of analyses, non-diabetic subjects with histologically proven NAFLD (NAFLD and NASH) were used (Cohort 1). NAFLD was defined by consumption of less than 20 grams of alcohol every day and a liver biopsy demonstrating NAFLD (21). The hepatic histology was assessed and each histological parameter (steatosis, cytologic ballooning, lobular inflammation, and fibrosis) was quantified in a blinded manner according to the NASH-CRN criteria (22). Patients with any other known liver diseases were excluded from the study. Similarly, subjects with cirrhosis were excluded since underlying portal hypertension can lead to a shunt effect and therefore impair insulin extraction by the liver. This was done to gain a proof-of-concept study since assessment of pancreatic β-cell relies on accurate measurement of peripheral insulin levels, which can be unpredictable in those with cirrhosis or portal hypertension. Subjects with NAFLD were matched 1:1 with the following two controls groups to evaluate the impact of weight on pancreatic β-cell function: (1) Lean (age- and gender-matched but BMI < 25kg/m2) and (2) Obese (age-, gender- and BMI-matched) controls. The control group consisted of subjects with no known liver disease and normal serum aminotransferase levels (AST/ALT < 19 IU/L in women and <30 IU/L in men) (23). In controls, the presence of underlying hepatic steatosis was additionally ruled out via use of liver fat score, which now has been further validated as a robust marker of detecting NAFLD even when compared to those with HCV (24, 25). Subjects with known diagnosis of diabetes, fasting blood sugar of >100 mg/dL, use of oral hypoglycemic agents or insulin were excluded from the study. Also, subjects with known chronic kidney disease or elevated serum creatinine were excluded from analysis.
To further study the pancreatic β-cell function, β-cell index (BI) was calculated from oral glucose tolerance test (OGTT). For this part of the study, thirty-one non-diabetic female patients with histologically proven NASH were identified and had a 2-hour OGTT (Cohort 2). These patients were gender- and BMI matched with females with no known liver disease and absence of hepatic fat based on the liver fat score (24). Patients with histologically confirmed cirrhosis were excluded from this analysis as well.
Study procedures
Oral Glucose Tolerance Test and Free Fatty Acids (FFA) in Cohort 2
After a 12-hour overnight fast, subjects ingested a solution containing 75g of dextrose, and venous blood samples were drawn at 0, 30, 60, 90 and 120 minutes for insulin and glucose measurements. Serum FFA were drawn at time 0 of the blood samples drawn during the OGTT.
Calculations
As indices of insulin resistance and sensitivity, we used homeostatic model assessment (IRHOMA) and Matsuda’s insulin sensitivity index composite (ISIc), respectively (26, 27) Pancreatic β-cell function was calculated using HOMA- β and β-cell index (BI) (14, 15) These parameters of insulin sensitivity and β-cell function were calculated using insulin and glucose values during the OGTT, as follows:
| (1) |
| (2) |
| (3) |
| (4) |
Hepatic fat content was assessed in controls via liver fat score (LFS) (24)
| (5) |
Adipose-tissue insulin resistance (AdipoIR) (28) was calculated as follows:
| (6) |
Plan of Analysis
Mean and standard deviations were used to evaluate differences across the groups. Across group comparisons of continuous variables were performed using one-way analysis of variance (ANOVA) with corrections for multiple comparisons as appropriate for normally distributed variables. A distribution-free test was used for variables that were not normally distributed. Linear regression models were used to evaluate the relationship between laboratory parameters and marker of insulin sensitivity and β-cell function. Spearman’s correlation coefficient was used to compare the difference between scores of individual histological parameters and insulin sensitivity and β-cell function. To determine the impact of advanced fibrosis on β-cell function, the cohort with NASH was divided into two groups (1) low grade fibrosis (grade 0–2) and (2) high-grade fibrosis (stages 3). Markers of insulin sensitivity and β-cell function were subsequently compared across these two groups. The current study was powered to detect an 80% difference between controls and study subjects. Power calculation was done using general linear model with repeat measures to calculate observed power. A P-value of less than .05 was considered significant. All analyses were done in SPSS 21.0 (IBM, Chicago, IL).
RESULTS
For cohort 1, ninety-nine subjects met biopsy criteria and were included in the final analysis. The obese controls were well matched to the NAFLD cohort with respect to age, gender, and BMI (Table 1). The lean group was well matched to NAFLD and obese controls with respect to age and gender but had a significantly lower mean BMI (22.4 ± 1.8kg/m2 vs. 34.9 ± 3.8kg/m2 vs 32.5 ± 6 kg/m2; P<.01). The serum AST and ALT levels were significantly elevated in subjects with NAFLD compared to both lean and obese controls (P<.01 NAFLD vs. both controls). The liver fat scores in the lean and obese controls were −2.55 ± 0.65 and −2.08 ± 0.68, respectively, minimizing the possibility of undiagnosed hepatic steatosis (24).
Table 1.
Clinical characteristics in lean, obese and subjects with NAFLD in cohort 1
| LEAN | OBESE | NAFLD | |
|---|---|---|---|
| DEMOGRAPHICS | |||
| N | 99 | 99 | 99 |
| Age (years) | 57± 13 | 53±10 | 53.5±13 |
| BMI (kg/m2) | 22.4±1.8 | 32.5±6 | 34.9±13.8 |
| Gender (%male) | 42% | 40% | 40% |
| LABORATORY | |||
| Alanine Aminotransferase (IU/L) | 17.4±5.1 | 18.8±6 | 65.3±39.8 |
| Aspartate Aminotransferase (IU/L) | 21.8±5.6 | 20.6±4.4 | 51.0±30.2 |
| Glucose (mg/dL) | 91±18 | 87±6.2 | 91±18 |
| Insulin (uU/L) | 6.8±5 | 12.0±10.8 | 24.9±19.9 |
| Liver Fat Score | −2.55±0.65 | −2.08±0.68 | -- |
| HISTOLOGY | |||
| Steatosis | |||
| Less than 5% | -- | 0 | |
| 5–33% | -- | 49.5% | |
| 33–66% | -- | 34.3% | |
| More than 67% | -- | 16.2% | |
| Lobular Inflammation | |||
| None | -- | 7.3% | |
| Less than 2×/hpf | -- | 65.6% | |
| Between 2–4×/hpf | -- | 26.0% | |
| More than 4×/hpf | -- | 1.0% | |
| Cytologic Ballooning | |||
| None | -- | 41.2% | |
| Few | -- | 43.3% | |
| Many | -- | 15.5% | |
| Fibrosis | |||
| None | -- | 37.4% | |
| Stage 1 | -- | 36.5% | |
| Stage 2 | -- | 7.1% | |
| Stage 3 | -- | 12.1% | |
| Stage 4 | -- | 7.1% | |
NAFLD is associated with overburdened pancreatic β-cell in cohort 1
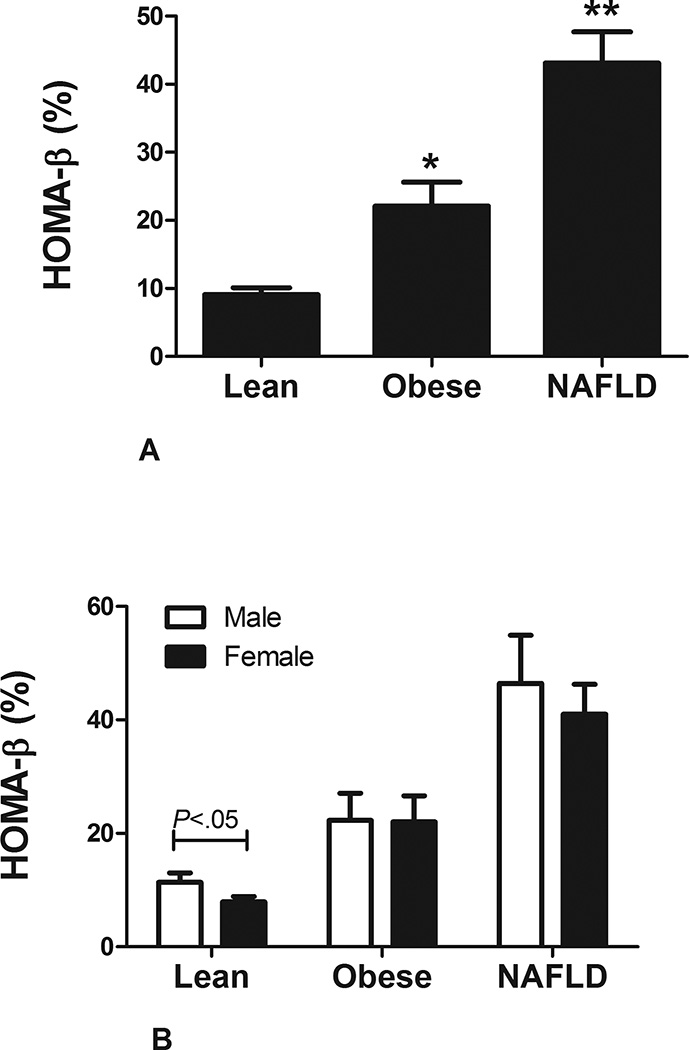
The serum glucose concentrations were similar across the three groups (Table 1). Serum insulin levels increased in stepwise manner from lean to obese to subjects with NAFLD (6.8 ± 5uU/mL to 12.0 ± 10.9uU/mL to 24.9 ± 19.9uU/mL, respectively; P<.001). Adipose tissue insulin resistance (adipoIR) and serum free fatty acid (FFA) levels were similar between the lean and obese control groups but lower compared to subjects with NAFLD (adipoIR: 4.14 ± 3.5 vs. 6.8 ± 6.3 vs. 19.1 ± 15.8; P<.01 controls vs. NAFLD and FFA: 0.59 ± 0.23 vs. 0.63 ± 0.27 vs. 0.76 ± 0.23; P<.01 controls vs. NAFLD) (29). There was a stepwise increase in HOMA-β from lean to obese to subjects with NAFLD (9.1 ± 6.7% vs. 22.1 ± 26.7% vs. 43.1 ± 45.9, respectively; P<.01 for all comparisons) (Figure 1A). Lean male subjects had a mild increase HOMA-β compared to female subjects but otherwise there were no differences in obese controls and subjects with NAFLD with respect to gender (Figure 1B). In subjects with NAFLD, HOMA-β was directly related to serum alkaline phosphate (β = 3.71 ± 1.21; P<.01), total bilirubin (β = 175.35 ± 87.6; P=.048), weight (β = 1.60 ± 0.38; P<.01) and indirectly to age (β = −5.19 ± 1.86; P<.01). In multivariable regression analysis, age (β = −9.23 ± 3.29; P<.01), alkaline phosphatase (β = 3.45 ± 1.11; P<.01) and weight (β = 2.30 ± 0.63; P<.01) remained independently associated with HOMA-β.
FIGURE1. HOMA- β in NAFLD in cohort 1.
A: Homeostatic model assessment of β-cell (HOMA-β) function increases with weight, however, subjects with nonalcoholic fatty liver disease (NAFLD) have a higher HOMA-β compared to age, gender and BMI-matched controls.
B: There was no gender variation in HOMA-β in subjects with NAFLD.
Impact of histology on HOMA-β
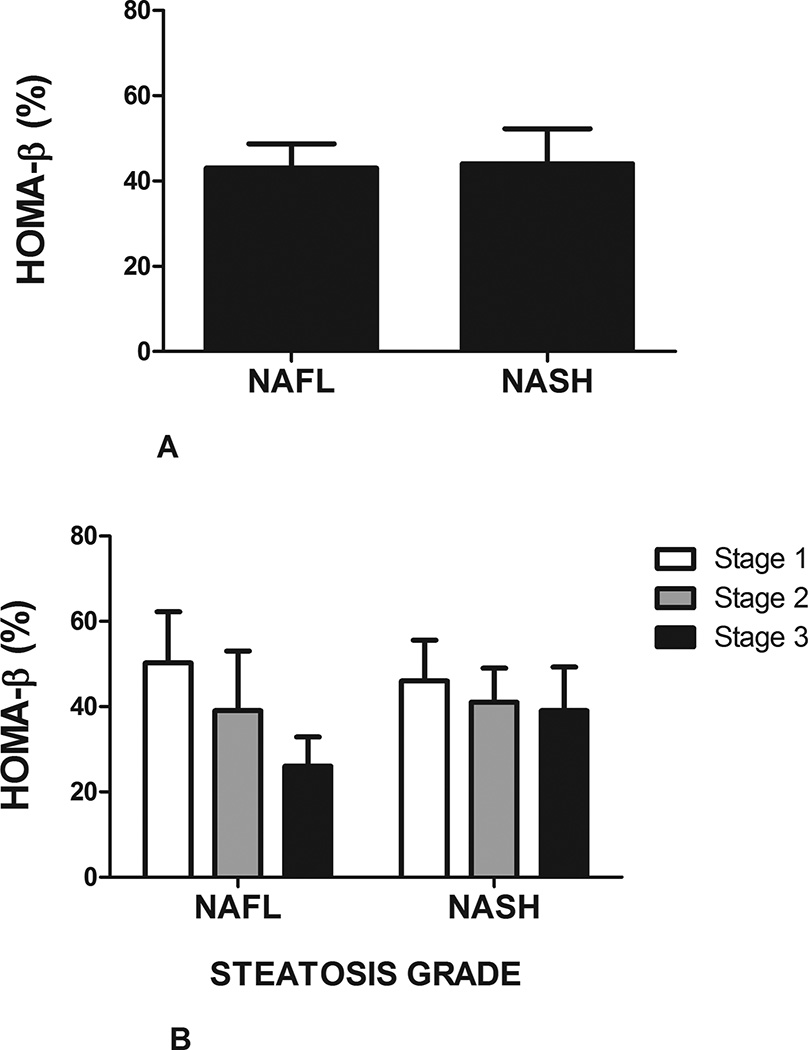
Forty-one subjects had benign hepatic steatosis (NAFL) while fifty-eight had nonalcoholic steatohepatitis (NASH). HOMA-β was similar between subjects with NAFL and NASH (43±8% vs. 43±5.5%, respectively, P=N.S.) (Figure 2A). In univariate analysis in subjects with NAFL, HOMA-β was independently associated with total bilirubin (R=0.312, P=.047), triglycerides (R=0.55, P<.001), weight (R=0.529, P<.001), and waist circumference (R=0.325, P=.041). In subjects with NASH, increase in serum free fatty acid concentration was inversely associated with HOMA- β (R= −0.632, P<.001).
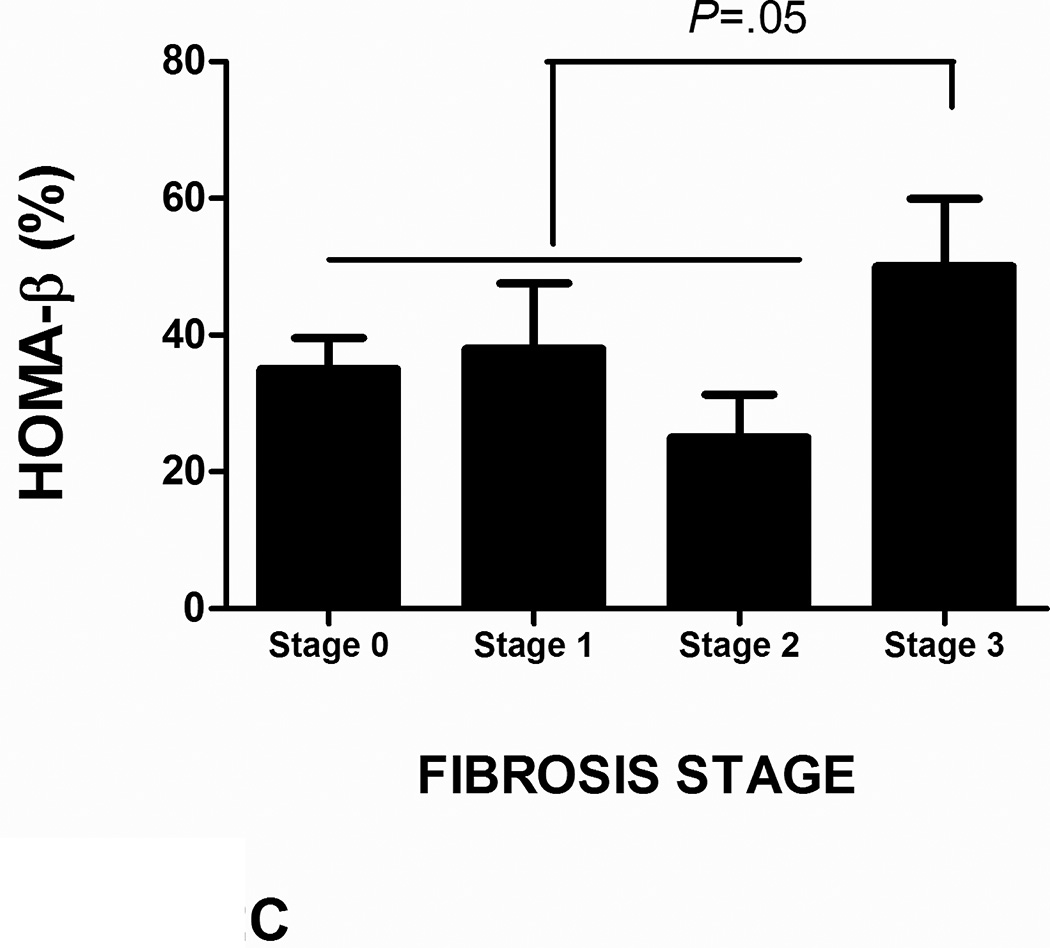
FIGURE 2. Impact of histology on HOMA- β in NAFLD in cohort 1.
A: There was no difference homeostatic model assessment of β-cell (HOMA-β) in subjects with benign hepatic steatosis (NAFL) compared to those with steatohepatitis (NASH).
B: There was a decline in HOMA-β in subjects with NAFL with higher steatotic grade. No similar trend was observed in subjects with NASH.
C: Advanced fibrosis is associated with an increase in HOMA-β in subjects with nonalcoholic fatty liver disease (NAFLD)
There was a trend towards a decrease in HOMA-β in patients with NAFL and NASH with increasing steatosis grade; however, this did not reach statistical significance (Figure 2B). In subjects with NASH, bridging fibrosis was associated with an increase in HOMA-β compared to those without advanced fibrosis (58 ± 47% vs. 36 ± 36%, P=.05) (Figure 2C). Cytologic ballooning or lobular inflammation did not impact HOMA-β in either subjects with NAFL or NASH.
Evaluation of β-cell index in patients with NASH using OGTT in cohort 2
In cohort 2, thirty-one subjects with histologically diagnosed with NASH, along with BMI and gender matched controls had 2-hour OGTT performed to assess BI. Metabolically the two groups were similar in regards to the mean BMI, blood pressure, serum HDL, and presence of metabolic syndrome (Table 2). The control group was younger (25.7 ± 4.0 yrs vs. 53.5 ± 10.2 yrs, P<.001) and had lower serum alanine aminotransferase (ALT) levels (16.8 ± 3.8 IU/L vs. 94.7 ± 67.6 IU/L P<.0001). The liver fat score of −3.009 ± 0.783 made the presence of hepatic steatosis in the control group unlikely.
Table 2.
Demographic and clinical characteristics of subjects with NASH in cohort 2
| CONTROL | NASH | P-value | |
|---|---|---|---|
| DEMOGRAPHICS | |||
| N | 31 | 31 | -- |
| Age (years) | 25.7± 4.7 | 53.5±10.2 | <.0001 |
| BMI (kg/m2) | 34.0±4.0 | 35.6±7.6 | 0.286 |
| Caucasian (%) | 47 | 90 | -- |
| Black (%) | 53 | 10 | -- |
| LABORATORY | |||
| Alanine Aminotransferase (IU/L) | 16.8±3.8 | 94.7±67.6 | <.0001 |
| Aspartate Aminotransferase (IU/L) | 23.1±7.3 | 46.7±24.1 | <.0001 |
| Alkaline Phosphatase | 70.6±16.3 | 102.4±31.2 | <.0001 |
| Glucose (mg/dL) | 84.3±7.1 | 86.6±17.2 | 0.474 |
| Insulin (uU/L) | 6.34±4.13 | 21.12±14.86 | <.0001 |
| Liver Fat Score | −3.099±0.783 | -- | -- |
| HISTOLOGY | |||
| Steatosis | |||
| Less than 5% | -- | 0 | |
| 5–33% | -- | 25.8% | |
| 33–66% | -- | 58.1% | |
| More than 67% | -- | 16.1% | |
| Lobular Inflammation | |||
| None | -- | 0 | |
| Less than 2×/hpf | -- | 58.1% | |
| Between 2–4×/hpf | -- | 38.7% | |
| More than 4×/hpf | -- | 3.2% | |
| Cytologic Ballooning | |||
| None | -- | 6.5% | |
| Few | -- | 35.5% | |
| Many | -- | 58.1% | |
| Fibrosis | |||
| None | -- | 9.7% | |
| Stage 1 | -- | 35.5% | |
| Stage 2 | -- | 22.6% | |
| Stage 3 | -- | 32.3% | |
| Stage 4 | -- | 0% | |
Although serum glucose concentrations were similar between the two cohorts, patients with NASH had greater than a three-fold increase in serum insulin concentrations (6.34 ± 4.13 uU/L vs. 21.12 ± 14.86 uU/L, P<.0001). Patients with NASH had worse insulin sensitivity as assessed by Matsuda Insulin Sensitivity Index (ISIc) and IRHOMA (Figure 3A). In patients with NASH, IRHOMA was inversely related to serum FFA levels (R= −0.465, P=.013).
FIGURE 3. Insulin sensitivity and pancreatic β-cell function in NASH in cohort 2.
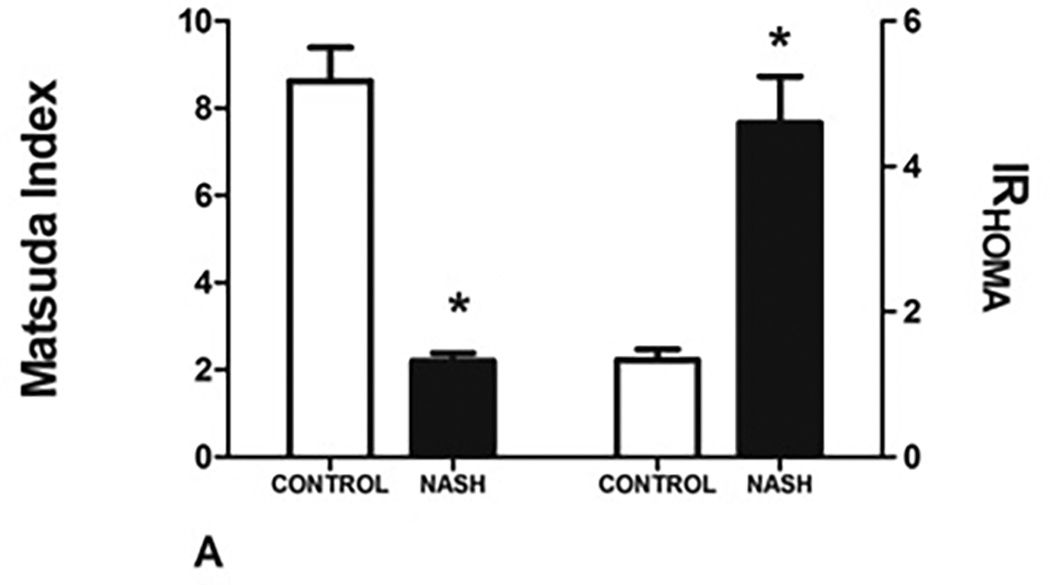
A: NASH is associated with a decrease in insulin sensitivity as measured by Matsuda index and a concomitant increase in insulin resistance (IRHOMA).
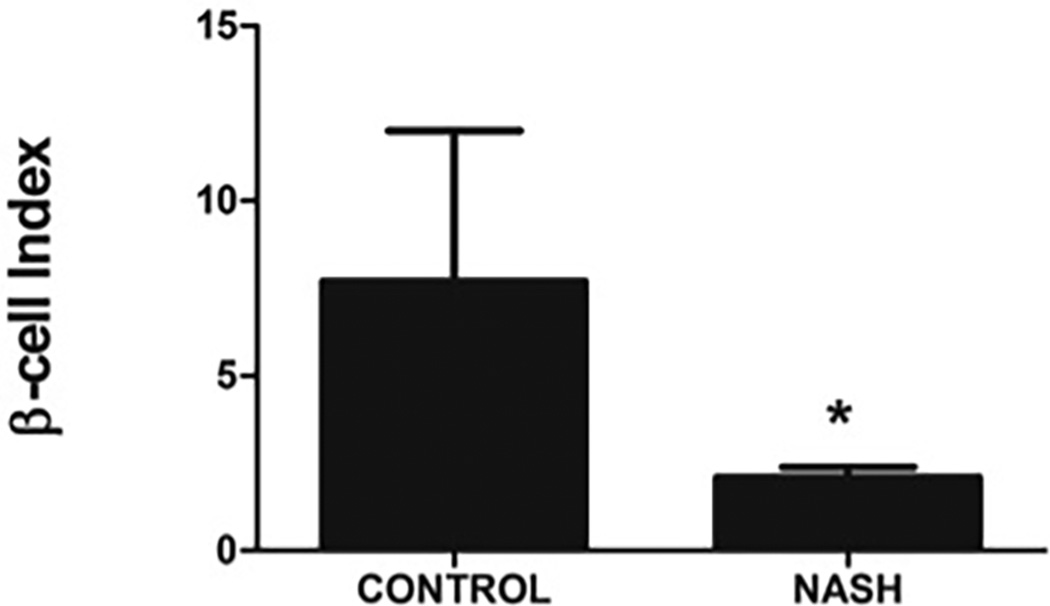
B: β-cell index (BI) is severely impaired in subjects with NASH compared to controls
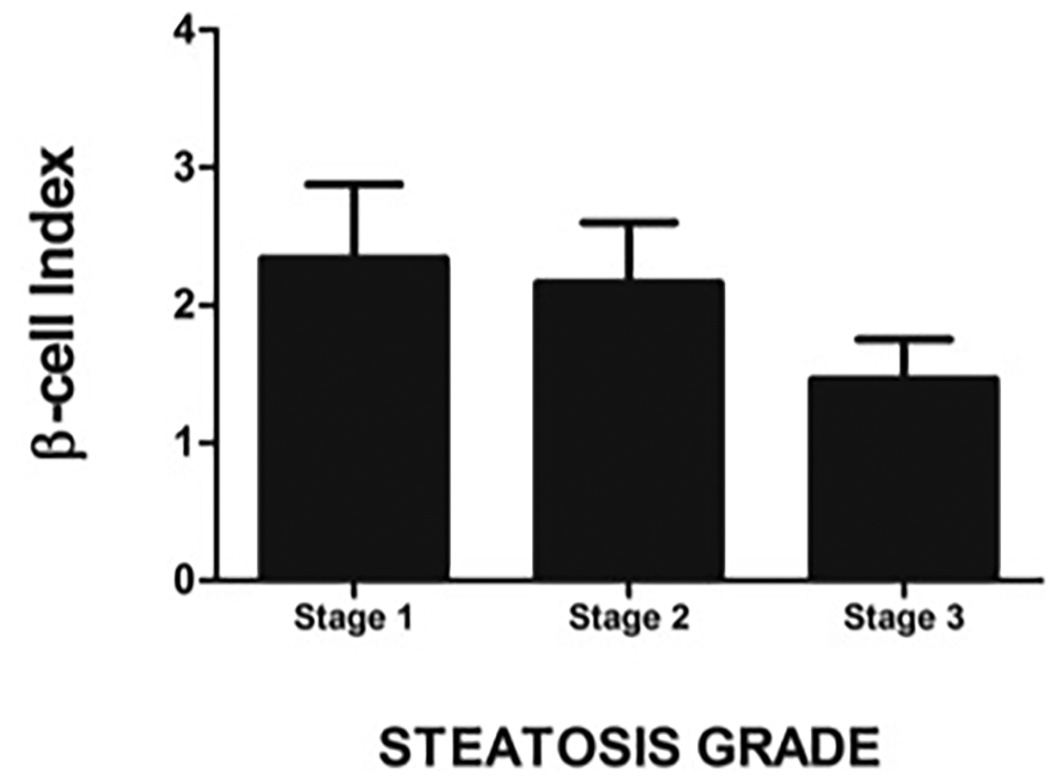
C: BI declines progressively with increase in steatotic grade
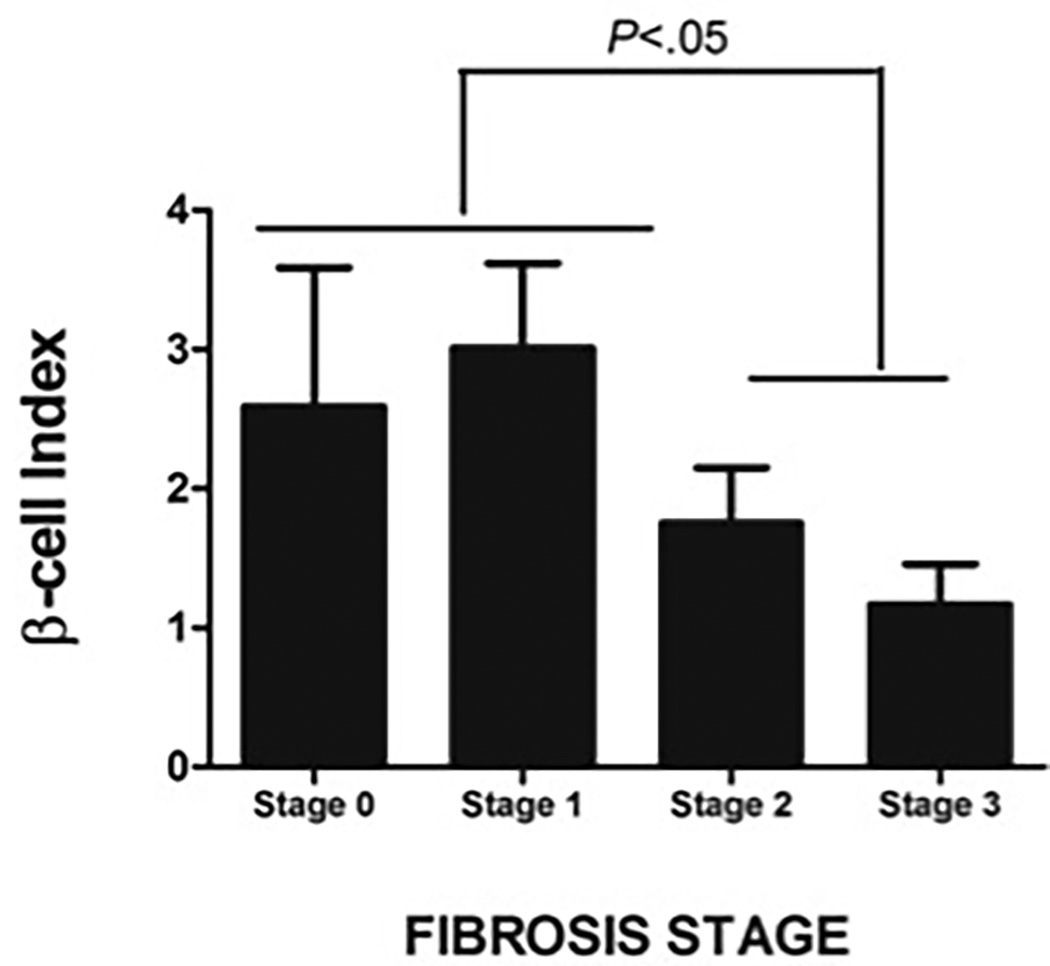
D: BI was significantly lower in NASH subjects with higher fibrosis stage
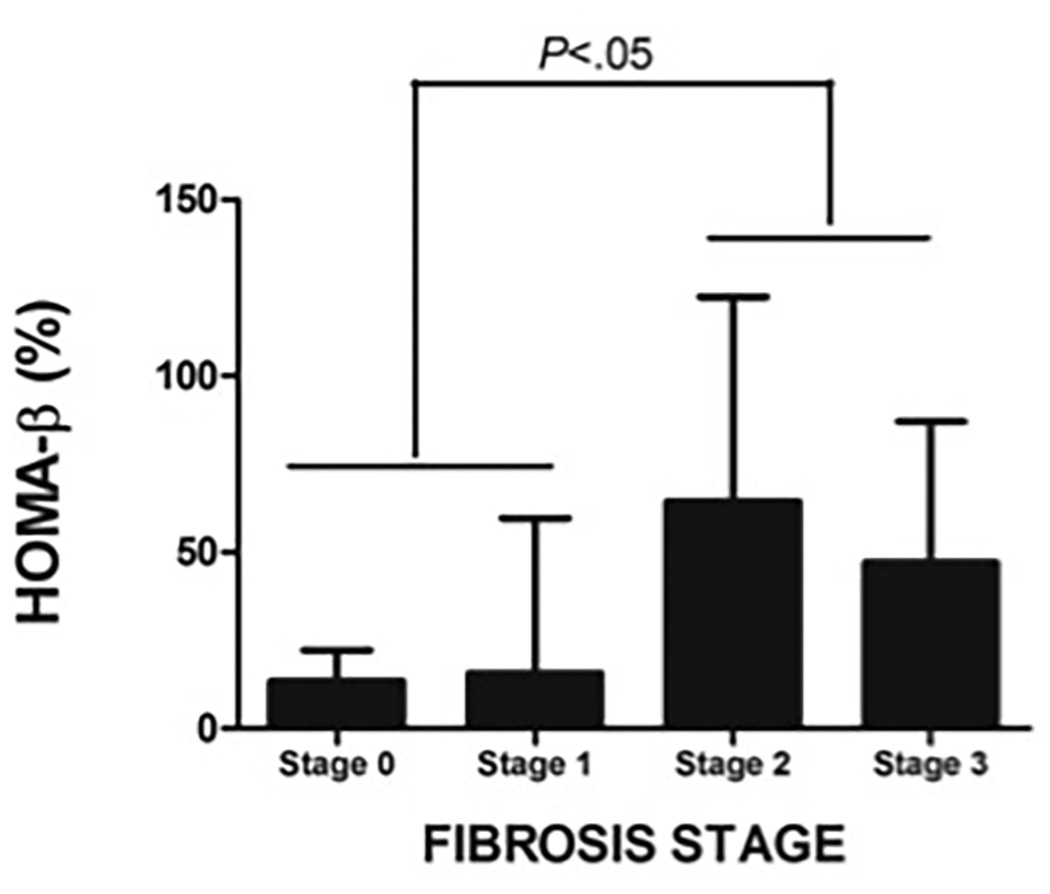
E: HOMA-β was higher in NASH subjects with higher fibrotic stage
The β-cell index (BI), a measure of pancreatic β-cell function, was significantly lower in subjects with NASH compared to controls (7.74 ± 25.12 in controls vs 2.09 ± 1.64 in patients with NASH, P=.048) (Figure 3B). In patients with NASH, BI values further correlated inversely with serum ALT (R= −0.355, P=.049) and age (R= −0.480, P=.006). Using general linear models with repeated measures the observed power was noted to be 0.81.
Compared to those with low-grade lobular inflammation (stage 0–1), subjects with high grade lobular inflammation (stage 2–3) had lower BI (1.76 ± 1.21 vs. 2.33 ± 1.89) but this did not reach statistical significance. Similarly, increase in steatotic grade was associated with a trend for a decline in BI (Stage 1: 2.34 ± 1.53, Stage 2= 2.16 ± 1.88, and Stage 3 = 1.46 ± 0.68; P=N.S.) (Figure 3C). In subjects with NASH, increase in fibrotic grade was associated with a decline in BI (R= −0.504, P=.004). The association between BI and fibrosis stage was independent of patient age, BMI, FFA and serum ALT levels. Increased fibrosis (fibrotic stage 2–3) was associated with a decrease in BI from 2.92 ± 1.92 to 1.41 ± 0.98 (P=.008) (Figure 3D) and an increase in HOMA-β from 15.2 ± 39.8% to 54.3 ± 47.2% (P=.032) (Figure 3E). Similarly, those with higher grade of fibrosis had worse insulin resistance.
DISCUSSION
NAFLD is the hepatic manifestation of the metabolic syndrome and is closely associated with insulin resistance (5, 6). In the current study, we examined the relationship between pancreatic β-cell function as measured by two separate indices (HOMA-β and BI) in NAFLD. Although HOMA-β is easier to measure, it only reflects pancreatic β-cell function in non-stimulated conditions. Therefore, to accurately assess β-cell function under simulated conditions, we used BI, a robust way of modeling pancreatic β-cell function under simulated conditions using OGTT (15). We were highly selective in our patient selection and excluded all subjects with cirrhosis to avoid unpredictable hepatic extraction of insulin in those with cirrhosis due to portosystemic shunting. Since features of the metabolic syndrome are closely associated with pancreatic β-cell dysfunction, we studied β-cell dysfunction in NAFLD in the setting of a metabolically similar control cohort.
A key finding in our study is that non-diabetic subjects with NAFLD have significant pancreatic β-cell dysfunction compared controls. We showed that NAFLD is associated with an exaggerated pancreatic β-cell response, as evident by increased HOMA-β. Although obesity, age and persistent hyperglycemia have been associated with deterioration in pancreatic β-cell function (30, 31), the changes observed in HOMA-β in NAFLD were independent of BMI, age, and gender. The increase in pancreatic β-cell secretion of insulin as measured by HOMA-β likely reflects deterioration of insulin sensitivity resulting in higher insulin demand to maintain euglycemia. This observation was further confirmed with a decline in β-cell index, which reflects both pancreatic β-cell function in the setting of underlying insulin resistance under stimulated conditions. These data coupled with the prior study in an Italian cohort start to provide a potential pathophysiological explanation of high prevalence of diabetes in NAFLD (32–34) Due to the close relationship between insulin resistance and NAFLD, multiple studies have evaluated the role of insulin sensitizing agents in NAFLD. Accumulating data does not support the use of insulin sensitizing agents in NAFLD due to lack of long-term efficacy (35). A speculative explanation for these findings might be that despite improvement in insulin sensitivity, pancreatic β-cell function continues to deteriorate and additional studies are needed to evaluate how changes in β-cell function impact histology over time.
Although no differences were observed between NAFL and NASH in regards to HOMA- β, this may reflect patient selection since all patients with either diabetes or impaired glucose tolerance were excluded from the analysis. Additionally, there was a stepwise decline in HOMA-β in subjects with both NAFL and NASH with increasing steatosis grade (Figure 2B). This decrease could be due to either a decrease in pancreatic β-cell function and secretion heralding pancreatic β-cell exhaustion or simply better insulin sensitivity in subjects with steatosis grade 1 compared to grade 3. Additional well-planned long-term prospective studies are necessary to further examine the evolving relationship between steatosis grade and pancreatic β-cell function.
Insulin resistance is an independent predictor of advanced fibrosis in patients with NAFLD (36). The current study builds on this concept and shows that advanced fibrosis was associated with worse insulin sensitivity (Figure 3A), increased demand on pancreatic β-cell for insulin secretion and impaired pancreatic β-cell function (Figure 3C). Surprisingly, the BI was not related to cytologic ballooning, a key histological feature of NASH. A possible explanation for this is the relative homogeneity of the study population. Only 6.5% of the NASH cohort did not have cytologic ballooning and therefore, it is difficult to make a statistical correlation with such small numbers. Although this study provides an important proof of concept study, additional studies with larger sample size are necessary to build on the findings of the current study to evaluate pancreatic β-cell function in a histologically diverse patient population that ranges from simple hepatic steatosis to NASH to those with bridging fibrosis.
Potential limitations of this study are related to the inherent design of retrospective and cross-sectional studies where we are unable to determine the longitudinal relationship between NAFLD, its histological parameters and pancreatic β-cell over time. The current study only evaluated BI in female subjects and therefore, it is unclear if this data can be generalized to males. Another limitation of the study is that we did not employ frequent sampling of intravenous glucose tolerance test (FSIVGTT) to measure pancreatic β-cell function. However, the BI is a well validated and established model for assessing pancreatic β-cell function and unlike FSIVGTT can be done readily and inexpensively in clinical trials to assess β-cell function. Finally, we did not use C-peptide-derived indices of β-cell function, however, by excluding all patients with underlying cirrhosis we minimized the impact of portosystemic shunting on hepatic insulin extraction.
In conclusion, our study is the first to report on pancreatic β-cell dysfunction in non-diabetic subjects with NAFLD in a North American cohort. We also show the impact of histological features of NAFLD, particularly fibrosis on β-cell function in NAFLD. Although larger longitudinal studies are needed to evaluate the impact of pancreatic β-cell function in NAFLD over time, our data confirms the close association between NAFLD and β-cell dysfunction.
Acknowledgments
| Grant Support: | RO1 DK 081410 to Dr. Sanyal |
| CCTR Grant |
Footnotes
| Project Conceptualization: | M. Shadab Siddiqui, Scott Matherly, Velimir A Luketic, Puneet Puri, Kai L. Cheang, K. Patidar, Richard T. Stravitz, Sherry Boyett, and Arun Sanyal |
| Data Analysis: | M. Shadab Siddiqui and Arun Sanyal |
| Pathology Review | Michael Idowu |
| Manuscript Preparation: | M. Shadab Siddiqui and Arun Sanyal |
| Manuscript Review: | Kai L. Cheang, Scott Matherly, Velimir Luketic, Puneet Puri, K. Patidar, Richard T. Stravitz, Sherry Boyett, Michael Idowu. |
Financial Disclosure: None of the authors have any conflict of interest to report
References
- 1.Browning JD, Szczepaniak LS, Dobbins R, Nuremberg P, Horton JD, Cohen JC, Grundy SM, et al. Prevalence of hepatic steatosis in an urban population in the united states: Impact of ethnicity. Hepatology. 2004;40(6):1387–1395. doi: 10.1002/hep.20466. [DOI] [PubMed] [Google Scholar]
- 2.Brunt EM. Nonalcoholic steatohepatitis: Definition and pathology. Semin Liver Dis. 2001;21(1):3–16. doi: 10.1055/s-2001-12925. [DOI] [PubMed] [Google Scholar]
- 3.Adams LA, Lymp JF, St Sauver J, Sanderson SO, Lindor KD, Feldstein A, Angulo P. The natural history of nonalcoholic fatty liver disease: A population-based cohort study. Gastroenterology. 2005;129(1):113–121. doi: 10.1053/j.gastro.2005.04.014. [DOI] [PubMed] [Google Scholar]
- 4.Söderberg C, Stål P, Askling J, Glaumann H, Lindberg G, Marmur J, Hultcrantz R. Decreased survival of subjects with elevated liver function tests during a 28-year follow-up. Hepatology. 2009 doi: 10.1002/hep.23314. [DOI] [PubMed] [Google Scholar]
- 5.Pagano G, Pacini G, Musso G, Gambino R, Mecca F, Depetris N, Cassader M, et al. Nonalcoholic steatohepatitis, insulin resistance, and metabolic syndrome: Further evidence for an etiologic association. Hepatology. 2002;35(2):367–372. doi: 10.1053/jhep.2002.30690. [DOI] [PubMed] [Google Scholar]
- 6.Chitturi S, Abeygunasekera S, Farrell GC, Holmes-Walker J, Hui JM, Fung C, Karim R, et al. NASH and insulin resistance: Insulin hypersecretion and specific association with the insulin resistance syndrome. Hepatology. 2002;35(2):373–379. doi: 10.1053/jhep.2002.30692. [DOI] [PubMed] [Google Scholar]
- 7.Retnakaran R, Shen S, Hanley AJ, Vuksan V, Hamilton JK, Zinman B. Hyperbolic relationship between insulin secretion and sensitivity on oral glucose tolerance test. Obesity (Silver Spring) 2008;16(8):1901–1907. doi: 10.1038/oby.2008.307. [DOI] [PubMed] [Google Scholar]
- 8.Kahn SE. The relative contributions of insulin resistance and beta-cell dysfunction to the pathophysiology of type 2 diabetes. Diabetologia. 2003;46(1):3–19. doi: 10.1007/s00125-002-1009-0. [DOI] [PubMed] [Google Scholar]
- 9.Muniyappa R, Lee S, Chen H, Quon MJ. Current approaches for assessing insulin sensitivity and resistance in vivo: Advantages, limitations, and appropriate usage. Am J Physiol Endocrinol Metab. 2008;294(1):E15–E26. doi: 10.1152/ajpendo.00645.2007. [DOI] [PubMed] [Google Scholar]
- 10.Ahren B, Pacini G. Importance of quantifying insulin secretion in relation to insulin sensitivity to accurately assess beta cell function in clinical studies. Eur J Endocrinol. 2004;150(2):97–104. doi: 10.1530/eje.0.1500097. [DOI] [PubMed] [Google Scholar]
- 11.Ferrannini E, Mari A. Beta cell function and its relation to insulin action in humans: A critical appraisal. Diabetologia. 2004;47(5):943–956. doi: 10.1007/s00125-004-1381-z. [DOI] [PubMed] [Google Scholar]
- 12.Mari A, Schmitz O, Gastaldelli A, Oestergaard T, Nyholm B, Ferrannini E. Meal and oral glucose tests for assessment of beta -cell function: Modeling analysis in normal subjects. Am J Physiol Endocrinol Metab. 2002;283(6):E1159–E1166. doi: 10.1152/ajpendo.00093.2002. [DOI] [PubMed] [Google Scholar]
- 13.Cobelli C, Toffolo GM, Dalla Man C, Campioni M, Denti P, Caumo A, Butler P, et al. Assessment of beta-cell function in humans, simultaneously with insulin sensitivity and hepatic extraction, from intravenous and oral glucose tests. Am J Physiol Endocrinol Metab. 2007;293(1):E1–E15. doi: 10.1152/ajpendo.00421.2006. [DOI] [PubMed] [Google Scholar]
- 14.Matthews DR, Hosker JP, Rudenski AS, Naylor BA, Treacher DF, Turner RC. Homeostasis model assessment: Insulin resistance and beta-cell function from fasting plasma glucose and insulin concentrations in man. Diabetologia. 1985;28(7):412–419. doi: 10.1007/BF00280883. [DOI] [PubMed] [Google Scholar]
- 15.Sakaue S, Ishimaru S, Ikeda D, Ohtsuka Y, Honda T, Suzuki J, Kawakami Y, et al. Estimation of beta-cell function from the data of the oral glucose tolerance test. Am J Physiol Endocrinol Metab. 2007;292(6):E1575–E1580. doi: 10.1152/ajpendo.00341.2006. [DOI] [PubMed] [Google Scholar]
- 16.Xiang AH, Wang C, Peters RK, Trigo E, Kjos SL, Buchanan TA. Coordinate changes in plasma glucose and pancreatic beta-cell function in latino women at high risk for type 2 diabetes. Diabetes. 2006;55(4):1074–1079. doi: 10.2337/diabetes.55.04.06.db05-1109. [DOI] [PubMed] [Google Scholar]
- 17.Musso G, Gambino R, Cassader M. Lipoprotein metabolism mediates the association of MTP polymorphism with beta-cell dysfunction in healthy subjects and in nondiabetic normolipidemic patients with nonalcoholic steatohepatitis. J Nutr Biochem. 2010;21(9):834–840. doi: 10.1016/j.jnutbio.2009.06.007. [DOI] [PubMed] [Google Scholar]
- 18.Musso G, Cassader M, De Michieli F, Rosina F, Orlandi F, Gambino R. Nonalcoholic steatohepatitis versus steatosis: Adipose tissue insulin resistance and dysfunctional response to fat ingestion predict liver injury and altered glucose and lipoprotein metabolism. Hepatology. 2012;56(3):933–942. doi: 10.1002/hep.25739. [DOI] [PubMed] [Google Scholar]
- 19.Musso G, Gambino R, Biroli G, Carello M, Faga E, Pacini G, De Michieli F, et al. Hypoadiponectinemia predicts the severity of hepatic fibrosis and pancreatic beta-cell dysfunction in nondiabetic nonobese patients with nonalcoholic steatohepatitis. Am J Gastroenterol. 2005;100(11):2438–2446. doi: 10.1111/j.1572-0241.2005.00297.x. [DOI] [PubMed] [Google Scholar]
- 20.Musso G, Gambino R, Pacini G, De Michieli F, Cassader M. Prolonged saturated fat-induced, glucose-dependent insulinotropic polypeptide elevation is associated with adipokine imbalance and liver injury in nonalcoholic steatohepatitis: Dysregulated enteroadipocyte axis as a novel feature of fatty liver. Am J Clin Nutr. 2009;89(2):558–567. doi: 10.3945/ajcn.2008.26720. [DOI] [PubMed] [Google Scholar]
- 21.Chalasani N, Younossi Z, Lavine JE, Diehl AM, Brunt EM, Cusi K, Charlton M, et al. The diagnosis and management of non-alcoholic fatty liver disease: Practice guideline by the american association for the study of liver diseases, american college of gastroenterology, and the american gastroenterological association. Hepatology. 2012;55(4) doi: 10.1002/hep.25762. n/a-n/a. [DOI] [PubMed] [Google Scholar]
- 22.Kleiner DE, Brunt EM, Van Natta M, Behling C, Contos MJ, Cummings OW, Ferrell LD, et al. Design and validation of a histological scoring system for nonalcoholic fatty liver disease. Hepatology. 2005;41(6):1313–1321. doi: 10.1002/hep.20701. [DOI] [PubMed] [Google Scholar]
- 23.Prati D, Taioli E, Zanella A, Della Torre E, Butelli S, Del Vecchio E, Vianello L, et al. Updated definitions of healthy ranges for serum alanine aminotransferase levels. Ann Intern Med. 2002;137(1):1–10. doi: 10.7326/0003-4819-137-1-200207020-00006. [DOI] [PubMed] [Google Scholar]
- 24.Kotronen A, Peltonen M, Hakkarainen A, Sevastianova K, Bergholm R, Johansson LM, Lundbom N, et al. Prediction of non-alcoholic fatty liver disease and liver fat using metabolic and genetic factors. Gastroenterology. 2009;137(3):865–872. doi: 10.1053/j.gastro.2009.06.005. [DOI] [PubMed] [Google Scholar]
- 25.Siddiqui MS, Patidar KR, Boyett S, Smith PG, Sanyal AJ, Sterling RK. Validation of non-invasive methods for detecting hepatic steatosis in patients with HIV infection. Clinical Gastroenterology and Hepatology. 2014 doi: 10.1016/j.cgh.2014.06.027. [DOI] [PMC free article] [PubMed] [Google Scholar]
- 26.Matthews DR, Hosker JP, Rudenski AS, Naylor BA, Treacher DF, Turner RC. Homeostasis model assessment: Insulin resistance and beta-cell function from fasting plasma glucose and insulin concentrations in man. Diabetologia. 1985;28(7):412–419. doi: 10.1007/BF00280883. [DOI] [PubMed] [Google Scholar]
- 27.Matsuda M, DeFronzo RA. Insulin sensitivity indices obtained from oral glucose tolerance testing: Comparison with the euglycemic insulin clamp. Diabetes Care. 1999;22(9):1462–1470. doi: 10.2337/diacare.22.9.1462. [DOI] [PubMed] [Google Scholar]
- 28.Lomonaco R, Ortiz-Lopez C, Orsak B, Webb A, Hardies J, Darland C, Finch J, et al. Effect of adipose tissue insulin resistance on metabolic parameters and liver histology in obese patients with nonalcoholic fatty liver disease. Hepatology. 2012;55(5):1389–1397. doi: 10.1002/hep.25539. [DOI] [PubMed] [Google Scholar]
- 29.Gastaldelli A, Harrison SA, Belfort-Aguilar R, Hardies LJ, Balas B, Schenker S, Cusi K. Importance of changes in adipose tissue insulin resistance to histological response during thiazolidinedione treatment of patients with nonalcoholic steatohepatitis. Hepatology. 2009;50(4):1087–1093. doi: 10.1002/hep.23116. [DOI] [PubMed] [Google Scholar]
- 30.Robertson RP, Harmon J, Tran PO, Poitout V. Beta-cell glucose toxicity, lipotoxicity, and chronic oxidative stress in type 2 diabetes. Diabetes. 2004;53(Suppl 1):S119–S124. doi: 10.2337/diabetes.53.2007.s119. [DOI] [PubMed] [Google Scholar]
- 31.Yaney GC, Corkey BE. Fatty acid metabolism and insulin secretion in pancreatic beta cells. Diabetologia. 2003;46(10):1297–1312. doi: 10.1007/s00125-003-1207-4. [DOI] [PubMed] [Google Scholar]
- 32.Sattar N, Scherbakova O, Ford I, O'Reilly DS, Stanley A, Forrest E, Macfarlane PW, et al. Elevated alanine aminotransferase predicts new-onset type 2 diabetes independently of classical risk factors, metabolic syndrome, and C-reactive protein in the west of scotland coronary prevention study. Diabetes. 2004;53(11):2855–2860. doi: 10.2337/diabetes.53.11.2855. [DOI] [PubMed] [Google Scholar]
- 33.Vozarova B, Stefan N, Lindsay RS, Saremi A, Pratley RE, Bogardus C, Tataranni PA. High alanine aminotransferase is associated with decreased hepatic insulin sensitivity and predicts the development of type 2 diabetes. Diabetes. 2002;51(6):1889–1895. doi: 10.2337/diabetes.51.6.1889. [DOI] [PubMed] [Google Scholar]
- 34.Vernon G, Baranova A, Younossi ZM. Systematic review: The epidemiology and natural history of non-alcoholic fatty liver disease and non-alcholic steatohepatitis in adults. Hepatology. 2011;34(3):274–285. doi: 10.1111/j.1365-2036.2011.04724.x. [DOI] [PubMed] [Google Scholar]
- 35.Ratziu V, Charlotte F, Bernhardt C, Giral P, Halbron M, Lenaour G, Hartmann-Heurtier A, et al. Long-term efficacy of rosiglitazone in nonalcoholic steatohepatitis: Results of the fatty liver improvement by rosiglitazone therapy (FLIRT 2) extension trial. Hepatology. 2010;51(2):445–453. doi: 10.1002/hep.23270. [DOI] [PubMed] [Google Scholar]
- 36.Fracanzani AL, Valenti L, Bugianesi E, Andreoletti M, Colli A, Vanni E, Bertelli C, et al. Risk of severe liver disease in nonalcoholic fatty liver disease with normal aminotransferase levels: A role for insulin resistance and diabetes. Hepatology. 2008;48(3):792–798. doi: 10.1002/hep.22429. [DOI] [PubMed] [Google Scholar]


