

Abstract
Objective
Friedreich ataxia (FRDA) is an autosomal recessive neurodegenerative disease caused in almost all cases by homozygosity for a GAA trinucleotide repeat expansion in the frataxin gene. Frataxin is a mitochondrial protein involved in iron homeostasis. FRDA patients have a high prevalence of diabetes, the pathogenesis of which is not known. We aimed to evaluate the relative contribution of insulin resistance and β-cell failure and the pathogenic mechanisms involved in FRDA diabetes.
Methods
Forty-one FRDA patients, 26 heterozygous carriers of a GAA expansion, and 53 controls underwent oral and intravenous glucose tolerance tests. β-Cell proportion was quantified in postmortem pancreas sections from 9 unrelated FRDA patients. Using an in vitro disease model, we studied how frataxin deficiency affects β-cell function and survival.
Results
FRDA patients had increased abdominal fat and were insulin resistant. This was not compensated for by increased insulin secretion, resulting in a markedly reduced disposition index, indicative of pancreatic β-cell failure. Loss of glucose tolerance was driven by β-cell dysfunction, which correlated with abdominal fatness. In postmortem pancreas sections, pancreatic islets of FRDA patients had a lower β-cell content. RNA interference–mediated frataxin knockdown impaired glucose-stimulated insulin secretion and induced apoptosis in rat β cells and human islets. Frataxin deficiency sensitized β cells to oleate-induced and endoplasmic reticulum stress-induced apoptosis, which could be prevented by the incretins glucagon-like peptide-1 and glucose-dependent insulinotropic polypeptide.
Interpretation
Pancreatic β-cell dysfunction is central to diabetes development in FRDA as a result of mitochondrial dysfunction and higher sensitivity to metabolic and endoplasmic reticulum stress-induced β-cell death.
Friedreich ataxia (FRDA) is an autosomal recessive disease characterized by progressive ataxia, both afferent and cerebellar, dysarthria, oculomotor abnormalities, and pyramidal weakness. Non-neurological manifestations include hypertrophic cardiomyopathy, skeletal deformities, in particular kyphoscoliosis, and diabetes.1,2 FRDA is most often (>95% of patients) caused by homozygosity for an unstable GAA repeat expansion in the first intron of the frataxin gene (FXN).3 Normal chromosomes usually have <30 GAA repeats, whereas FRDA chromosomes carry from 70 to >1,000 triplets, impairing frataxin transcription via heterochromatin silencing.3,4 FRDA patients have a 65 to 95% decrease in frataxin, whereas heterozygous carriers have around 50% of normal levels.3,5 Reduced frataxin expression is causative of the whole complex clinical and pathological FRDA phenotype.6 Residual frataxin levels are determined by the GAA repeat size of the smaller of the 2 alleles, which allows most of the residual gene expression.7 The size of the smaller GAA expansion is correlated with age at onset, severity of neurological symptoms, and cardiomyopathy.1,8
Frataxin is a mitochondrial protein. It acts as an allosteric switch activating iron–sulfur cluster biogenesis.9–11 Other postulated functions in iron detoxification,12 heme synthesis, activation of respiratory function,13 and antioxidant defenses14 are less well established.
Frataxin deficiency causes mitochondrial iron overload15 and impairs the synthesis of iron–sulfur cluster-containing proteins, including respiratory chain complexes I, II, and III, and aconitases. Respiratory chain dysfunction impairs oxidative phosphorylation and adenosine triphosphate (ATP) generation, and promotes oxidative damage.9,15 Mitochondrial dysfunction also plays a central role in other neurodegenerative diseases, in the aging process itself, and in many age-related pathologies such as type 2 diabetes (T2D).16,17
Ten to 30% of FRDA patients develop overt diabetes, and 30% have impaired glucose tolerance (IGT),18–20 but the cause(s) of this metabolic dysfunction remains to be clarified. An early case report described an FRDA patient with fulminant ketoacidosis, the hallmark of absolute insulin deficiency.21 One causal factor for FRDA diabetes was proposed to be nonautoimmune β-cell loss.22 Other studies reported no difference in insulin output,23 and demonstrated insulin resistance at the whole body and cellular level.19,24–26 Using 31P magnetic resonance spectroscopy, impaired muscular mitochondrial function was demonstrated in vivo in FRDA patients,27,28 similar to findings in insulin-resistant offspring of T2D patients.29 Heterozygous carriers were also reported to be insulin resistant,30 and intermediate GAA repeat length has been associated with T2D in some31 but not all studies.32,33
FRDA mouse models have generated conflicting results. Transcriptomic profiling of muscle and liver from frataxin knockin/knockout (KIKO) mice (frda−/230GAA with 65–75% decreased frataxin levels34) suggested that downregulation of the transcription coactivator peroxisome proliferator-activated receptor gamma coactivator-1α (PGC-1α), a key regulator of mitochondrial biogenesis and oxidative metabolism, links frataxin deficiency to insulin resistance and diabetes.24 The conditional islet frataxin knockout mouse, however, develops diabetes due to oxidative stress and pancreatic β-cell apoptosis.35 Complete loss of frataxin is not compatible with life, as demonstrated by the embryonic lethality of systemic knockout animal models,36 and complete disruption of frataxin in islets (or other tissues) may lead to particular phenotypes with uncertain clinical relevance.
The aim of this study was to elucidate the pathogenic mechanisms of IGT and diabetes in human FRDA and heterozygous carriers. We demonstrate that FRDA patients are insulin resistant, but that β-cell dysfunction and death are the key contributors to diabetes. In vitro models identify the role of mitochondrial dysfunction and metabolic stress-induced β-cell apoptosis, a process potentially mediated by endoplasmic reticulum (ER) stress.
Subjects and Methods
Human Studies
Patients were contacted via neurologists in reference centers and through FRDA patient associations. Probands were from 34 different families in 7 countries. To avoid the confounding effect of diabetes treatment, patients with a clinical diagnosis of diabetes were excluded. First-degree relatives were invited to participate following positive patient response and allocated to control or carrier group depending on genotype. Healthy volunteers not known to have diabetes were recruited by advertisement mostly among hospital personnel. The study was performed in accordance with the principles of the Declaration of Helsinki and approved by the Ethical Committee of the Erasmus Hospital. All participants gave written informed consent.
Overnight fasting subjects underwent oral glucose tolerance test (OGTT) and intravenous (IV) glucose tolerance test (IVGTT) as described in Supplementary Methods. The insulin sensitivity index (SI) was quantified using the minimal model,37 and insulin secretion as the acute insulin response to glucose (AIRg). The disposition index, a measure of β-cell adaptation to the prevailing insulin sensitivity, was calculated as AIRg × SI.38
Respiratory gas exchanges were measured by indirect calorimetry (Deltatrac; Datex, Helsinki, Finland). Resting energy expenditure (REE) was calculated from VCO2, VO2, and 24-hour urinary nitrogen output using standard equations.39 At the end of 1 of the GTTs, 20μCi 3H2O was injected, and blood was sampled 3 hours later to determine total body water volume. Fat-free body mass was calculated as body water divided by 0.73.40 To calculate the predicted REE of FRDA patients, a linear regression equation between REE and fat-free mass was generated for control subjects.41,42
A standardized neurological examination was performed using the Friedreich’s Ataxia Clinical Trial Scale (FACTS). This score assesses the degree of motor impairment and can account for disease-related reductions in physical activity. FACTS is an early version of the Friedreich’s Ataxia Rating Scale (FARS), which was validated after the initiation of this study.43 It contains the stance, gait, and upper and lower limb kinetic scores of FARS, its activities of daily living (ADL) score, and the Schwab and England degree of disability for ADL.44
The frataxin GAA expansion size was quantified by polymerase chain reaction.45
Quantification of Islet β-Cell Area
Postmortem paraffin-embedded pancreas sections from 9 unrelated FRDA patients, 3 of whom had received a clinical diagnosis of diabetes, and 9 nondiabetic controls were immunostained for insulin. Immunohistochemical expression was quantified as described in Supplementary Methods. To calculate islet β-cell proportion, the insulin-positive and total islet area was quantified using a Definiens (Munich, Germany) TissueMap 3.0 routine.
Experiments with INS-1E Cells, Fluorescence-Activated Cell Sorting–Purified Primary Rat β Cells, and Human Islets
These are described in Supplementary Methods and Supplementary Tables 1–3.
Statistical Analysis
Data are presented as means ± standard error. Comparison of groups was done by 2-sided Student unpaired t test. A p value <0.05 was considered statistically significant.
Results
Glucose Tolerance, Insulin Sensitivity, and β-Cell Function in FRDA Patients, Carriers, and Controls
Glucose tolerance was evaluated in 41 FRDA patients not known to have diabetes and in 53 healthy control subjects using OGTT and IVGTT. Patients and controls were well matched for age; the body mass index (BMI) of FRDA patients tended to be lower (p = 0.06, Table 1).
TABLE 1.
Characteristics of Controls, Friedreich Ataxia Patients, and Carriers
| Characteristic | Controls | Patients | Carriers |
|---|---|---|---|
| No. | 53 | 41 | 26 |
| Gender | 17 M (32%) | 19 M (46%) | 9 M (33%) |
| Age, yr | 36 ± 2 | 36 ± 2 | 46 ± 3a,b |
| BMI, kg/m2 | 24.9 ± 0.7 | 23.0 ± 0.6 | 25.9 ± 1.0b |
| Waist, women, cm | 82 ± 2 | 86 ± 3 | 87 ± 2 |
| Fat mass, women, % body weight | 32 ± 1 | 35 ± 2 | 32 ± 2 |
| Waist, men, cm | 95 ± 3 | 89 ± 3 | 101 ± 5c |
| Fat mass, men, % body weight | 21 ± 2 | 24 ± 2 | 26 ± 3 |
| REE, % predicted value | 100 ± 1 | 96 ± 3 | 99 ± 2 |
| Systolic BP, mmHg | 112 ± 2 | 110 ± 2 | 117 ± 3c |
| Diastolic BP, mmHg | 67 ± 2 | 67 ± 2 | 70 ± 2d |
| Pulse, per minute | 71 ± 1 | 80 ± 2e | 70 ± 2b |
| GAA expansion smaller allele | — | 550 ± 42 | — |
| GAA expansion larger allele | — | 828 ± 49 | 611 ± 70 |
Data are means ± standard error.
Significantly different from controls, p < 0.01.
Significantly different from patients, p < 0.01.
Significantly different from patients, p < 0.05.
Significantly different from controls, p < 0.05.
Significantly different from controls, p < 0.001.
BMI = body mass index; BP = blood pressure; M =male;
REE = resting energy expenditure.
Fasting glycemia was not significantly different between groups, but oral glucose tolerance was worse in FRDA patients (60–120 minutes, Fig 1A). Forty-nine percent of FRDA patients had impaired fasting glucose and/or IGT, and 12% had diabetes, compared to 32% and 1% of controls, respectively. FRDA patients were insulin resistant, with a 30% lower SI and fasting hyperinsulinemia (see Fig 1B, C). To examine whether insulin resistance was related to changes in body composition, we measured body fat mass by injection of 3H2O. There was no difference in body composition between patients and controls (see Table 1). REE was measured by indirect calorimetry. To examine whether FRDA patients had a preserved REE relative to their fat-free mass, we used a regression-based approach to calculate predicted REE. REE values of FRDA patients fell along the same regression line as that of healthy controls (Fig 2). Accordingly, their measured REE was not significantly different from the predicted value (see Table 1).
FIGURE 1.

Glucose tolerance, insulin sensitivity, and insulin secretion in Friedreich ataxia (FRDA) patients, heterozygous carriers, and controls. Forty-one nondiabetic FRDA patients (blue), 26 carriers (green), and 53 controls (black) underwent (A, B) oral glucose tolerance test and (C) intravenous glucose tolerance test. Means ± standard error in A and B were compared by unpaired t test; *p < 0.05, **p < 0.01 versus control; brackets indicate significantly different areas under the curve. The insulin sensitivity index (SI) was calculated using the minimal model of glucose kinetics. The large circles in C represent the geometric means for SI and the acute insulin response to glucose for the 3 groups. The hyperbola represents the average β-cell function of the controls.
FIGURE 2.

Relationship between resting energy expenditure (REE) and fat-free mass. REE was measured by indirect calorimetry in 41 Friedreich ataxia patients (blue), 26 carriers (green), and 53 controls (black) and expressed per kilogram of fat-free mass. Regression lines are shown for patients (blue) and controls (black).
Because FRDA patients tended to have a lower BMI, a subgroup analysis was performed matching patients and controls for age, gender, and BMI (Table 2). The FRDA patients had a 45% lower SI and 20 to 40% more body fat in women and men, respectively. Body fat accumulation was abdominal, with no change in hip but a trend for increased waist circumference. To examine the role of the increased adiposity in insulin resistance, FRDA patients and controls were matched for age, gender, and body fat content. In this subset of subjects, the difference in SI was smaller (25% lower in FRDA patients, p = 0.14, Supplementary Table 4), showing that increased body fatness contributes to insulin resistance.
TABLE 2.
Characteristics of Friedreich Ataxia Patients and Controls Matched for Age, Gender, and BMI
| Characteristic | Controls | Patients |
|---|---|---|
| No. | 32 | 32 |
| Gender | 13 M (41%) | 13 M (41%) |
| Age, yr | 34 ± 2 | 38 ± 2 |
| BMI, kg/m2 | 24.0 ± 0.7 | 24.0 ± 0.6 |
| Waist, women, cm | 81 ± 3 | 89 ± 3 |
| Fat mass, women, % body weight | 31 ± 2 | 37 ± 2a |
| Waist, men, cm | 91 ± 3 | 95 ± 3 |
| Fat mass, men, % body weight | 19 ± 3 | 27 ± 2a |
| REE, % predicted value | 99 ± 2 | 95 ± 3 |
| Systolic BP, mmHg | 109 ± 3 | 109 ± 3 |
| Diastolic BP, mmHg | 64 ± 2 | 67 ± 2 |
| Pulse, per minute | 69 ± 2 | 79 ± 2b |
| GAA expansion smaller allele | — | 540 ± 50 |
| GAA expansion larger allele | — | 835 ± 55 |
| SI, × 10−5 min−1/(μU/ml) | 28 ± 2 | 15 ± 2b |
| AIRg, μU ml | 56 ± 7 | 52 ± 10 |
| Disposition index, × 10−5 min−1 | 1,564 ± 165 | 782 ± 19c |
Data are means ± standard error.
p < 0.05,
p < 0.001,
p < 0.01.
AIRg = acute insulin response to glucose; BMI = body mass index; BP = blood pressure; M = male; REE = resting energy expenditure; SI = insulin sensitivity index.
Physiologically, insulin secretion by pancreatic β cells is increased in a compensatory manner in the face of insulin resistance to maintain normal glucose levels.38 In the FRDA patients, however, insulin levels during the OGTT and the IVGTT-derived AIRg were not different from controls (see Fig 1B, C). Calculation of the disposition index, a measure of β-cell function adjusted for the individual’s insulin sensitivity,38 indicated that FRDA patients had a highly significantly lower disposition index (862 ± 165 vs 1507 ± 149 × 10−5min−1 in controls, p < 0.01), suggesting that they have an important impairment in pancreatic β-cell function.
To study a frataxin gene–dose effect, we also recruited heterozygous carriers of a GAA expansion among FRDA patient’s relatives (n = 26). Often recruited from the parents of patients, this group was older than patients and controls, and heavier (see Table 1); 46% had impaired fasting glucose and/or IGT, and 4% had diabetes. Carriers had similar insulin sensitivity to controls (see Fig 1C) but had lower insulinemia during the OGTT (see Fig 1B) and a trend for lower AIRg (46 ± 9 vs 59 ± 7 μU/ml, p = 0.11) and disposition index (1,182 ± 128 vs 1,507 ± 149 × 10−5 min−1, p = 0.07). In a subgroup analysis of carriers and controls pair-matched for age, there was no difference in BMI, body fat content and distribution, basal energy expenditure, or glucose tolerance, but the trend for lower β-cell function persisted (p = 0.11, Table 3).
TABLE 3.
Characteristics of Heterozygous Carriers of 1 GAA Expansion in Frataxin and Controls Matched for Age
| Characteristic | Controls | Carriers |
|---|---|---|
| No. | 26 | 26 |
| Gender | 9 M (33%) | 9 M (33%) |
| Age, yr | 45 ± 2 | 46 ± 3 |
| BMI, kg/m2 | 26.4 ± 0.8 | 25.9 ± 1.0 |
| Waist, women, cm | 87 ± 3 | 87 ± 2 |
| Fat mass, women, % body weight | 33 ± 2 | 32 ± 2 |
| Waist, men, cm | 102 ± 4 | 101 ± 5 |
| Fat mass, men, % body weight | 25 ± 2 | 26 ± 3 |
| REE, % predicted value | 98 ± 2 | 99 ± 2 |
| Systolic BP, mmHg | 117 ± 3 | 117 ± 3 |
| Diastolic BP, mmHg | 73 ± 2 | 70 ± 2 |
| Pulse, per minute | 68 ± 2 | 70 ± 2 |
| SI, × 10−5 min−1/(μU/ml) | 26 ± 2 | 26 ± 2 |
| AIRg, μU ml | 55 ± 7 | 46 ± 10 |
| Disposition index, × 10−5 min−1 | 1,424 ± 271 | 1,182 ± 128 |
Data are means ± standard error.
AIRg = acute insulin response to glucose; BMI = body mass index; BP = blood pressure; M = male; REE = resting energy expenditure; SI = insulin sensitivity index.
Relative Role of Insulin Resistance and β-Cell Dysfunction in IGT in FRDA
By multiple regression analysis, we analyzed the associations between several patient characteristics and insulin sensitivity or β-cell function. Multiple linear regression models were built for SI or disposition index that simultaneously analyzed associations with age and gender, body fat content and distribution, FRDA duration and severity, and the smaller GAA size. Insulin resistance was correlated with a positive family history of T2D and FRDA disease duration (Table 4). The disposition index was negatively correlated with waist circumference, suggesting that abdominal fatness contributes to β-cell dysfunction (see Table 4).
TABLE 4.
Multiple Linear Regression Analysis of the Relationships between Insulin Sensitivity or Disposition Index with Body Fat Distribution and FRDA Disease Severity
| Independent Variables | SI | Disposition Index | ||
|---|---|---|---|---|
| Coefficient | p | Coefficient | p | |
| Age | 0.24 | 0.24 | 0.09 | 0.73 |
| Gender | 0.16 | 0.35 | −0.06 | 0.77 |
| Family history of diabetes | −0.39a | 0.004 | −0.29 | 0.07 |
| % body fat | −0.16 | 0.42 | 0.30 | 0.25 |
| Waist circumference | −0.31 | 0.06 | −0.48a | 0.03 |
| FRDA duration | −0.41a | 0.02 | −0.24 | 0.29 |
| Neurological impairment score | −0.36 | 0.11 | −0.46 | 0.11 |
| GAA expansion repeat number | 0.51 | 0.06 | 0.64 | 0.06 |
The dependent variables are SI and loge disposition index. The model r2 are 0.63 and 0.41, respectively. Sex was coded (0, 1), with the higher number indicating female sex. Family history was coded as (0, 1), with the higher number indicating positive family history for diabetes. GAA expansion repeat number is the size of the smaller FXN allele. The standardized regression coefficient and the p value for the association are given.
Significant correlations.
FRDA = Friedreich ataxia.
Multiple regression analysis was also used to determine which variables were significantly associated with glucose tolerance after adjusting for potentially confounding variables such as age, gender, and adiposity (Table 5). The measure of IV glucose tolerance, the glucose disappearance constant Kg, was strongly and positively correlated with the disposition index and inversely with disease duration, suggesting that FRDA entails loss of glucose tolerance over time. Kg was also unexpectedly inversely correlated with SI. Measures of oral glucose tolerance were solely associated with disposition index.
TABLE 5.
Multiple Linear Regression Analysis of the Relationships between Glucose Tolerance and Body Fat Distribution, FRDA Severity, Insulin Sensitivity, and Disposition Index
| Independent Variables | Kg | Glucose at 120 minutes | AUC glucose | |||
|---|---|---|---|---|---|---|
| Coefficient | p | Coefficient | p | Coefficient | p | |
| Age | 0.16 | 0.43 | 0.06 | 0.82 | 0.00 | 0.99 |
| Gender | 0.10 | 0.56 | −0.24 | 0.29 | −0.34 | 0.15 |
| Family history of diabetes | 0.04 | 0.80 | 0.12 | 0.51 | 0.15 | 0.43 |
| % body fat | −0.31 | 0.14 | 0.23 | 0.38 | 0.28 | 0.31 |
| Waist circumference | −0.07 | 0.66 | 0.13 | 0.55 | −0.36 | 0.12 |
| FRDA duration | −0.40a | 0.04 | −0.07 | 0.76 | 0.06 | 0.80 |
| Neurological score | 0.34 | 0.14 | 0.51 | 0.10 | 0.14 | 0.64 |
| GAA repeat number | −0.00 | 1.00 | −0.12 | 0.73 | 0.08 | 0.82 |
| SI | −0.43a | 0.03 | 0.23 | 0.36 | 0.15 | 0.56 |
| Disposition index | 0.90a | <0.001 | −0.48a | 0.01 | −0.58a | 0.004 |
The dependent variables are the measures of intravenous glucose tolerance Kg, impaired oral glucose tolerance loge glycemia at 120 minutes, and incremental AUC for glucose. The model r2 are 0.68, 0.45, and 0.42, respectively. Sex was coded (0, 1), with the higher number indicating female sex. Family history was coded as (0, 1), with the higher number indicating positive family history for diabetes. GAA repeat number is the size of the smaller FXN allele. The standardized regression coefficient and the p value for the association are given.
Significant correlations.
AUC = area under the curve; FRDA = Friedreich ataxia; Kg = glucose disappearance constant; SI = sensitivity index.
In individuals matched for body fat content, the difference in SI was lessened, but the FRDA patients still had impaired glucose tolerance (p < 0.05) and a lower disposition index (see Supplementary Table 4). Taken together, these analyses demonstrate that loss of glucose tolerance in FRDA is primarily driven by decreased β-cell function.
β-Cell Loss in FRDA
To examine whether the insulin secretory defect results from reduced β-cell mass, islet β-cell area was quantified in postmortem pancreas from 9 unrelated FRDA patients and 9 age-matched controls. Of the 9 FRDA patients, 3 had received a clinical diagnosis of diabetes during their lifetime. Representative images of insulin-positive β cells in islets of Langerhans are shown in Figure 3A–D. Compared to control islets, FRDA islets had a significantly lower β-cell area proportion (see Fig 3E, p = 0.015). Whereas the insulin area was smaller, the insulin staining intensity in FRDA islets was similar to controls (data not shown). The area proportion of glucagon-producing α cells was not different between FRDA and control islets (data not shown). We next used in vitro models to characterize the mechanisms involved in decreased functional β-cell mass in FRDA.
FIGURE 3.
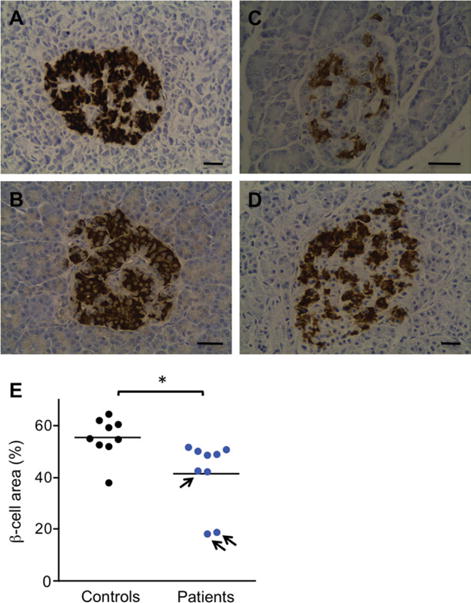
Pancreatic islet β-cell proportion in Friedreich ataxia (FRDA) patients and controls. Representative images of islets of Langerhans in pancreas sections stained for insulin from 2 controls (A, 22-year-old male; B, 59-year-old female) and 2 FRDA patients (C, 24-year-old male, known to have had diabetes; D, 64-year-old nondiabetic female). Bars = 40μm. (E) β-Cell area proportion (percentage of islet area) was quantified in postmortem pancreas from 9 FRDA patients (blue symbols) and 9 age-matched controls (black symbols). The arrows indicate 3 FRDA patients with a clinical diagnosis of diabetes. *p < 0.05 versus controls. The difference remains statistically significant when the 2 lower FRDA patient data points are removed.
Frataxin Deficiency Impairs β-Cell Function and Sensitizes β Cells to Apoptosis
Frataxin was silenced in clonal and primary rat β cells and dispersed human islet cells using RNA interference. Frataxin mRNA and protein expression was reduced by 70% and 40 to 55%, respectively (Supplementary Fig 1). Frataxin-deficient INS-1E cells tended to have increased insulin content (Fig 4), suggesting that frataxin deficiency does not impair insulin synthesis in β cells. The knockdown did not modify basal insulin secretion, but it reduced glucose-or glucose + forskolin-stimulated insulin secretion, in keeping with recent findings in human islets.46 Glucose-stimulated ATP production, which regulates insulin secretion, was impaired in frataxin-deficient β cells. In addition, frataxin depletion reduced mitochondrial membrane potential in β cells (Supplementary Fig 2). These results are consistent with mitochondrial dysfunction.
FIGURE 4.

Glucose-induced insulin secretion and adenosine triphosphate (ATP) production are reduced in frataxin (Fx)-deficient β-cells. Frataxin was silenced by siRNA in INS-1E cells. Three days later, (A, B) glucose-induced insulin secretion and (C–E) ATP production were examined. (A) Insulin content corrected for total protein. (B) Insulin secretion, expressed as percentage of insulin content, was induced by 1.67 or 16.7mM glucose or 16.7mM glucose + 10μM forskolin (16.7mM + FK). The results are means ± standard error (SE) of 4 independent experiments. (C–D) ATP/adenosine diphosphate (ADP) ratio and (E) total cellular ATP measured by luciferase-driven bioluminescence after (C) 5 or (D, E) 30 minutes incubation in the presence of 1.67 or 16.7mM glucose. The results are means ± SE of 6 to 8 independent experiments; *16.7mM or 16.7mM ± FK versus 1.67mM; §frataxin siRNA versus control siRNA (siCT). One symbol, p < 0.05; 2 symbols, p < 0.01 by paired t test.
Because islet β-cell proportion is decreased in FRDA patients, we examined whether frataxin depletion sensitizes pancreatic β cells to apoptosis. Frataxin knockdown increased apoptosis in clonal and primary rat β cells in the control condition and after exposure to the free fatty acid (FFA) oleate (Fig 5). In keeping with these findings, frataxin knockdown increased basal and oleate-induced caspase 3 activation. Similarly, human islet cells were sensitized to apoptosis, basally and following oleate exposure. Frataxin knockdown did not sensitize β cells to oxidative stress (Supplementary Fig 3) but did sensitize to ER stress induced by chemicals that elicit ER stress through different mechanisms. Interestingly, the glucagon-like peptide-1 (GLP-1) analog exendin-4 and the dipeptidyl peptidase 4–resistant [D-Ala2] analog of glucose-dependent insulinotropic polypeptide (GIP) partially protected frataxin-deficient β cells from cyclopiazonic acid (CPA)-induced apoptosis. The adenylyl cyclase stimulator forskolin reproduced this effect more potently and additionally protected frataxin-deficient β cells from metabolic stress induced by oleate.
FIGURE 5.

Frataxin knockdown sensitizes β-cells to metabolic and endoplasmic reticulum (ER) stress-induced apoptosis, which can be prevented by cyclic adenosine monophosphate inducers. (A, D–F) INS-1E, (B) primary rat β-cells, or (C) dispersed human islets were transfected with control siRNA (siCT) or siRNAs targeting rat (FxA or FxB) or human frataxin (Fx1 or Fx2). The cells were cultured for 24 hours in the presence or absence (CT) of oleate (OL) or the ER stressors cyclopiazonic acid (CPA), tunicamycin (Tuni), or brefeldin (Bref). Apoptosis was examined (A–C, F, G) by Hoechst 33342/propidium iodide staining or (D, E) by Western blot for cleaved caspase 3. (A–C, F, G) The results are means ± standard error of 4 to 16 independent experiments. (D) The blots are representative of 10 independent experiments. (E) Densitometry of cleaved caspase 3 was normalized for protein loading by α-tubulin. (G) Frataxin was silenced in INS-1E cells using FxB siRNA. Forty-eight hours after transfection, the cells were pretreated for 2 hours with dimethylsulfoxide (CT), 100nM [D-Ala2]-glucose-dependent insulinotropic polypeptide (GIP), 50nM exendin 4, or 20μM forskolin and then exposed or not exposed to oleate or CPA alone or combined with [D-Ala2]-GIP, exendin 4, or forskolin for 24 hours. *Treated versus CT; §frataxin siRNA versus siCT; #oleate or CPA alone versus in combination with GIP, exendin, or forskolin. One symbol, p < 0.05; 2 symbols, p < 0.01; 3 symbols p < 0.001 by analysis of variance followed by paired t test with Bonferroni correction for multiple comparisons.
Discussion
The cause of diabetes in FRDA has remained a mystery since the original description of this metabolic disorder in 10 to 30% of patients. We have used a combined clinical and basic research approach to clarify the pathogenesis of diabetes in FRDA, including state-of-the-art methods to assess the relative contribution of insulin resistance and β-cell dysfunction and mechanistic studies in models of frataxin deficiency.
The converging findings obtained using these approaches indicate that: (1) pancreatic β-cell dysfunction is central to the loss of glucose tolerance in FRDA; (2) the loss of β-cell function in FRDA patients was correlated with abdominal fatness; (3) examination of very rare postmortem FRDA pancreas samples reveals a decrease in islet β-cell content; and (4) in vitro models of β-cell frataxin deficiency identify both functional defects and increased sensitivity to apoptosis induced by oleate and ER stressors.
Diabetes can result from insulin deficiency, insulin resistance in muscle, liver, and fat, or a combination of both, as has been learned from common forms of diabetes. Diabetes in FRDA has been attributed to insulin deficiency,21,22 but more recently emphasis was placed on the role of insulin resistance, with some studies reporting normal insulin secretion.19,23–28,47 The present study confirms that FRDA patients, although young and having a rather low BMI, have increased body fat and are insulin resistant. Thus, if only BMI is considered, their metabolic risk will be underestimated. In a subgroup analysis of individuals matched for body fat, BMI was lower in patients by 3kg/m2; the difference in insulin sensitivity became nonsignificant. We previously reported that insulin sensitivity was inversely correlated with the length of the GAA repeat expansion in the smaller frataxin allele.24 In this previous study, only 14 patients were examined, and with the increase in patient number to 41 (present data) the association with GAA repeat number is no longer present. The correlation with a positive family history for diabetes (see Table 4) suggests that secondary modifier gene variants might play a role in the development of diabetes in FRDA.
A previous study of 10 heterozygous carriers reported the presence of insulin resistance measured using the infusion of glucose, insulin, and octreotide.30 Here, we find superimposable insulin sensitivity in carriers and controls using IVGTT. These discrepancies underscore the need for large numbers of subjects, even for studies of rare diseases such as FRDA.
This is the first study to report that REE is preserved in a mitochondrial disease, even in severely affected patients. In a previous study, the rate of mitochondrial ATP production in muscle of FRDA patients was reduced during exercise, as assessed by in vivo 31P magnetic resonance spectroscopy, whereas at rest the defect was barely detectable due to the low resting oxidative metabolism of muscle.27 In keeping with this concept, insulin-resistant offspring of T2D patients have 30% lower insulin-stimulated mitochondrial ATP synthesis but normal REE, basally or during a hyperinsulinemic clamp.48 Conversely, endurance training has no effect on REE, despite a 50% increase in basal mitochondrial substrate oxidation in muscle.49,50 It was recently reported that patients with severe insulin resistance due to insulin receptor gene mutations have muscle mitochondrial dysfunction and high REE,51 but this may be an artifact of comparing subjects with very different fat-free mass.
The reduction in physical activity in FRDA patients due to neurological impairment probably contributes to loss of muscle mass and alterations in muscle fiber type composition, thereby favoring insulin resistance. The motor impairment will also diminish 24-hour energy expenditure52 and contribute to body fat accumulation. Our subgroup analyses suggest that increased body fat content contributes to insulin resistance in FRDA. This variable was not independently associated with SI in the multiple regression model, but waist circumference tended to be correlated with SI, pointing to the role of central adiposity (p = 0.06, see Table 4). It should be noted that KIKO mice have gene expression signatures of altered muscle fiber type composition, lipogenesis and insulin resistance, in the absence of a neurological phenotype or reduced physical activity, suggesting that mitochondrial dysfunction associated with frataxin deficiency may have direct detrimental effects.24
The present data unequivocally identify loss of functional β-cell mass as central to diabetes development in FRDA. The apparent contradiction with previous studies can be explained by the numbers of patients studied, and that these past studies were done before important concepts in the understanding of glucose homeostasis were established. One of these concepts is that insulin secretion is regulated by insulin sensitivity.37,38 Under normal conditions, β cells increase insulin release as much as needed to maintain normal glucose tolerance whatever the degree of insulin resistance. The existence of this feedback loop implies that β-cell function can only be estimated by insulin secretion after adjustment for the individual’s insulin sensitivity, as was done here. The findings in this monogenic disease share similarities with common forms of diabetes in which mitochondrial dysfunction and ER stress have also been proposed to play central roles.48,53 As in FRDA, β-cell dysfunction is present early in the pathogenesis of T2D and worsens over time.54–56 Of note, it was recently shown that islets from T2D donors have lower frataxin mRNA and protein expression.46 The cause(s) of β-cell dysfunction/death in T2D is not well understood; genetic and environmental factors including sedentary lifestyle and energy-dense diets contribute. Abdominal obesity has been linked to loss of β-cell function in T2D,54,57 and FFAs may mediate this deleterious effect. It is of interest that oleate, the most common FFA in man, induced apoptosis in frataxin-deficient β cells.
Because PGC-1α mRNA expression and interleukin (IL)-6 in skeletal muscle are inversely correlated in IGT and T2D patients, and IL-6 inhibits insulin secretion in mice,58 we compared plasma IL-6 concentrations in control and FRDA subjects. There was no difference in IL-6 levels (data not shown), making it unlikely that crosstalk by cytokines between muscle and islets mediates β-cell dysfunction in FRDA.
It is well established that frataxin deficiency leads to mitochondrial dysfunction, and this may contribute to β-cell dysfunction. Mitochondria generate ATP to stimulate insulin exocytosis and are thereby central to metabolism–secretion coupling. Metabolic stresses also converge at the mitochondria to trigger the intrinsic pathway of apoptosis. Ristow et al previously demonstrated increased reactive oxygen species and apoptosis in frataxin−/− islets.35 Production of reactive oxygen species was not assessed here. Oxidative stress may contribute to β-cell loss in FRDA, but it remains to be tested whether antioxidants delay diabetes development in FRDA or disease models. The increased sensitivity of frataxin-deficient β cells to ER stress was unexpected. The ER stress response has been linked to diabetes development by perturbing insulin synthesis and secretion, causing β-cell death and inducing insulin resistance.53 Frataxin deficiency could worsen ER stress in β cells through impaired ATP production, because ATP is required for proinsulin folding in the ER. Alternatively, frataxin deficiency may sensitize the cells to signals emanating from the stressed ER that culminate in the triggering of mitochondrial apoptosis.
The incretins GLP-1 and GIP stimulate cyclic adenosine monophosphate formation, through binding to specific G-protein–coupled receptors, and activate signaling pathways correlated with improved β-cell function and survival.59 They enhance glucose-induced insulin secretion, insulin biosynthesis, and ATP production, and protect β-cells from oxidative and ER stress-induced apoptosis.59–61 Interestingly, exendin-4 and GIP were protective for frataxin-deficient β cells, suggesting that incretin analogs may have therapeutic potential for FRDA diabetes.
In conclusion, we demonstrate here in a large cohort of patients that pancreatic β-cell dysfunction and death are central to diabetes development in FRDA. This is due to mitochondrial dysfunction and metabolic/ER stress-induced β-cell apoptosis, which can be prevented by incretin analogs. These results open the way for novel treatment strategies to prevent β-cell demise in FRDA.
Supplementary Material
Acknowledgments
This work was supported by research grants from the National Ataxia Foundation (to M.C. and A.H.K.), Friedreich’s Ataxia Research Alliance (to A.H.K.), Ataxia UK (to A.H.V.S.), European Foundation for the Study of Diabetes and Lilly European Diabetes Research Programme (to M.C.), ALFEDIAM (to M.C.), Fonds National de la Recherche Scientifique (FNRS)–Fonds de la Recherche Scientifique Medicale (to M.C., J.P.B. and D.L.E.), Diane Program (Walloon region, to J.P.B.), FNRS Télévie program (to X.M.L.), Belgian Ministry for Scientific Policy (Interuniversity Attraction Poles, to M.C. and D.L.E.), and European Union Framework Programme 7 Collaborative Projects CEED3, to M.C., BetaBat, to M.C. and D.L.E., and EFACTS (grant agreement No. 242193, to M.P.). F.M. is the recipient of a postdoctoral fellowship from FNRS, Belgium. The Center for Microscopy and Molecular Imaging (CMMI) is supported by the European Regional Development Fund and the Walloon region. The study sponsors had no role in study design, patient recruitment, data collection, analysis, interpretation, or writing of the paper.
We thank the FRDA patients and their families for participating in the study; the Belgian and French patient associations for help in subject recruitment; A. Hamouda for excellent assistance during the patient studies; and M.-A. Neef, S. Mertens, R. Makhnas, E. Carlier, and M. Authelet for expert technical assistance.
Footnotes
Additional supporting information can be found in the online version of this article.
Authorship
M.C. and M.I.-E. share first authorship. M.C. and F.F. designed and carried out the clinical study. A.B., Y.S., C.D., and M.P. helped with the data collection. M.R. performed polymerase chain reaction. I.M., D.L., and A.C. analyzed the islet β-cell proportion in postmortem samples that were collected and provided by A.H.V.S., J.M.C., and A.H.K.; X.M.L. designed a tool for the analysis. M.C., M.I.-E., M.P., and D.L.E. designed the study of models of frataxin deficiency. M.I.-E., Y.S., A.E.M., L.L., F.M., and P.M. established and used the in vitro models. J.-P.B. assisted with electron microscopy. M.C., M.I.-E., M.P., D.L.E., and F.F. analyzed the data, interpreted, and discussed the results, and wrote the paper. All authors had full access to all the data and commented on the paper. The corresponding author acts as guarantor.
Potential Conflicts of Interest
M.C.: travel expenses, Novo Nordisk. M.R.: grants/grants pending, European Commission. C.D.: grants/grants pending, travel expenses, UCB Pharma. J.M.C.: employment, University College London; grants/grants pending, Parkinson’s UK, MRC/Wellcome Trust, Brain Research Trust. A.H.V.S.: royalties, Elsevier, Wiley-Blackwell, OUP; paid educational presentations, BI, GSK, Teva-Lundbeck, Orion-Novartis, Merck, UCB. P.M.: board membership, MSD, Sanofi Aventis; grants/grants pending, MSD, BMS, Sanofi Aventis; speaking fees, Eli Lilly, Guidotti. M.P.: board membership, Santhera, Apopharma, DSMB membership for Repligen; grants/grants pending, European Commission, Friedreich’s Ataxia Research Alliance, Repligen; speaking fees, Santhera; royalties, Athena Diagnostics. F.F.: board membership, Bristol-Myers Squibb, Merck Sharp & Dohme, Eli Lilly, Novo Nordisk.
References
- 1.Durr A, Cossee M, Agid Y, et al. Clinical and genetic abnormalities in patients with Friedreich’s ataxia. N Engl J Med. 1996;335:1169–1175. doi: 10.1056/NEJM199610173351601. [DOI] [PubMed] [Google Scholar]
- 2.Schulz JB, Boesch S, Burk K, et al. Diagnosis and treatment of Friedreich ataxia: a European perspective. Nat Rev Neurol. 2009;5:222–234. doi: 10.1038/nrneurol.2009.26. [DOI] [PubMed] [Google Scholar]
- 3.Campuzano V, Montermini L, Molto MD, et al. Friedreich’s ataxia: autosomal recessive disease caused by an intronic GAA triplet repeat expansion. Science. 1996;271:1423–1427. doi: 10.1126/science.271.5254.1423. [DOI] [PubMed] [Google Scholar]
- 4.Pandolfo M. The molecular basis of Friedreich ataxia. Adv Exp Med Biol. 2002;516:99–118. doi: 10.1007/978-1-4615-0117-6_5. [DOI] [PubMed] [Google Scholar]
- 5.Herman D, Jenssen K, Burnett R, et al. Histone deacetylase inhibitors reverse gene silencing in Friedreich’s ataxia. Nat Chem Biol. 2006;2:551–558. doi: 10.1038/nchembio815. [DOI] [PubMed] [Google Scholar]
- 6.Koeppen AH. Friedreich’s ataxia: pathology, pathogenesis, and molecular genetics. J Neurol Sci. 2011;303:1–12. doi: 10.1016/j.jns.2011.01.010. [DOI] [PMC free article] [PubMed] [Google Scholar]
- 7.Campuzano V, Montermini L, Lutz Y, et al. Frataxin is reduced in Friedreich ataxia patients and is associated with mitochondrial membranes. Hum Mol Genet. 1997;6:1771–1780. doi: 10.1093/hmg/6.11.1771. [DOI] [PubMed] [Google Scholar]
- 8.Filla A, De Michele G, Cavalcanti F, et al. The relationship between trinucleotide (GAA) repeat length and clinical features in Friedreich ataxia. Am J Hum Genet. 1996;59:554–560. [PMC free article] [PubMed] [Google Scholar]
- 9.Bulteau AL, O’Neill HA, Kennedy MC, et al. Frataxin acts as an iron chaperone protein to modulate mitochondrial aconitase activity. Science. 2004;305:242–245. doi: 10.1126/science.1098991. [DOI] [PubMed] [Google Scholar]
- 10.Rotig A, de Lonlay P, Chretien D, et al. Aconitase and mitochondrial iron-sulphur protein deficiency in Friedreich ataxia. Nat Genet. 1997;17:215–217. doi: 10.1038/ng1097-215. [DOI] [PubMed] [Google Scholar]
- 11.Tsai CL, Barondeau DP. Human frataxin is an allosteric switch that activates the Fe-S cluster biosynthetic complex. Biochemistry. 2010;49:9132–9139. doi: 10.1021/bi1013062. [DOI] [PubMed] [Google Scholar]
- 12.Gakh O, Park S, Liu G, et al. Mitochondrial iron detoxification is a primary function of frataxin that limits oxidative damage and preserves cell longevity. Hum Mol Genet. 2006;15:467–479. doi: 10.1093/hmg/ddi461. [DOI] [PubMed] [Google Scholar]
- 13.Gonzalez-Cabo P, Vazquez-Manrique RP, Garcia-Gimeno MA, et al. Frataxin interacts functionally with mitochondrial electron transport chain proteins. Hum Mol Genet. 2005;14:2091–2098. doi: 10.1093/hmg/ddi214. [DOI] [PubMed] [Google Scholar]
- 14.Chantrel-Groussard K, Geromel V, Puccio H, et al. Disabled early recruitment of antioxidant defenses in Friedreich’s ataxia. Hum Mol Genet. 2001;10:2061–2067. doi: 10.1093/hmg/10.19.2061. [DOI] [PubMed] [Google Scholar]
- 15.Babcock M, de Silva D, Oaks R, et al. Regulation of mitochondrial iron accumulation by Yfh1p, a putative homolog of frataxin. Science. 1997;276:1709–1712. doi: 10.1126/science.276.5319.1709. [DOI] [PubMed] [Google Scholar]
- 16.Lin MT, Beal MF. Mitochondrial dysfunction and oxidative stress in neurodegenerative diseases. Nature. 2006;443:787–795. doi: 10.1038/nature05292. [DOI] [PubMed] [Google Scholar]
- 17.Petersen KF, Befroy D, Dufour S, et al. Mitochondrial dysfunction in the elderly: possible role in insulin resistance. Science. 2003;300:1140–1142. doi: 10.1126/science.1082889. [DOI] [PMC free article] [PubMed] [Google Scholar]
- 18.Filla A, DeMichele G, Caruso G, et al. Genetic data and natural history of Friedreich’s disease: a study of 80 Italian patients. J Neurol. 1990;237:345–351. doi: 10.1007/BF00315657. [DOI] [PubMed] [Google Scholar]
- 19.Finocchiaro G, Baio G, Micossi P, et al. Glucose metabolism alterations in Friedreich’s ataxia. Neurology. 1988;38:1292–1296. doi: 10.1212/wnl.38.8.1292. [DOI] [PubMed] [Google Scholar]
- 20.Shapcott D, Melancon S, Butterworth RF, et al. Glucose and insulin metabolism in Friedreich’s ataxia. Can J Neurol Sci. 1976;3:361–364. doi: 10.1017/s0317167100025609. [DOI] [PubMed] [Google Scholar]
- 21.Bird TD, Turner JL, Sumi SM, et al. Abnormal function of endocrine pancreas and anterior pituitary in Friedreich’s ataxia. Studies in a family. Ann Intern Med. 1978;88:478–481. doi: 10.7326/0003-4819-88-4-478. [DOI] [PubMed] [Google Scholar]
- 22.Schoenle EJ, Boltshauser EJ, Baekkeskov S, et al. Preclinical and manifest diabetes mellitus in young patients with Friedreich’s ataxia: no evidence of immune process behind the islet cell destruction. Diabetologia. 1989;32:378–381. doi: 10.1007/BF00277262. [DOI] [PubMed] [Google Scholar]
- 23.Tolis G, Mehta A, Andermann E, et al. Friedreich’s ataxia and oral glucose tolerance: I. The effect of ingested glucose on serum glucose and insulin values in homozygotes, obligate heterozygotes and potential carriers of the Friedreich’s ataxia gene. Can J Neurol Sci. 1980;7:397–400. doi: 10.1017/s0317167100022939. [DOI] [PubMed] [Google Scholar]
- 24.Coppola G, Marmolino D, Lu D, et al. Functional genomic analysis of frataxin deficiency reveals tissue-specific alterations and identifies the PPARγ pathway as a therapeutic target in Friedreich’s ataxia. Hum Mol Genet. 2009;18:2452–2461. doi: 10.1093/hmg/ddp183. [DOI] [PMC free article] [PubMed] [Google Scholar]
- 25.Fantus IG, Janjua N, Senni H, et al. Glucose intolerance in first-degree relatives of patients with Friedreich’s ataxia is associated with insulin resistance: evidence for a closely linked inherited trait. Metabolism. 1991;40:788–793. doi: 10.1016/0026-0495(91)90004-g. [DOI] [PubMed] [Google Scholar]
- 26.Khan RJ, Andermann E, Fantus IG. Glucose intolerance in Friedreich’s ataxia: association with insulin resistance and decreased insulin binding. Metabolism. 1986;35:1017–1023. doi: 10.1016/0026-0495(86)90037-5. [DOI] [PubMed] [Google Scholar]
- 27.Lodi R, Cooper JM, Bradley JL, et al. Deficit of in vivo mitochondrial ATP production in patients with Friedreich ataxia. Proc Natl Acad Sci U S A. 1999;96:11492–11495. doi: 10.1073/pnas.96.20.11492. [DOI] [PMC free article] [PubMed] [Google Scholar]
- 28.Vorgerd M, Schols L, Hardt C, et al. Mitochondrial impairment of human muscle in Friedreich ataxia in vivo. Neuromuscul Disord. 2000;10:430–435. doi: 10.1016/s0960-8966(00)00108-5. [DOI] [PubMed] [Google Scholar]
- 29.Petersen KF, Dufour S, Befroy D, et al. Impaired mitochondrial activity in the insulin-resistant offspring of patients with type 2 diabetes. N Engl J Med. 2004;350:664–671. doi: 10.1056/NEJMoa031314. [DOI] [PMC free article] [PubMed] [Google Scholar]
- 30.Hebinck J, Hardt C, Schols L, et al. Heterozygous expansion of the GAA tract of the X25/frataxin gene is associated with insulin resistance in humans. Diabetes. 2000;49:1604–1607. doi: 10.2337/diabetes.49.9.1604. [DOI] [PubMed] [Google Scholar]
- 31.Ristow M, Giannakidou E, Hebinck J, et al. An association between NIDDM and a GAA trinucleotide repeat polymorphism in the X25/frataxin (Friedreich’s ataxia) gene. Diabetes. 1998;47:851–854. doi: 10.2337/diabetes.47.5.851. [DOI] [PubMed] [Google Scholar]
- 32.Dalgaard LT, Hansen T, Urhammer SA, et al. Intermediate expansions of a GAA repeat in the frataxin gene are not associated with type 2 diabetes or altered glucose-induced β-cell function in Danish Caucasians. Diabetes. 1999;48:914–917. doi: 10.2337/diabetes.48.4.914. [DOI] [PubMed] [Google Scholar]
- 33.Holmkvist J, Almgren P, Parikh H, et al. Haplotype construction of the FRDA gene and evaluation of its role in type II diabetes. Eur J Hum Genet. 2005;13:849–855. doi: 10.1038/sj.ejhg.5201413. [DOI] [PubMed] [Google Scholar]
- 34.Miranda CJ, Santos MM, Ohshima K, et al. Frataxin knockin mouse. FEBS Lett. 2002;512:291–297. doi: 10.1016/s0014-5793(02)02251-2. [DOI] [PubMed] [Google Scholar]
- 35.Ristow M, Mulder H, Pomplun D, et al. Frataxin deficiency in pancreatic islets causes diabetes due to loss of β cell mass. J Clin Invest. 2003;112:527–534. doi: 10.1172/JCI18107. [DOI] [PMC free article] [PubMed] [Google Scholar]
- 36.Cossee M, Puccio H, Gansmuller A, et al. Inactivation of the Friedreich ataxia mouse gene leads to early embryonic lethality without iron accumulation. Hum Mol Genet. 2000;9:1219–1226. doi: 10.1093/hmg/9.8.1219. [DOI] [PubMed] [Google Scholar]
- 37.Bergman RN, Prager R, Volund A, et al. Equivalence of the insulin sensitivity index in man derived by the minimal model method and the euglycemic glucose clamp. J Clin Invest. 1987;79:790–800. doi: 10.1172/JCI112886. [DOI] [PMC free article] [PubMed] [Google Scholar]
- 38.Kahn SE, Prigeon RL, McCulloch DK, et al. Quantification of the relationship between insulin sensitivity and β-cell function in human subjects. Evidence for a hyperbolic function. Diabetes. 1993;42:1663–1672. doi: 10.2337/diab.42.11.1663. [DOI] [PubMed] [Google Scholar]
- 39.Frayn KN. Calculation of substrate oxidation rates in vivo from gaseous exchange. J Appl Physiol. 1983;55:628–634. doi: 10.1152/jappl.1983.55.2.628. [DOI] [PubMed] [Google Scholar]
- 40.Ellis KJ. Human body composition: in vivo methods. Physiol Rev. 2000;80:649–680. doi: 10.1152/physrev.2000.80.2.649. [DOI] [PubMed] [Google Scholar]
- 41.Blanc S, Schoeller D, Kemnitz J, et al. Energy expenditure of rhesus monkeys subjected to 11 years of dietary restriction. J Clin Endocrinol Metab. 2003;88:16–23. doi: 10.1210/jc.2002-020405. [DOI] [PubMed] [Google Scholar]
- 42.Ravussin E, Bogardus C. Relationship of genetics, age, and physical fitness to daily energy expenditure and fuel utilization. Am J Clin Nutr. 1989;49:968–975. doi: 10.1093/ajcn/49.5.968. [DOI] [PubMed] [Google Scholar]
- 43.Subramony SH, May W, Lynch D, et al. Measuring Friedreich ataxia: interrater reliability of a neurologic rating scale. Neurology. 2005;64:1261–1262. doi: 10.1212/01.WNL.0000156802.15466.79. [DOI] [PubMed] [Google Scholar]
- 44.Schwab RS, England AC. Projection technique for evaluating surgery in Parkinson’s disease. In: Gillingham FJ, Donaldson IML, editors. Third symposium on Parkinson’s disease. Edinburgh, UK: Livingstone; 1969. pp. 152–157. [Google Scholar]
- 45.Pandolfo M. Friedreich ataxia: detection of GAA repeat expansions and frataxin point mutations. Methods Mol Med. 2006;126:197–216. doi: 10.1385/1-59745-088-X:197. [DOI] [PubMed] [Google Scholar]
- 46.Del Guerra S, D’Aleo V, Gualtierotti G, et al. Evidence for a role of frataxin in pancreatic islets isolated from multi-organ donors with and without type 2 diabetes mellitus. Horm Metab Res. 2012;44:471–475. doi: 10.1055/s-0032-1301920. [DOI] [PubMed] [Google Scholar]
- 47.Fantus IG, Seni MH, Andermann E. Evidence for abnormal regulation of insulin receptors in Friedreich’s ataxia. J Clin Endocrinol Metab. 1993;76:60–63. doi: 10.1210/jcem.76.1.8421104. [DOI] [PubMed] [Google Scholar]
- 48.Petersen KF, Dufour S, Shulman GI. Decreased insulin-stimulated ATP synthesis and phosphate transport in muscle of insulin-resistant offspring of type 2 diabetic parents. PLoS Med. 2005;2:e233. doi: 10.1371/journal.pmed.0020233. [DOI] [PMC free article] [PubMed] [Google Scholar]
- 49.Befroy DE, Petersen KF, Dufour S, et al. Increased substrate oxidation and mitochondrial uncoupling in skeletal muscle of endurance-trained individuals. Proc Natl Acad Sci U S A. 2008;105:16701–16706. doi: 10.1073/pnas.0808889105. [DOI] [PMC free article] [PubMed] [Google Scholar]
- 50.Bullough RC, Gillette CA, Harris MA, et al. Interaction of acute changes in exercise energy expenditure and energy intake on resting metabolic rate. Am J Clin Nutr. 1995;61:473–481. doi: 10.1093/ajcn/61.3.473. [DOI] [PubMed] [Google Scholar]
- 51.Sleigh A, Raymond-Barker P, Thackray K, et al. Mitochondrial dysfunction in patients with primary congenital insulin resistance. J Clin Invest. 2011;121:2457–2461. doi: 10.1172/JCI46405. [DOI] [PMC free article] [PubMed] [Google Scholar]
- 52.Apabhai S, Gorman GS, Sutton L, et al. Habitual physical activity in mitochondrial disease. PLoS One. 2011;6:e22294. doi: 10.1371/journal.pone.0022294. [DOI] [PMC free article] [PubMed] [Google Scholar]
- 53.Eizirik DL, Cardozo AK, Cnop M. The role for endoplasmic reticulum stress in diabetes mellitus. Endocr Rev. 2008;29:42–61. doi: 10.1210/er.2007-0015. [DOI] [PubMed] [Google Scholar]
- 54.Cnop M, Vidal J, Hull RL, et al. Progressive loss of β-cell function leads to worsening glucose tolerance in first-degree relatives of subjects with type 2 diabetes. Diabetes Care. 2007;30:677–682. doi: 10.2337/dc06-1834. [DOI] [PubMed] [Google Scholar]
- 55.Weyer C, Bogardus C, Mott DM, et al. The natural history of insulin secretory dysfunction and insulin resistance in the pathogenesis of type 2 diabetes mellitus. J Clin Invest. 1999;104:787–794. doi: 10.1172/JCI7231. [DOI] [PMC free article] [PubMed] [Google Scholar]
- 56.Lyssenko V, Almgren P, Anevski D, et al. Predictors of and longitudinal changes in insulin sensitivity and secretion preceding onset of type 2 diabetes. Diabetes. 2005;54:166–174. doi: 10.2337/diabetes.54.1.166. [DOI] [PubMed] [Google Scholar]
- 57.Kriketos AD, Carey DG, Jenkins AB, et al. Central fat predicts deterioration of insulin secretion index and fasting glycaemia: 6-year follow-up of subjects at varying risk of type 2 diabetes mellitus. Diabet Med. 2003;20:294–300. doi: 10.1046/j.1464-5491.2003.00938.x. [DOI] [PubMed] [Google Scholar]
- 58.Handschin C, Choi CS, Chin S, et al. Abnormal glucose homeostasis in skeletal muscle-specific PGC-1α knockout mice reveals skeletal muscle-pancreatic β cell crosstalk. J Clin Invest. 2007;117:3463–3474. doi: 10.1172/JCI31785. [DOI] [PMC free article] [PubMed] [Google Scholar]
- 59.Drucker DJ. The biology of incretin hormones. Cell Metab. 2006;3:153–165. doi: 10.1016/j.cmet.2006.01.004. [DOI] [PubMed] [Google Scholar]
- 60.Yusta B, Baggio LL, Estall JL, et al. GLP-1 receptor activation improves β cell function and survival following induction of endoplasmic reticulum stress. Cell Metab. 2006;4:391–406. doi: 10.1016/j.cmet.2006.10.001. [DOI] [PubMed] [Google Scholar]
- 61.Cunha DA, Ladrière L, Ortis F, et al. Glucagon-like peptide-1 agonists protect pancreatic β-cells from lipotoxic endoplasmic reticulum stress through upregulation of BiP and JunB. Diabetes. 2009;58:2851–2862. doi: 10.2337/db09-0685. [DOI] [PMC free article] [PubMed] [Google Scholar]
Associated Data
This section collects any data citations, data availability statements, or supplementary materials included in this article.