

Abstract
Carcinoembryonic antigen-related cell adhesion molecule 1 (CEACAM1) promotes hepatic insulin clearance. Consistently, mice with null mutation of Ceacam1 (Cc1−/−) exhibit impaired insulin clearance with increased lipid production in liver and redistribution to white adipose tissue, leading to visceral obesity at 2 months of age. When the mutation is propagated on the C57/BL6J genetic background, total fat mass rises significantly with age, and glucose intolerance and systemic insulin resistance develop at 6 months of age. This study was carried out to determine the mechanisms underlying the marked increase in total fat mass in 6-month-old mutants. Indirect calorimetry analysis showed that Cc1−/− mice develop hyperphagia and a significant reduction in physical activity, in particular in the early hours of the dark cycle, during which energy expenditure is only slightly lower than in wild-type mice. They also exhibit increased triglyceride accumulation in skeletal muscle, due in part to incomplete fatty acid β-oxidation. Mechanistically, hypothalamic leptin signaling is reduced, as demonstrated by blunted STAT3 phosphorylation in coronal sections in response to an intracerebral ventricular injection of leptin. Hypothalamic fatty-acid synthase activity is also elevated in the mutants. Together, the data show that the increase in total fat mass in Cc1−/− mice is mainly attributed to hyperphagia and reduced spontaneous physical activity. Although the contribution of the loss of CEACAM1 from anorexigenic proopiomelanocortin neurons in the arcuate nucleus is unclear, leptin resistance and elevated hypothalamic fatty-acid synthase activity could underlie altered energy balance in these mice.
Keywords: fatty acid oxidation; fatty-acid synthase (FAS); insulin resistance; leptin; nuclear magnetic resonance (NMR); CEACAM1; Energy homeostasis; hyperleptinemia; hyperphagia; leptin resistance NIH [, and (to S.M. Najjar), (to J.W. Hill) and
Introduction
Leptin, a 16-kDa hormone and cytokine, is produced and secreted largely by the adipose tissue (1). Leptin signaling in the brain affects the activity of the orexigenic agouti-related protein and anorexigenic proopiomelanocortin (POMC)5 neurons in the hypothalamus, acting through the melanocortin system to regulate food intake (2, 3). Leptin signaling via JAK/STAT3 pathways activates transcription of several genes that are involved in the regulation of food intake and energy expenditure (4). Mutations in the leptin gene (ob) or leptin receptor (db) result in severe obesity caused by food overconsumption and decreased energy expenditure (5).
Impaired insulin clearance and elevated fat accumulation in liver are associated with type 2 diabetes (6). We have shown that the carcinoembryonic antigen-related cell adhesion molecule 1 (CEACAM1) promotes insulin clearance (7, 8) and inhibits fatty acid synthesis in liver (9). Murine models of liver-specific CEACAM1 inactivity (L-SACC1) or gene null mutation (Cc1−/−) exhibit insulin resistance, due to impaired insulin clearance, with increased hepatic fat production (hepatic steatosis) and redistribution to the white adipose tissue (visceral obesity) (7, 8). When Cc1−/− mice are propagated on C57/BL6J background, reduced insulin clearance, hyperinsulinemia, altered hepatic fat metabolism, and visceral obesity develop at 2 months of age, preceding a significant rise in total fat mass and the manifestation of glucose intolerance and systemic insulin resistance at about 5–6 months of age (8). L-SACC1 and Cc1−/− mice fed a high fat diet develop macrosteatosis and inflammation with other prominent features of progressive non-alcoholic steatohepatitis (10, 11). In contrast, forced transgenic overexpression of CEACAM1 in liver protected L-CC1 mice against insulin resistance and hepatic fat accumulation and inflammation in response to high fat intake (12). This was mediated, at least in part, by limiting fatty acid synthesis and enhancing β-oxidation in liver (12). Liver-specific overexpression of CEACAM1 also restricted the gain in fat mass and visceral obesity, in part by protecting energy expenditure against prolonged high fat intake (12), and preventing diet-induced inflammation and fibrosis in white adipose tissue (13). However, forced expression of CEACAM1 in liver did not affect food intake on either a regular or a high fat diet (12). Thus, although loss-of-function of CEACAM1 in liver contributes to elevated visceral fat mass in Cc1−/− mice, there appears to be extra-hepatic mechanisms mediating the increase in total fat mass with age, possibly related to changes in food intake and overall energy expenditure. Thus, in this study we examined whether global Ceacam1 null deletion causes energy imbalance, and whether this would be accompanied by defective leptin signaling in the hypothalamus.
Experimental Procedures
Colony Maintenance
Cc1−/− mice were generated and backcrossed to the C57/BL6J background as described previously (8). Mice were kept in a 12-h light/dark cycle and fed ad libitum a regular chow diet (12). 4–6-Month-old male mice were used throughout the studies. All procedures were approved by the Institutional Animal Care and Utilization Committee (IACUC).
Body Composition
Body composition was assessed by nuclear magnetic resonance technology (Bruker Minispec; Billerica, MA).
Indirect Calorimetry Analysis
Awake mice (n = 5/genotype) were individually caged (CLAMS system, Columbus Instruments, Columbus, OH) over a 3-day period after being acclimated for 2 days. Mice had access to food and water ad libitum. Spontaneous physical activity was measured with an optical beam measuring horizontal movement on the x axis (locomotor), y axis (ambulatory), and z axis (standing). Oxygen consumption (VO2), CO2 production (VCO2), and heat production were sampled every 20 min and normalized to fat-free lean mass. The respiratory exchange rate was calculated as the VCO2/VO2 ratio. Data were represented as means ± S.E. of light (700–1900 h) and dark (1900 to 700 h) cycles.
Glucose and Insulin Tolerance Tests
These tests were performed on awake mice fasted for 6–7 h as described previously (12). For glucose tolerance, mice were injected intraperitoneally (i.p.) with 1.5 g/kg BW dextrose solution before measuring tail blood glucose at each time point. For insulin tolerance, mice were injected i.p. with 0.75 units/kg BW human regular insulin (Novo Nordisk, Princeton, NJ), and blood glucose was measured from the tail at each time point.
Plasma Metabolites
Retro-orbital venous blood was drawn at 1100 h after overnight fasting to measure plasma levels of C-peptide and insulin by radioimmunoassay (Linco Research, St Charles, MO). Mice were fasted for 6 h before blood was drawn to measure plasma leptin by ELISA kit (EMD Millipore Corp., Billerica, MA).
Ex Vivo Palmitate Oxidation
As described in detail (14), soleus and gastrocnemius muscle of overnight-fasted mice were homogenized in 10 mm Tris-HCl, pH 7.2, 300 mm sucrose, 2 mm EDTA, incubated at 30 °C for 45 min, and injected via syringe into a sealed beaker to be incubated at 30 °C for 45 min in the presence of 0.2 mm [1-14C]palmitate (0.5 μCi/ml) and 2 mm ATP in incubation buffer (100 mm sucrose, 10 mm Tris-HCl, 5 mm potassium phosphate, 80 mm KCl, 1 mm MgCl2, 2 mm l-carnitine, 0.1 mm malic acid, 0.05 mm coenzyme A, 1 mm dithiothreitol, 0.2 mm EDTA, and 0.5% BSA, pH 7.4). The reaction was terminated with glacial acetic acid, and trapped CO2 radioactivity was measured by liquid scintillation in Cyto CinT (MP Biomedicals, Solon, OH).
Fatty-acid Synthase (FASN) Activity
Following an overnight fast, the hypothalamus was removed, and FASN activity was measured immediately in the presence of 0.1 μCi of [14C]malonyl-CoA (PerkinElmer Life Sciences), 25 nmol of malonyl-CoA, and 500 μm NADPH, as described previously (9). FASN activity was calculated as counts/min of [14C] incorporated per mg of lysates.
Leptin Signaling
Mice were fasted 24 h prior to being anesthetized with an i.p. injection of 100 mg/kg ketamine hydrochloride and 10 mg/kg xylazine. Mouse leptin (Sigma) (2 μg in 2 μl) or vehicle (1 m Tris-HCl, pH 8.0) was then injected into the lateral ventricle (0.22 mm caudal and 1 mm lateral from bregma; depth, 2.25 mm). We have found these coordinates consistently induce increased water consumption following angiotensin injection, indicating effective access to the ventricle. 45 min later, mice were perfused transcardially with 0.9% saline followed by 10% neutral buffered formalin. Coronal sections were made using a sliding microtome. Detection of phosphorylation of signal transducer and activator of transcription 3 (STAT3) was accomplished using a rabbit polyclonal antiserum (Cell Signaling Technologies, Beverly, MA; catalog no. 9131) against the amino acid residues flanking Tyr-705 of mouse STAT3. Sections were rinsed 10 times for 6 min each in PBS, pH 7.4, and then for 30 min in 0.3% hydrogen peroxide in PBS to quench endogenous peroxidase activity. Following a series of PBS washes, tissue was incubated for 1 h in 3% normal donkey serum (Jackson ImmunoResearch, West Grove, PA), prepared with 0.25% Triton X-100 in PBS (PBT) and 0.02% sodium azide. Sections were incubated overnight at room temperature and then for 48 h at 4 °C in antisera diluted to 1:4000 in PBT with 0.02% sodium azide. After washing in PBS, tissue was incubated in biotinylated donkey anti-rabbit (Jackson ImmunoResearch) diluted to 1:200 in 3% donkey serum in PBT for 1 h at room temperature. Tissue was then rinsed in PBS and incubated in ABC (Vectastain Elite ABC kit; Vector Laboratories, Burlingame, CA) diluted 1:500 in PBS for 1 h. Sections were washed in PBS and then reacted in 0.04% 3,3′-diaminobenzidine tetrahydrochloride (Sigma) and 0.01% hydrogen peroxide dissolved in PBS. Sections were mounted on slides, air-dried, dehydrated in increasing concentrations of ethanol, cleared in xylene, and coverslipped with Permaslip (Alban Scientific, St. Louis, MO). For quantification, p-STAT3-positive cells in the arcuate, ventromedial, and dorsomedial nuclei of the medial hypothalamus (Bregma −1.70 mm) were counted using Open CFU.
Measurement of Food Intake upon Leptin Injection
Mice (n >6 per group) were individually housed with a pre-measured amount of chow for ∼2–3 days. The body weight of each animal and the weight of the food were assessed to acclimate mice to the conditions of the study. Mice were then fasted for 9 h at the beginning of the light cycle to prevent any feeding that may cause the release of endogenous leptin. An hour before the dark cycle (1600 h), mice were injected intraperitoneally with leptin (5 mg/kg body weight, from A. F. Parlow, Harbor-UCLA Medical Center, Torrance, CA; through the National Hormone and Peptide Program) or saline vehicle and fed a pre-weighed amount of food (60 g/mouse). Body weight and weight of chow were assessed the following morning before removing food. The experiment was repeated for 5 days. Food intake was calculated as the weight of food provided minus the weight of food remaining in each cage everyday. Data were presented as mean of food intake over 5 days ± S.E.
Immunofluorescence in POMC-GFP Mice
Mice with green fluorescent protein (GFP) reporter expressed in POMC neurons (POMC-GFP) have been previously described (15). Coronal brain sections of 10-μm thickness were prepared from 4% paraformaldehyde, fixed, and OCT-embedded POMC-GFP tissue blocks. After drying the sections at 37 °C (in the dark), sections were blocked with 10% serum and exposed at 4 °C overnight to a custom-made CEACAM1 monoclonal antibody (1:50) (16) and αGFP (1:1000) (Abcam, Cambridge, UK, ab13970). Secondary antibodies were incubated subsequently for 1 h at room temperature using the following antibodies: rabbit α-mouse biotinylated secondary antibody (1:250) (Dako, Hamburg, Germany E0354) followed by streptavidin-Alexa-555 (1:400) (Invitrogen, Darmstadt, Germany, S21381) and goat α-chicken-488 (1:600) (Invitrogen, A11039). Fluorescence was visualized by epifluorescence using Keyence BZ9000 microscope equipped with a Plan Apo objective (Nikon, Düsseldorf, Germany). DAPI (1:5000) was used to visualize the nuclei.
Semi-quantitative Real Time PCR
Total RNA was extracted from frozen soleus muscle tissue using Perfect Pure RNA Tissue Kit-50 (5 PRIME Inc. Gaithersburg, MD). cDNA templates for RT-PCR were synthesized using 1 μg of total RNA, 10× DNase Reaction Buffer, DNase 1 Amp Grade, dNTPs, random primers, and Superscript III (Invitrogen). PCR was performed using Fast SYBR Green Master Mix (Applied Biosystems, Foster City, CA) on a StepOnePlus real time PCR system (Applied Biosystems). All primers (Table 1) were used at a final concentration of 20 μm. A standard curve using pooled samples was used to obtain the relative concentration of each experimental gene, and values were normalized to the concentration of glyceraldehyde-3-phosphate dehydrogenase (gapdh) in each sample.
TABLE 1.
Real time PCR primer sequences from mouse genes
F indicates forward, and R indicates reverse.
| Gene | Forward sequence |
|---|---|
| ucp-3 | F, 5′-GTCTGCCTCATCAGGGTGTT-3′ |
| R, 5′-CCTGGTCCTTACCATGCAGT-3′ | |
| cpt1b | F, 5′-AAGGCAGAAGAGTGGGCTTTCACT-3′ |
| R, 5′-ACCTTGGCTGCGGTAAGACTATGT-3′ | |
| pdk4 | F, 5′-CCTTTGGCTGGTTTTGGTTA-3′ |
| R, 5′-CCTGCTTGGGATACACCAGT-3′ | |
| cox-2 | F, 5′-ACGAAATCAACAACCCCGTA-3′ |
| R, 5′-GGCAGAACGACTCGGTTATC-3′ | |
| gapdh | F, 5′-CCAGGTTGTCTCCTGCGACT-3′ |
| R, 5′-ATACCAGGAAATGAGCTTGACAAAGT-3′ |
Statistics
Data were analyzed by two-way analysis of variance and post hoc Tukey test or two-tailed Student's t test, as appropriate, using Prism5 software (GraphPad). p < 0.05 were considered statistically significant.
Results
Altered Energy Balance in Cc1−/− Mice
As expected from hyperinsulinemic-euglycemic clamp analysis (8), male Cc1−/− mice exhibited both glucose and insulin intolerance (Fig. 1, A and B, respectively) beginning at 6 months of age. The mice also develop hyperinsulinemia (Table 2), which begins at 2 months of age (8). This sustained hyperinsulinemia results from impaired insulin clearance, as indicated by the lower steady state C-peptide to insulin molar ratio in these mutants (Table 2). As indicated previously (8), insulin resistance is likely to result from early-onset hyperinsulinemia in Cc1−/− null mice.
FIGURE 1.

Intraperitoneal glucose and insulin tolerance tests. 6-Month-old male Cc1+/+ and Cc1−/− mice (n >5 per treatments per genotype) were challenged with an intraperitoneal injection of glucose (1.5 g/kg BW) (A) or insulin (0.75 units/kg BW) (B) to assess blood glucose levels at 0–180 min post-injection. Insulin tolerance in B, was measured as percentage of basal blood glucose level. *, p < 0.05 versus Cc1+/+ mice (open circles).
TABLE 2.
Plasma and tissue biochemistry
Male mice (n≥5; 6 months of age) were fasted overnight prior to drawing blood, except for leptin when the mice were fasted for 6 h. Lean, fat, and fluid mass was determined using NMR and expressed as % total BW. Values are expressed as mean ± S.E.
| Cc1+/+ | Cc1−/− | |
|---|---|---|
| Body weight (BW) (g) | 34.1 ± 1.28 | 43.3 ± 1.28a |
| Liver (% BW) | 3.91 ± 0.14 | 4.08 ± 0.23 |
| Visceral adiposity (% BW) | 3.23 ± 0.27 | 4.86 ± 0.17a |
| Plasma C-peptide (pmol/liter) | 174. ± 21.0 | 432. ± 26.1a |
| Plasma insulin (pmol/liter) | 39.6 ± 4.41 | 92.5 ± 16.7a |
| C-peptide/insulin molar ratio | 10.2 ± 2.28 | 4.31 ± 0.63a |
| Plasma leptin (ng/ml) | 12.3 ± 4.52 | 27.3 ± 4.29a |
| Skeletal muscle triglyceride (mg of protein/g of tissue) | 4.85 ± 0.47 | 8.89 ± 3.52a |
a p < 0.05 versus Cc1+/+ mice.
Consistent with earlier reports (8, 10, 17), Cc1−/− mice exhibited body weight gain relative to their wild-type Cc1+/+ counterparts (Tables 2 and 3). This is likely due to a greater fat mass because lean and fluid mass were lower than Cc1+/+ mice (Table 3). Increase in total fat mass started at 4 months of age (Table 3). As reported previously (8), mutant mice manifested increased fat accumulation in the intra-abdominal epididymal visceral fat pad (visceral obesity) (Table 2) that began at 2 months of age, likely resulting from higher lipid production in liver and redistribution to the white adipose tissue (8, 13). Consistent with increased production and release of leptin from adipocytes in association with increased fat mass (18), plasma leptin levels were elevated in Cc1−/− mice (Table 2), as we originally reported (10). This increase in plasma leptin level was observed at 2 months of age (9.84 ± 2.16 versus 1.87 ± 0.90 ng/ml in Cc1+/+ mice), in parallel to higher visceral adiposity in mutant mice.
TABLE 3.
NMR analysis
Male mice (n = 5 per age group per genotype) were subjected to NMR analysis to determine body composition. Fat, lean, and fluid mass was determined using NMR and expressed as % total body weight (BW). Experiments were repeated on four different sets of mice. Values are expressed as mean ± S.E.
| BW | Fat mass | Lean mass | Fluid | |
|---|---|---|---|---|
| % | % | % | ||
| 2 months | ||||
| Cc1+/+ | 21. ± .50 | .58 ± .64 | 73. ± 0.8 | 20. ± 0.5 |
| Cc1−/− | 24. ± .32a | 1.2 ± .64 | 71. ± 1.2 | 20. ± 0.2 |
| 3 months | ||||
| Cc1+/+ | 24. ± 0.4 | 3.4 ± 1.4 | 69. ± 0.8 | 19. ± 0.3 |
| Cc1−/− | 28. ± 0.6a | 3.6 ± 1.7 | 71. ± 2.4 | 19. ± 0.3 |
| 4 months | ||||
| Cc1+/+ | 27. ± 1.0 | 2.1 ± 0.5 | 71. ± 1.7 | 19. ± 0.5 |
| Cc1−/− | 30. ± 0.2a | 5.4 ± 1.4a | 70. ± 1.7 | 19. ± 0.3 |
| 6 months | ||||
| Cc1+/+ | 34. ± 1.3 | 2.7 ± 1.0 | 70. ± 0.9 | 21. ± 0.5 |
| Cc1−/− | 43. ± 1.3a | 21. ± 1.2a | 56. ± 1.1a | 17. ± 0.2a |
a p < 0.05 versus Cc1+/+ mice per age group.
Because increased food intake and reduction in physical activity and energy expenditure cause obesity, we then assessed these metabolic parameters by indirect calorimetry. Six-month-old male Cc1−/− mice manifested hyperphagia (Fig. 2A) that was not statistically significant at 4 months of age (data not shown). They also exhibited a marked decrease in spontaneous physical activity along each x axis (locomotor activity) (Fig. 2B, panel i), y axis (ambulatory activity), and z axis (standing rearing activity), particularly in the early hours of the dark cycle (Fig. 2B, panel ii, for simplicity, the activity along the z axis is not shown). Reduction in spontaneous physical activity did not reach statistical significance at 4 months of age (data not shown).
FIGURE 2.

Indirect calorimetry analysis. Six-month-old male Cc1+/+ and Cc1−/− mice (n = 5 per genotype) were individually housed and subjected to indirect calorimetry analysis to determine daily food intake (A), spontaneous physical activity (B), and oxygen consumption (VO2) (C). Hourly measurements over the full 24-h period (starting at 7 am) were plotted. Graphs show average hourly data over each 24-h period during the last 3 consecutive days. C, data are expressed as means ± S.E. *, p < 0.05 in Cc1−/− (solid circles and bars) versus Cc1+/+ mice (open circles and bars). Graphs are representatives of different experiments done on at least four different sets of mice.
Six-month-old Cc1−/− mutants exhibited no statistically significant reduction in O2 consumption (VO2), CO2 production (VCO2), and consequently, the calculated respiratory exchange ratio (VCO2/VO2) during the light or dark phase when they also produced the same amount of heat (Table 4). However, in the early hours of the dark cycle (1900–2200 h) when physical activity was mostly affected, VO2 and heat were reduced, albeit slightly, in mutant mice (Fig. 2C, 4659 ± 92.78 versus 5431 ± 265.0 ml/h/kg in Cc1+/+, p < 0.05, and 100.2 ± 1.934 versus 110.6 ± 3.043 kcal/h/kg in Cc1+/+, p < 0.05, respectively).
TABLE 4.
Indirect calorimetry analysis
Male mice (n = 5; 5–6 months of age) were placed in indirect calorimetry cages and acclimated over at least 2 days, and the measurements were recorded every 20 min over 3 consecutive days. These include oxygen consumption (VO2), CO2 production (VCO2), and heat production. Data were normalized to fat-free lean mass. The respiratory exchange rate (RER) was calculated as VCO2/VO2 ratio. Experiments were repeated four times on four different sets of mice. Data presented are cumulative during each of the 12-h light and dark cycles. Values are expressed as mean ± S.E.
| Light |
Dark |
|||
|---|---|---|---|---|
| Cc1+/+ | Cc1−/− | Cc1+/+ | Cc1−/− | |
| VO2 (ml/h/kg × 10−4) | 15.2 ± 1.07 | 13.4 ± 0.09 | 18.4 ± 1.09 | 16.5 ± 0.59 |
| VCO2 (ml/h/kg × 10−4) | 14.4 ± 1.09 | 12.1 ± 0.31 | 16.9 ± 1.35 | 16.4 ± 0.28 |
| RER (VCO2/VO2) | 0.95 ± 0.01 | 0.90 ± 0.02 | 1.01 ± 0.02 | 1.00 ± 0.02 |
| Heat (kcal/h/kg × 10−2) | 29.3 ± 0.50 | 22.8 ± 0.29a | 36.1 ± 0.88 | 34.7 ± 0.21 |
a p < 0.05 versus Cc1+/+ mice.
Decreased Fatty Acid β-Oxidation in Skeletal Muscle of Cc1−/− Mice
Because skeletal muscle is involved in the metabolic response to changes in physical activity, we then investigated whether fatty acid β-oxidation was altered in the soleus muscle of 6-month-old mice. As Fig. 3A indicates, transcript levels of genes involved in fatty acid β-oxidation were all reduced in the soleus muscle of Cc1−/− mice. These include uncoupling protein 3 (Ucp3), carnitine palmitoyltransferase 1 (Cpt1b), cytochrome c oxidase subunit 2 (Cox2), and pyruvate dehydrogenase kinase 4 (Pdk4). Consistently, ex vivo fatty acid β-oxidation was also lower in skeletal muscle isolated from Cc1−/− relative to Cc1+/+ mice as measured by palmitate oxidation (Fig. 3B). Resulting, at least in part, from this reduced muscle fatty acid β-oxidation is increased accumulation of triglycerides in this tissue (Table 2).
FIGURE 3.
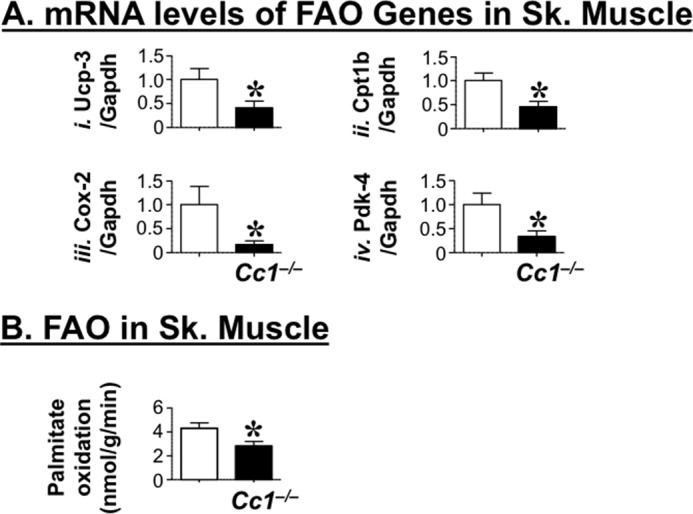
Fatty acid oxidation in skeletal muscle. A, semi-quantitative RT-PCR analysis was used to determine mRNA transcripts of genes involved in fatty acid oxidation in the skeletal (Sk.) muscle of 6-month-old male Cc1+/+ (open bar) and Cc1−/− (solid bar) mice. Genes examined are as follows: uncoupled protein 3 (Ucp3, panel i), carnitine palmitoyltransferase 1B (Cpt1b, panel ii), cyclooxygenase-2 (Cox2, panel iii), and pyruvate dehydrogenase kinase isozyme 4 (Pdk4, panel iv). mRNA levels were analyzed in triplicate per mouse and normalized to Gapdh content. Data are expressed as means ± S.E. *, p < 0.05 versus Cc1+/+ (open bars). B, fatty acid oxidation was assayed in skeletal muscle isolated from fasted 6-month-old Cc1+/+ (open bar) and Cc1−/− (solid bar) mice (n >7 per genotype). Data are expressed as mean ± S.E. *, p < 0.05 versus Cc1+/+ (open bars).
Impaired Leptin Signaling in Cc1−/− Mice
Because leptin signaling in the brain activates a JAK/STAT3 pathway in hypothalamic neurons (4) to elicit an anorexigenic effect (19), we then examined leptin signaling through STAT3 pathways in response to an intracerebral ventricular (i.c.v.) injection of leptin. As Fig. 4 shows, leptin induces STAT3 phosphorylation, a marker of leptin receptor activation, in the medial hypothalamus of both mouse groups by ∼3–4-fold at 4 months of age (Fig. 4A). At 6 months, however, leptin failed to induce STAT3 phosphorylation in Cc1−/− hypothalami (Fig. 4B).
FIGURE 4.

Hypothalamic leptin signaling. A, 4-month-old, and B, 6-month-old male Cc1+/+ and Cc1−/− mice (n = 3–5 per treatments per genotype) received an i.c.v. injection of vehicle (Veh, open or solid bars) or leptin (Lep, gray- and black-striped bars) 45 min prior to tissue isolation. Coronal sections from the medial hypothalamus were subjected to immunohistochemical analysis with phospho-STAT3. The mean number of stained hypothalamic neurons of the medial hypothalamus is shown as ± S.E. *, p < 0.05 versus vehicle in each mouse group.
To further examine leptin action in vivo, we then examined the effect of leptin injection on food intake. As Fig. 5 indicates, leptin reduced food intake in Cc1+/+ and Cc1−/− mice at 3 months of age, but it failed to do so in 6-month-old mutants.
FIGURE 5.

Effect of leptin on food intake. Mice (n >6 per group) were individually housed, fasted during the light cycle, and injected with saline vehicle (Veh, open bars) or leptin (Lep, gray- and black-striped bars) before being fed a pre-weighed amount of food overnight. Food intake was measured in the morning, and the experiment was repeated for 5 days. Food intake was calculated as the weight of food provided to each mouse minus the weight of food remaining in the cage. Data are mean ± S.E. *, p < 0.05 versus vehicle in each mouse group.
Increased Hypothalamic Fatty-acid Synthase Activity in Cc1−/− Mice
Elevated hypothalamic FASN activity causes hyperphagia (20) and reduction in physical activity (21). Consistently, FASN activity in the hypothalamus of 6-month-old Cc1−/− mice was ∼4-fold higher than their wild-type counterparts (Fig. 6). This suggests that elevated hypothalamic FASN activity contributes to altered energy balance in Cc1−/− mice.
FIGURE 6.

Hypothalamic FASN activity. FASN activity was assessed in triplicate in the hypothalamus of overnight fasted 6-month-old mice (n = 5 per genotype). Data are expressed as means ± S.E. *, p < 0.05 versus Cc1+/+ (open bar).
Detection of CEACAM1 in Hypothalamic POMC Neurons
Altered response to i.c.v.-injected leptin points to neuronal expression of CEACAM1 in central nervous system. Because ablating POMC neurons increase food intake and reduce energy expenditure (22), we tested CEACAM1 expression in these neurons. To this end, we carried out immunofluorescence analysis of CEACAM1 in the hypothalamus of mice with green fluorescent protein reporter expressed in POMC neurons (POMC-GFP). As Fig. 7 shows, CEACAM1 was co-localized with this neuronal population in the arcuate nucleus as well as in non-POMC-expressing neurons (Fig. 7D). Identifying CEACAM1 in POMC neurons supports its potential role in regulating leptin action and in neuronal control of food intake and spontaneous physical activity.
FIGURE 7.

Immunofluorescence analysis of CEACAM1 in hypothalamic POMC cells. Coronal brain sections of POMC-GFP mice were sectioned, and the arcuate nucleus was analyzed by immunofluorescence to detect nuclei in DAPI (A, E, and I). GFP-labeled POMC neurons are in green (B and F), and CEACAM1 is shown in red (C). D, merged image of POMC-GFP and CEACAM1. G shows a negative control (Neg. ct) for secondary antibody in the absence of primary antibodies. Sections from Cc1−/− mouse (I and J) show negative control for primary antibody with a magnified view of the arcuate (arc) nucleus in the inset (J). Arrows point to neurons magnified in the inset (B–D) or cells positive for GFP (F and H). Abbreviations used are as follows: v, lateral ventricle; hy, hypothalamus; th, thalamus; and hp, hippocampus. Scale bar, 100 μm.
Discussion
We have previously established the Cc1−/− mouse as a model of insulin resistance and obesity. Hyperinsulinemia, stemming from impairment of insulin clearance, causes insulin resistance at 6 months of age (8, 10). In addition, aged mutant mice develop glucose intolerance that could, at least in part, be caused by obesity (23). Also resulting from hyperinsulinemia is uncontrolled lipid production in liver and redistribution to white adipose tissue, causing an increase in visceral obesity at 2 months of age (9, 10, 13), and an ensuing increase in plasma leptin levels (10). We herein sought to identify the mechanisms underlying obesity caused by Ceacam1 null mutation. We found that Cc1−/− mice developed hyperleptinemia, initially associated with increased visceral obesity, and that this is followed by hyperphagia and reduced physical activity, both of which could possibly stem from leptin resistance and elevated hypothalamic fatty-acid synthase activity.
CEACAM1 is ubiquitously expressed, including the brain (24). We herein identified the arcuate nucleus region of the hypothalamus, in particular POMC-expressing neurons, as a region of CEACAM1 expression. However, other hypothalamic neuronal populations may also express CEACAM1, including agouti-related protein/neuropeptide Y neurons. CEACAM2, a close relative of CEACAM1 in mice (25), has been described in neuropeptide Y-expressing neurons of the dorsomedial hypothalamus (26) and other regions of the brain (14). This CEACAM protein contributes to suppression of food intake, as indicated by hyperphagia in mice with global null mutation of Ceacam2 (14, 27). Thus, both CEACAM1 and CEACAM2 appear to be involved in the central regulation of food intake.
Decreased activation of hypothalamic POMC neurons can lead to hyperphagia (19). Moreover, mice with total hypothalamic Pomc deficiency exhibit hyperinsulinemia, insulin intolerance, and increased body weight, because of both hyperphagia and decreased locomotor activity (28). Thus, it is possible that Ceacam1 deletion from this neuronal population contributes to the metabolic abnormalities in Cc1−/− mice, in particular with respect to hyperphagia and reduction in physical activity.
In support of this notion, rats selectively bred for low aerobic capacity (29) manifest low ambulatory activity (30), higher body weight gain, hyperinsulinemia, and insulin resistance in parallel to a marked reduction in their hepatic CEACAM1 levels relative to rats bred for high aerobic capacity (29). Given that reduced signaling through the melanocortin receptor-4 in response to α-melanocyte-stimulating hormone causes a decrease in ambulatory activity (31–33), it is possible that altered POMC neuropeptide processing to α-melanocyte-stimulating hormone is implicated in the phenotype of Cc1−/− mice.
It is unclear whether leptin resistance in CEACAM1-expressing POMC neurons alone could lead to hyperphagia in Cc1−/− mice. Deleting leptin receptors only from POMC neurons causes an increase in fat mass without significantly affecting food intake or energy expenditure (34). Conversely, restoring leptin receptors in POMC neurons does not affect food intake, but increases energy expenditure and activity (35). This suggests that signaling through leptin receptors in POMC neurons may regulate physical activity to a larger extent than food intake. Whether hyperphagia depends on deranged leptin action in POMC neurons or other neuronal populations in Cc1−/− mice remains to be determined.
CEACAM1 is not expressed in skeletal muscle (36). Thus, decreased fatty acid β-oxidation in the muscle of Cc1−/− mice is likely to be regulated by a mechanism brought about by deleting Ceacam1 at an extra-muscular site. Because altered central inhibition of the melanocortin system inhibits leptin-induced fatty acid β-oxidation in muscle (37), it is conceivable that the mechanism of decreased oxidation in Cc1−/− mice is primarily of CNS origin. This possibly includes reduction in leptin-induced fatty acid β-oxidation (38, 39) in addition to increased hypothalamic fatty-acid synthase activity that can contribute to decreased locomotor activity (40). Consistently, reduction in the mRNA of ucp-3, a surrogate marker for sympathetic activation in skeletal muscle, suggests reduction in the sympathetic tone regulating fatty acid β-oxidation in the muscle of Cc1−/− mice (41). Elevated hypothalamic FASN activity and subsequent reduction in α-adrenergic signaling to skeletal muscle (41) can contribute to muscle lipotoxicity.
The data demonstrate that null deletion of Ceacam1 altered energy balance. Several central and peripheral mechanisms can contribute to these metabolic abnormalities. Deleting hypothalamic Ceacam1 may directly affect leptin response, as discussed above. It may also remove a potential reduction in hypothalamic FASN activity by CEACAM1 (9), leading to hyperphagia (20, 40) and reduced physical activity (21, 40). Peripherally, sustained hyperinsulinemia can contribute to altered leptin action and elevating hypothalamic FASN activity by different mechanisms. First, increased hepatic lipid production in liver and redistribution to white adipose tissue cause visceral obesity and subsequently hyperleptinemia with secondary reduction in hypothalamic leptin response. Second, hyperinsulinemia may lead to enhanced phosphatidylinositol 3,4,5-triphosphate signaling and hyperpolarization of POMC neurons, which could inhibit leptin action on firing potential (42). Third, hyperinsulinemia can also lead to increased transcriptional regulation of FASN levels in the hypothalamus by sterol regulatory element-binding proteins (43), thus increasing food intake (20) and reducing physical activity (21, 40). Fourth, sustained hyperinsulinemia causes global insulin resistance, including centrally, which in turn can contribute to altered energy balance (44–46).
In conclusion, this study shows that in addition to insulin resistance, global Ceacam1 deletion causes hyperphagia and reduced spontaneous physical activity at 6 months of age. The mechanistic underpinning of this energy imbalance includes primary leptin resistance and elevated hypothalamic fatty-acid synthase activity that could, in turn, be mediated by both central and peripheral factors. Further studies are needed to dissect out the exact role of deleting neuronal CEACAM1 in leptin resistance and identifying the mechanisms involved in regulating energy supply and physical activity by CEACAM1.
Author Contributions
G. H. researched, assembled, and analyzed the data, designed the experiments, and wrote the manuscript. L. R. researched the data, assembled the figures, and wrote a first draft of the manuscript. T. R. C. researched and analyzed the data and designed the experiments. V. P., H. E. G., S. S. G., J. W., and L. D. F. researched the data, S. E. carried out the immunofluorescence analysis. M. F. M. participated in scientific discussions and in the editing of the manuscript. J. W. H. researched the data (in particular leptin signaling), designed the experiments, and participated in scientific discussions and in the editing of the manuscript. S. M. N. was responsible for study design, conceptualization, data analysis, interpretation of the results, and reviewing and revising the manuscript. S. M. N. had full access to all the data of the study and takes responsibility for the integrity and accuracy of data analysis and the decision to submit and publish the manuscript.
Acknowledgments
We thank Erin A. Semple (from the Hill laboratory) for assistance in tissue preparation for this experiment and Dr. Domenico Accili from Columbia University for providing POMC-GFP mice.
This work was supported by National Institutes of Health Grants R01 DK054254, R01 DK083850, and R01 HL112248 (to S. M. N.), R01 HD081792 (to J. W. H.), and R15 DK103196 (to M. F. M.) and in part by the Wolfe Innovation Fund (University of Toledo Foundation) and Deutsche Forschungsgemeinschaft Grants ER 276/9-1 TI 690/3-1 and SFB 688/3 A19 (to S. E.). The authors declare that they have no conflicts of interest with the contents of this article. The content is solely the responsibility of the authors and does not necessarily represent the official views of the National Institutes of Health.
- POMC
- proopiomelanocortin
- FASN
- fatty-acid synthase
- BW
- body weight.
References
- 1. Halaas J. L., Gajiwala K. S., Maffei M., Cohen S. L., Chait B. T., Rabinowitz D., Lallone R. L., Burley S. K., and Friedman J. M. (1995) Weight-reducing effects of the plasma protein encoded by the obese gene. Science 269, 543–546 [DOI] [PubMed] [Google Scholar]
- 2. Luo N., Marcelin G., Liu S. M., Schwartz G., and Chua S. Jr. (2011) Neuropeptide Y and agouti-related peptide mediate complementary functions of hyperphagia and reduced energy expenditure in leptin receptor deficiency. Endocrinology 152, 883–889 [DOI] [PMC free article] [PubMed] [Google Scholar]
- 3. Kim J. D., Leyva S., and Diano S. (2014) Hormonal regulation of the hypothalamic melanocortin system. Front. Physiol. 5, 480–486 [DOI] [PMC free article] [PubMed] [Google Scholar]
- 4. Bates S. H., Stearns W. H., Dundon T. A., Schubert M., Tso A. W., Wang Y., Banks A. S., Lavery H. J., Haq A. K., Maratos-Flier E., Neel B. G., Schwartz M. W., and Myers M. G. Jr. (2003) STAT3 signalling is required for leptin regulation of energy balance but not reproduction. Nature 421, 856–859 [DOI] [PubMed] [Google Scholar]
- 5. Allison M. B., and Myers M. G. Jr. (2014) 20 years of leptin: connecting leptin signaling to biological function. J. Endocrinol. 223, T25–35 [DOI] [PMC free article] [PubMed] [Google Scholar]
- 6. Kotronen A., Juurinen L., Tiikkainen M., Vehkavaara S., and Yki-Järvinen H. (2008) Increased liver fat, impaired insulin clearance, and hepatic and adipose tissue insulin resistance in type 2 diabetes. Gastroenterology 135, 122–130 [DOI] [PubMed] [Google Scholar]
- 7. Poy M. N., Yang Y., Rezaei K., Fernström M. A., Lee A. D., Kido Y., Erickson S. K., and Najjar S. M. (2002) CEACAM1 regulates insulin clearance in liver. Nat. Genet. 30, 270–276 [DOI] [PubMed] [Google Scholar]
- 8. DeAngelis A. M., Heinrich G., Dai T., Bowman T. A., Patel P. R., Lee S. J., Hong E. G., Jung D. Y., Assmann A., Kulkarni R. N., Kim J. K., and Najjar S. M. (2008) Carcinoembryonic antigen-related cell adhesion molecule 1: a link between insulin and lipid metabolism. Diabetes 57, 2296–2303 [DOI] [PMC free article] [PubMed] [Google Scholar]
- 9. Najjar S. M., Yang Y., Fernström M. A., Lee S. J., Deangelis A. M., Rjaily G. A., Al-Share Q. Y., Dai T., Miller T. A., Ratnam S., Ruch R. J., Smith S., Lin S. H., Beauchemin N., and Oyarce A. M. (2005) Insulin acutely decreases hepatic fatty-acid synthase activity. Cell Metab. 2, 43–53 [DOI] [PubMed] [Google Scholar]
- 10. Ghosh S., Kaw M., Patel P. R., Ledford K. J., Bowman T. A., McInerney M. F., Erickson S. K., Bourey R. E., and Najjar S. M. (2010) Mice with null mutation of Ceacam I develop nonalcoholic steatohepatitis. Hepat. Med. 2010, 69–78 [DOI] [PMC free article] [PubMed] [Google Scholar]
- 11. Lee S. J., Heinrich G., Fedorova L., Al-Share Q. Y., Ledford K. J., Fernstrom M. A., McInerney M. F., Erickson S. K., Gatto-Weis C., and Najjar S. M. (2008) Development of nonalcoholic steatohepatitis in insulin-resistant liver-specific S503A carcinoembryonic antigen-related cell adhesion molecule 1 mutant mice. Gastroenterology 135, 2084–2095 [DOI] [PMC free article] [PubMed] [Google Scholar]
- 12. Al-Share Q. Y., DeAngelis A. M., Lester S. G., Bowman T. A., Ramakrishnan S. K., Abdallah S. L., Russo L., Patel P. R., Kaw M. K., Raphael C. K., Kim A. J., Heinrich G., Lee A. D., Kim J. K., Kulkarni R. N., Philbrick W. M., and Najjar S. M. (2015) Forced hepatic overexpression of CEACAM1 curtails diet-induced Insulin resistance. Diabetes 64, 2780–2790 [DOI] [PMC free article] [PubMed] [Google Scholar]
- 13. Lester S. G., Russo L., Ghanem S. S., Khuder S. S., DeAngelis A. M., Esakov E. L., Bowman T. A., Heinrich G., Al-Share Q. Y., McInerney M. F., Philbrick W. M., and Najjar S. M. (2015) Hepatic CEACAM1 over-expression protects against diet-induced fibrosis and inflammation in white adipose tissue. Front. Endocrinol. (Lausanne) 6, 116–122 [DOI] [PMC free article] [PubMed] [Google Scholar]
- 14. Heinrich G., Ghosh S., Deangelis A. M., Schroeder-Gloeckler J. M., Patel P. R., Castaneda T. R., Jeffers S., Lee A. D., Jung D. Y., Zhang Z., Opland D. M., Myers M. G. Jr., Kim J. K., and Najjar S. M. (2010) Carcinoembryonic antigen-related cell adhesion molecule 2 controls energy balance and peripheral insulin action in mice. Gastroenterology 139, 644–652, 652.e1 [DOI] [PMC free article] [PubMed] [Google Scholar]
- 15. Ren H., Lu T. Y., McGraw T. E., and Accili D. (2015) Anorexia and impaired glucose metabolism in mice with hypothalamic ablation of Glut4 neurons. Diabetes 64, 405–417 [DOI] [PMC free article] [PubMed] [Google Scholar]
- 16. Smith A. L., Cardellichio C. B., Winograd D. F., de Souza M. S., Barthold S. W., and Holmes K. V. (1991) Monoclonal antibody to the receptor for murine coronavirus MHV-A59 inhibits viral replication in vivo. J. Infect. Dis. 163, 879–882 [DOI] [PMC free article] [PubMed] [Google Scholar]
- 17. Xu E., Dubois M. J., Leung N., Charbonneau A., Turbide C., Avramoglu R. K., DeMarte L., Elchebly M., Streichert T., Lévy E., Beauchemin N., and Marette A. (2009) Targeted disruption of carcinoembryonic antigen-related cell adhesion molecule 1 promotes diet-induced hepatic steatosis and insulin resistance. Endocrinology 150, 3503–3512 [DOI] [PubMed] [Google Scholar]
- 18. Considine R. V., Sinha M. K., Heiman M. L., Kriauciunas A., Stephens T. W., Nyce M. R., Ohannesian J. P., Marco C. C., McKee L. J., Bauer T. L. (1996) Serum immunoreactive-leptin concentrations in normal-weight and obese humans. N. Engl. J. Med. 334, 292–295 [DOI] [PubMed] [Google Scholar]
- 19. Aponte Y., Atasoy D., and Sternson S. M. (2011) AGRP neurons are sufficient to orchestrate feeding behavior rapidly and without training. Nat. Neurosci. 14, 351–355 [DOI] [PMC free article] [PubMed] [Google Scholar]
- 20. Cha S. H., Hu Z., and Lane M. D. (2004) Long-term effects of a fatty-acid synthase inhibitor on obese mice: food intake, hypothalamic neuropeptides, and UCP3. Biochem. Biophys. Res. Commun. 317, 301–308 [DOI] [PubMed] [Google Scholar]
- 21. Gao S., and Lane M. D. (2003) Effect of the anorectic fatty-acid synthase inhibitor C75 on neuronal activity in the hypothalamus and brainstem. Proc. Natl. Acad. Sci. U.S.A. 100, 5628–5633 [DOI] [PMC free article] [PubMed] [Google Scholar]
- 22. Xu A. W., Kaelin C. B., Morton G. J., Ogimoto K., Stanhope K., Graham J., Baskin D. G., Havel P., Schwartz M. W., and Barsh G. S. (2005) Effects of hypothalamic neurodegeneration on energy balance. PLoS biol. 3, e415. [DOI] [PMC free article] [PubMed] [Google Scholar]
- 23. Obici S., Zhang B. B., Karkanias G., and Rossetti L. (2002) Hypothalamic insulin signaling is required for inhibition of glucose production. Nat. Med. 8, 1376–1382 [DOI] [PubMed] [Google Scholar]
- 24. Zebhauser R., Kammerer R., Eisenried A., McLellan A., Moore T., and Zimmermann W. (2005) Identification of a novel group of evolutionarily conserved members within the rapidly diverging murine Cea family. Genomics 86, 566–580 [DOI] [PubMed] [Google Scholar]
- 25. Han E., Phan D., Lo P., Poy M. N., Behringer R., Najjar S. M., and Lin S. H. (2001) Differences in tissue-specific and embryonic expression of mouse Ceacam1 and Ceacam2 genes. Biochem. J. 355, 417–423 [DOI] [PMC free article] [PubMed] [Google Scholar]
- 26. Draper S., Kirigiti M., Glavas M., Grayson B., Chong C. N., Jiang B., Smith M. S., Zeltser L. M., and Grove K. L. (2010) Differential gene expression between neuropeptide Y expressing neurons of the dorsomedial nucleus of the hypothalamus and the arcuate nucleus: microarray analysis study. Brain Res. 1350, 139–150 [DOI] [PMC free article] [PubMed] [Google Scholar]
- 27. Patel P. R., Ramakrishnan S. K., Kaw M. K., Raphael C. K., Ghosh S., Marino J. S., Heinrich G., Lee S. J., Bourey R. E., Hill J. W., Jung D. Y., Morgan D. A., Kim J. K., Rahmouni S. K., and Najjar S. M. (2012) Increased metabolic rate and insulin sensitivity in male mice lacking the carcino-embryonic antigen-related cell adhesion molecule 2. Diabetologia 55, 763–772 [DOI] [PMC free article] [PubMed] [Google Scholar]
- 28. Lam D. D., Attard C. A., Mercer A. J., Myers M. G. Jr., Rubinstein M., and Low M. J. (2015) Conditional expression of Pomc in the Lepr-positive subpopulation of POMC neurons is sufficient for normal energy homeostasis and metabolism. Endocrinology 156, 1292–1302 [DOI] [PMC free article] [PubMed] [Google Scholar]
- 29. Wisløff U., Najjar S. M., Ellingsen O., Haram P. M., Swoap S., Al-Share Q., Fernström M., Rezaei K., Lee S. J., Koch L. G., and Britton S. L. (2005) Cardiovascular risk factors emerge after artificial selection for low aerobic capacity. Science 307, 418–420 [DOI] [PubMed] [Google Scholar]
- 30. Thyfault J. P., Rector R. S., Uptergrove G. M., Borengasser S. J., Morris E. M., Wei Y., Laye M. J., Burant C. F., Qi N. R., Ridenhour S. E., Koch L. G., Britton S. L., and Ibdah J. A. (2009) Rats selectively bred for low aerobic capacity have reduced hepatic mitochondrial oxidative capacity and susceptibility to hepatic steatosis and injury. J. Physiol. 587, 1805–1816 [DOI] [PMC free article] [PubMed] [Google Scholar]
- 31. Mul J. D., van Boxtel R., Bergen D. J., Brans M. A., Brakkee J. H., Toonen P. W., Garner K. M., Adan R. A., and Cuppen E. (2012) Melanocortin receptor 4 deficiency affects body weight regulation, grooming behavior, and substrate preference in the rat. Obesity (Silver Spring) 20, 612–621 [DOI] [PMC free article] [PubMed] [Google Scholar]
- 32. Chen A. S., Metzger J. M., Trumbauer M. E., Guan X. M., Yu H., Frazier E. G., Marsh D. J., Forrest M. J., Gopal-Truter S., Fisher J., Camacho R. E., Strack A. M., Mellin T. N., MacIntyre D. E., Chen H. Y., and Van der Ploeg L. H. (2000) Role of the melanocortin-4 receptor in metabolic rate and food intake in mice. Transgenic Res. 9, 145–154 [DOI] [PubMed] [Google Scholar]
- 33. Ste Marie L., Miura G. I., Marsh D. J., Yagaloff K., and Palmiter R. D. (2000) A metabolic defect promotes obesity in mice lacking melanocortin-4 receptors. Proc. Natl. Acad. Sci. U.S.A. 97, 12339–12344 [DOI] [PMC free article] [PubMed] [Google Scholar]
- 34. Balthasar N., Coppari R., McMinn J., Liu S. M., Lee C. E., Tang V., Kenny C. D., McGovern R. A., Chua S. C. Jr., Elmquist J. K., and Lowell B. B. (2004) Leptin receptor signaling in POMC neurons is required for normal body weight homeostasis. Neuron 42, 983–991 [DOI] [PubMed] [Google Scholar]
- 35. Berglund E. D., Vianna C. R., Donato J. Jr., Kim M. H., Chuang J. C., Lee C. E., Lauzon D. A., Lin P., Brule L. J., Scott M. M., Coppari R., and Elmquist J. K. (2012) Direct leptin action on POMC neurons regulates glucose homeostasis and hepatic insulin sensitivity in mice. J. Clin. Invest. 122, 1000–1009 [DOI] [PMC free article] [PubMed] [Google Scholar]
- 36. Najjar S. M. (2002) Regulation of insulin action by CEACAM1. Trends. Endocrinol. Metab. 13, 240–245 [DOI] [PubMed] [Google Scholar]
- 37. Tanaka T., Masuzaki H., Yasue S., Ebihara K., Shiuchi T., Ishii T., Arai N., Hirata M., Yamamoto H., Hayashi T., Hosoda K., Minokoshi Y., and Nakao K. (2007) Central melanocortin signaling restores skeletal muscle AMP-activated protein kinase phosphorylation in mice fed a high fat diet. Cell Metab. 5, 395–402 [DOI] [PubMed] [Google Scholar]
- 38. Muoio D. M., Dohm G. L., Fiedorek F. T. Jr., Tapscott E. B., Coleman R. A., and Dohn G. L. (1997) Leptin directly alters lipid partitioning in skeletal muscle. Diabetes 46, 1360–1363 [DOI] [PubMed] [Google Scholar]
- 39. Minokoshi Y., Kim Y. B., Peroni O. D., Fryer L. G., Müller C., Carling D., and Kahn B. B. (2002) Leptin stimulates fatty-acid oxidation by activating AMP-activated protein kinase. Nature 415, 339–343 [DOI] [PubMed] [Google Scholar]
- 40. Chakravarthy M. V., Zhu Y., López M., Yin L., Wozniak D. F., Coleman T., Hu Z., Wolfgang M., Vidal-Puig A., Lane M. D., and Semenkovich C. F. (2007) Brain fatty-acid synthase activates PPARα to maintain energy homeostasis. J. Clin. Invest. 117, 2539–2552 [DOI] [PMC free article] [PubMed] [Google Scholar]
- 41. Cha S. H., Hu Z., Chohnan S., and Lane M. D. (2005) Inhibition of hypothalamic fatty-acid synthase triggers rapid activation of fatty acid oxidation in skeletal muscle. Proc. Natl. Acad. Sci. U.S.A. 102, 14557–14562 [DOI] [PMC free article] [PubMed] [Google Scholar]
- 42. Plum L., Ma X., Hampel B., Balthasar N., Coppari R., Münzberg H., Shanabrough M., Burdakov D., Rother E., Janoschek R., Alber J., Belgardt B. F., Koch L., Seibler J., Schwenk F., et al. (2006) Enhanced PIP3 signaling in POMC neurons causes KATP channel activation and leads to diet-sensitive obesity. J. Clin. Invest. 116, 1886–1901 [DOI] [PMC free article] [PubMed] [Google Scholar]
- 43. Osborne T. F. (2000) Sterol regulatory element-binding proteins (SREBPs): key regulators of nutritional homeostasis and insulin action. J. Biol. Chem. 275, 32379–32382 [DOI] [PubMed] [Google Scholar]
- 44. Obici S., and Rossetti L. (2003) Minireview: nutrient sensing and the regulation of insulin action and energy balance. Endocrinology 144, 5172–5178 [DOI] [PubMed] [Google Scholar]
- 45. Woods S. C., Lotter E. C., McKay L. D., and Porte D. Jr. (1979) Chronic intracerebroventricular infusion of insulin reduces food intake and body weight of baboons. Nature 282, 503–505 [DOI] [PubMed] [Google Scholar]
- 46. Plum L., Belgardt B. F., and Brüning J. C. (2006) Central insulin action in energy and glucose homeostasis. J. Clin. Invest. 116, 1761–1766 [DOI] [PMC free article] [PubMed] [Google Scholar]