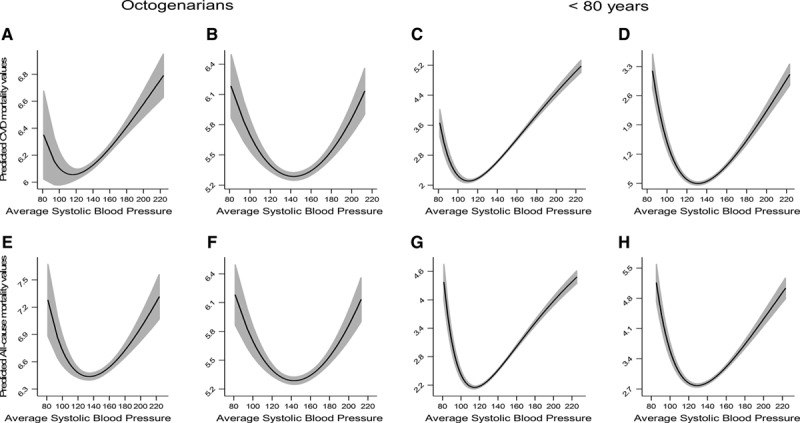
Figure 4.

Fractional polynomial plots presenting the quadratic relationship between continuous systolic blood pressure (SBP) with total (A) and treated (B) cardiovascular disease (CVD) mortality and total (E) and treated (F) all-cause mortality among octogenarians (left) and the quadratic relationship between continuous SBP with total (C) and treated (D) CVD mortality and total (G) and treated (H) all-cause mortality among participants <80 years of age (right).
