

Abstract
Mutations in Amyloid β Precursor Protein (APP) and in genes that regulate APP processing – such as PSEN1/2 and ITM2b/BRI2 – cause familial dementia, such Familial Alzheimer disease (FAD), Familial Danish (FDD) and British (FBD) dementias. The ApoE gene is the major genetic risk factor for sporadic AD. Three major variants of ApoE exist in humans (ApoE2, ApoE3, and ApoE4), with the ApoE4 allele being strongly associated with AD. ITM2b/BRI2 is also a candidate regulatory node genes predicted to mediate the common patterns of gene expression shared by healthy ApoE4 carriers and late-onset AD patients not carrying ApoE4. This evidence provides a direct link between ITM2b/BRI2 and ApoE4. To test whether ApoE4 and pathogenic ITM2b/BRI2 interact to modulate learning and memory, we crossed a mouse carrying the ITM2b/BRI2 mutations that causes FDD knocked-in the endogenous mouse Itm2b/Bri2 gene (FDDKI mice) with human ApoE3 and ApoE4 targeted replacement mice. The resultant ApoE3, FDDKI/ApoE3, ApoE4, FDDKI/ApoE4 male mice were assessed longitudinally for learning and memory at 4, 6, 12, and 16– 17 months of age. The results showed that ApoE4-carrying mice displayed spatial working/short-term memory deficits relative to ApoE3-carrying mice starting in early middle age, while long-term spatial memory of ApoE4 mice was not adversely affected even at 16–17 months, and that the FDD mutation impaired working/short-term spatial memory in ApoE3-carrying mice and produced impaired long-term spatial memory in ApoE4-carrying mice in middle age. The present results suggest that the FDD mutation may differentially affect learning and memory in ApoE4 carriers and non-carriers.
Keywords: Alzheimer disease, Familial Danish dementia, BRI2, ApoE
1. Introduction
Alzheimer’s disease (AD), the most common neurodegenerative disease among the elderly, is characterized clinically by progressive memory loss and cognitive decline and pathologically by neuropathological markers such as extracellular deposits of amyloid beta (Aβ) peptides as neuritic plaques and intracellular neurofibrillary tangles (Selkoe, 1991, 2011). Aβ peptides are produced by sequential proteolysis of APP by β- and γ-secretases. Mutations in APP and two genes coding for the catalytic subunit of the γ-secretases – PSEN1 and PSEN2 – are linked to FAD (Hardy, 1997; Selkoe, 2002; Sherrington et al., 1995).
ApoE is a 299-amino-acid glycoprotein involved in lipid transport and cholesterol homeostasis (Mahley, 1988). In the brain, ApoE is synthesized and secreted mainly by astrocytes and is a major component of high-density lipoprotein particles (Beffert et al., 1998; Boyles, Pitas, Wilson, Mahley, & Taylor, 1985; Pitas, Boyles, Lee, Hui, & Weisgraber, 1987). ApoE fulfills several functions in brain (Beffert et al., 1998). Cholesterol released from ApoE-containing lipoprotein particles is utilized to support synaptogenesis and the maintenance of synaptic connections (Pfrieger, 2003). In response to neuronal damage or degeneration, ApoE engages in clearance and redistribution of lipid and cholesterol debris, serving as a scavenger of lipophilic molecules during nerve regeneration (Hauser, Narayanaswami, & Ryan, 2011). The three major isoforms – ApoE2, ApoE3, and ApoE4 – result from three allelic variants of a single gene on chromosome 19 (Weisgraber, Rall, & Mahley, 1981; Zannis & Breslow, 1981). Of these, the ApoE4 allele has been identified as the major genetic risk factor for late-onset familial and sporadic AD, and its gene dose is correlated with increased risk and earlier age at onset of the disease (Corder et al., 1993; Saunders et al., 1993), although the risk of developing AD attributable to ApoE4 varies by geographical region (Bosco et al., 2005; Crean et al., 2011; Panza et al., 1999) and by race and ethnicity (Tang et al., 1996, 1998). In addition, ApoE4 has been shown to be a genetic risk factor for memory decline in non-demented humans (Baxter, Caselli, Johnson, Reiman, & Osborne, 2003; Bondi et al., 1995; Flory, Manuck, Ferrell, Ryan, & Muldoon, 2000; Wilson et al., 2002). By contrast, the ApoE2 allele has been shown to have protective effects on AD (Corder et al., 1994; Panza et al., 2000; West, Rebeck, & Hyman, 1994), while the ApoE3 allele, which is the most predominant isoform accounting almost 80% of alleles in general population, is considered to be neutral (Frieden & Garai, 2012). Numerous studies have attempted to elucidate the mechanisms underlying the role of ApoE4 in the pathogenesis of AD (Huang, 2011; Kim, Basak, & Holtzman, 2009; Kim, Yoon, Basak, & Kim, 2014; Yu, Tan, & Hardy, 2014). Some evidence suggests that ApoE4 plays a role through its effects on Aβ aggregation (Bales et al., 2009; Youmans et al., 2012) and clearance (Bachmeier et al., 2014; Bell et al., 2007; Castellano et al., 2011). It has also been proposed that ApoE4 may interfere with cholesterol transport from astrocytes to synaptic compartments, inducing synapse loss and eventually neurodegeneration (Pfrieger, 2003). Other proposed potential pathogenic mechanisms include differential effects of ApoE isoforms on tau phosphorylation, cerebral energy metabolism, neuroinflammation, neurovascular function, neurogenesis, and synaptic plasticity (Huang, 2011; Kim et al., 2014; Yu et al., 2014). Despite extensive research efforts, however, the exact role of ApoE4 in the etiology of AD remains to be fully elucidated.
FDD and FBD are two other neurodegenerative disorders that are caused by two independent autosomal dominant mutations in the same gene, BRI2/ITM2b (Ghiso et al., 2006; Holton et al., 2002; Vidal et al., 1999, 2000). Clinically, patients with FDD exhibit early-onset cataracts, deafness, progressive ataxia, and dementia (Holton et al., 2002; Stromgren, Dalby, Dalby, & Ranheim, 1970), while FBD is characterized by spastic paralysis, cerebellar ataxia, and progressive dementia (Plant, Revesz, Barnard, Harding, & Gautier-Smith, 1990; Worster-Drought, Hill, & McMenemey, 1933). A number of clinical and neuropathological features are shared by FDD, FBD, and FAD/AD, including dementia, neurodegeneration, and the presence of amyloid deposition and NFTs (Holton et al., 2002; Plant et al., 1990; Revesz et al., 1999; Rostagno et al., 2002; Selkoe, 1991, 2011). The mature form of BRI2 (mBRI2) binds to APP and inhibits its cleavage by secretases (Fotinopoulou et al., 2005; Matsuda, Giliberto, Matsuda, McGowan, & D’Adamio, 2008; Matsuda, Matsuda, Snapp, & D’Adamio, 2011; Matsuda et al., 2005), and, in FDD patients, APP processing is augmented due to loss of BRI2 protein (Matsuda, Tamayev, & D’Adamio, 2011), suggesting that, as in AD, alterations of APP processing may be involved in the pathogenic mechanisms underlying FDD and FBD as well.
In order to shed more light on the pathogenesis of dementias induced by mutations in the BRI2/ITM2b gene, we generated mouse knock-in models of FDD (FDDKI) and FBD (FBDKI) by replacing the exon 6 of the murine BRI2 gene with a mutated exon 6 carrying either the human FDD (Giliberto, Matsuda, Vidal, & D’Adamio, 2009; Tamayev, Matsuda, Fa, Arancio, & D’Adamio, 2010) or FBD mutation (Tamayev, Giliberto, et al., 2010). Genetically faithful to the human FDD and FBD pathology, FDDKI and FBDKI mice carry one mutant and one wild type BRI2 allele. Both FDDKI and FBDKI mice have lower brain and synaptic levels of BRI2 and do not develop cerebral amyloidosis, tauopathy, and neuronal loss (Giliberto, Matsuda, Vidal, & D’Adamio, 2009; Tamayev, Giliberto, et al., 2010; Tamayev, Matsuda, et al., 2010). Yet, FDDKI mice exhibit reduced hippocampal synaptic plasticity relative to wild-type (WT) littermates (Tamayev, Matsuda, et al., 2010). Bri2 haplodeficient mice display synaptic plasticity impairments similar to those seen in FDDKI and FBDKI mice (Tamayev, Matsuda, et al., 2010), suggesting that FDD and FBD dementias are caused by a loss of normal BRI2 function. Moreover, synaptic dysfunctions caused by the FDD mutation is dependent on endogenous APP and probably on the β-secretase APP product β-CTF, (Tamayev & D’Adamio, 2012; Tamayev, Matsuda, Arancio, & D’Adamio, 2012; Tamayev, Matsuda, Giliberto, Arancio, & D’Adamio, 2011), suggesting that β-carboxyl-terminal fragment (β-CTF), which is a product of β-cleavage of APP and has neurotoxic effects unrelated to deposition of Aβ plaques (Nalbantoglu et al., 1997; Oster-Granite, McPhie, Greenan, & Neve, 1996; Suh et al., 2000), may be a possible toxic molecule causing dementias induced by BRI2/ITM2b mutations.
These findings provide a link between BRI2/ITM2b and AD, supporting further the hypothesis that AD, FDD, and FBD have common pathogenic mechanisms. It is therefore of interest to examine how the FDD mutation of BRI2/ITM2b may interact functionally with ApoE isoforms, especially ApoE4, in the regulation of cognitive functions and behavior with advancing age. To that end, we crossed FDDKI mice with ApoE3 and ApoE4 human targeted replacement mice expressing one human variant (ApoE3 or ApoE4) in place of the mouse ApoE gene under the control of the ApoE mouse promoter (Knouff et al., 1999; Sullivan, Mace, Maeda, & Schmechel, 2004; Sullivan et al., 1997). The resultant male mice of the F2 generation of four genotypes (ApoE3, FDDKI/ApoE3, ApoE4, FDDKI/ApoE4) were longitudinally tested for learning and memory at 4, 6, 12, and 16–17 months of age. The mice we are studying have both murine ApoE alleles replaced by either human APOE3 (indicated as ApoE3 mice) or APOE4 (indicated as ApoE4 mice). The FDDKI indicates mice with a wild type Itm2b/Bri2 allele and the other allele carrying the FDD mutation, just like the humans with the FDD mutation (Giliberto, Matsuda, Vidal, & D’Adamio, 2009).
2. Materials and methods
2.1. Mice
All experimental mice were male F2 hybrid mice on a C57BL/6 × 129 background and generated and maintained at the Animal facility of the Albert Einstein College of Medicine. F1 ApoE3 and ApoE4 targeted replacement mice, in which the endogenous mouse ApoE gene was replaced by human ApoE3 or ApoE4, respectively, under the control of the mouse ApoE promoter (Knouff et al., 1999; Sullivan et al., 1997), were crossed with F1 FDDKI mice carrying one mutant and one wild type BRI2/ITM2b allele (Giliberto et al., 2009) to generate four genotypes (ApoE3, FDDKI/ApoE3, ApoE4, and FDDKI/ApoE4) of F2 mice (n = 16–25 per genotype). Upon weaning, all mice were implanted with electronic chips (PharmaSeq, Monmouth Junction, NJ) subcutaneously on the tail for identification purposes, and their identity was checked regularly during testing periods. Animals were group-housed in plastic cages with ad libitum access to food and water in a temperature-and humidity-controlled animal care facility with a 12 h light/12 h dark cycle. All behavioral testing was conducted during the light cycle. All experimental procedures were in accordance with the National Institutes of Health guidelines and approved by the Institutional Animal Care and Use Committee (IACUC) at the Albert Einstein College of Medicine in animal protocol number 20130509.
2.2. Experimental procedures
All mice were extensively handled prior to the start of behavioral testing. On each testing day, animals were transported to a behavioral testing suite in their home cages and allowed to acclimate for at least 30 min before testing began.
2.2.1. Elevated zero maze
Mice were first tested for anxiety-like behavior on the elevated zero maze at 4 months of age. The zero maze (Stoelting, Wood Dale, IL) consisted of an annular platform (inner diameter 50 cm, width 5 cm) elevated to 50 cm above the ground level, divided equally into four quadrants. Two opposite quadrants were enclosed by walls (15 cm high) on both the inner and outer edges of the platform (closed areas), while the remaining two opposite quadrants were open without walls (open areas). Light levels over the maze were kept constant at approximately 50 lx in the open areas and 30 lx in the closed areas. Mice were placed individually in a closed quadrant and allowed to explore the maze freely for 5 min. The behavior of mice was monitored using a video camera, and their movements were analyzed with a video tracking system (ANY-maze, Stoelting). The percentage of time spent in the open and closed areas was used as measures of anxiety-like behavior, with larger time in the open arms indicating lower levels of anxiety.
2.2.2. Open field
The open field test was conducted to assess animals’ general locomotor activity, exploratory behavior, and anxiety-like behavior at 4 months of age. The task also served as habituation to the box for the novel object recognition test (see below). The open field apparatus (Stoelting) consisted of a square open field (40 cm × 40 cm) surrounded by opaque walls (35 cm high) and was dimly lit with a single light bulb directly above the apparatus, which illuminated the arena at approximately 5 lx in the center and 9 lx in corners. Each mouse was placed in the center of the open field box and allowed to explore the box freely for 10 min. The total distance traveled and the number of entries into, and the time spent in, the center of the arena (20 cm × 20 cm) were recorded with a video tracking system (ANY-maze). This was repeated for three consecutive days to assess how animals would habituate to the increasingly familiar environment.
2.2.3. Novel object recognition
Twenty-four hours after the last open field session, the same apparatus was used to perform the novel object recognition test to assess visual recognition memory, which is a non-aversive task that relies on rodents’ natural exploratory behavior. During the training session, two identical non-toxic objects were placed in opposite and symmetrical corners of the arena, and mice were released against the center of the opposite wall with its back to the objects and allowed to explore the objects for 10 min. After a 24-h retention interval, one of the objects was replaced by a novel object, and the animal was returned to the arena and allowed to explore the objects for 10 min. Object exploration was defined as the animal’s nose pointing to the object at a distance of 2 cm or less. The amount of time the animal spent exploring each object was recorded by a video tracking system (ANY-maze) and used to calculate an object discrimination ratio, which was obtained by dividing the time the mice spends exploring the novel object by the total amount of time spent exploring the two objects. The novelty of the objects (i.e., novel vs. familiar) and the location of the novel object (i.e., left vs. right) were counterbalanced within each genotype to reduce object and place preference effects.
2.2.4. Morris water maze
Mice were tested in the water maze for spatial reference memory at 6, 12, and 16–17 months and for spatial working memory at 12 months of age. The water maze consisted of a circular tank (120 cm in diameter) filled with water made opaque with nontoxic white paint and maintained slightly above the room temperature (25 ± 2 °C). All water maze tasks involved the animal finding a circular platform (10 cm in diameter) submerged in the water in order to escape from the water. On each trial, the mouse was released into the water facing the wall of the pool and allowed to swim freely in the pool to find the platform for up to 60 s. The experimenter’s position was maintained at the southeast (SE) corner of the room far from the tank for all the water maze tasks conducted at different ages. The experimenter was visible to the animal but remained stationary. Once the animal located the platform, it was allowed to stay on it for 15 s. Any mouse not locating the platform within 60 s was guided to the platform and allowed to stay on it for 15 s. After 15 s on the platform, the animal was removed from the pool, gently dried with paper towels, and placed in a single holding cage under a heat lamp until the next trial. A video tracking system (HVS 2020 and 2014; HVS Image, Mountain View, CA) was used to measure the distance traveled, escape latency, and swim speed.
2.2.4.1. Visible platform task
Prior to the start of each memory task, a visible platform task, in which the platform was made visible by attaching a small flag (7 cm × 5 cm) to it, was conducted to examine whether mice had any visual, motor, or motivational deficits at that particular age. Three daily sessions, with four trials a day, were given, in which both the platform location and the starting position were changed in a semi-random manner between trials to ensure that the animal was using the proximal cue (i.e., flag) to locate the platform. The distance traveled to the platform and swim speed were measured by the HVS video tracking system.
2.2.4.2. Reference memory task
The Morris water maze hidden platform task was performed to assess spatial reference memory at 6, 12, and 16–17 months of age. In this task, the platform was hidden 1 cm below the water level, and distal visual cues were placed on the walls surrounding the pool.
The location of the hidden platform remained constant across the acquisition sessions, while the starting position was varied in a pseudo-random manner between trials within each session. At 6 months, mice received two daily sessions of three trials (six trials per day) with an inter-trial interval of 8–10 min for six consecutive days. The platform was located at the center of the fourth quadrant between the center and the northwest (NW). Mice were tested again at 12 and 16–17 months and received three trials per day with an inter-trial interval of 8–10 min for four (12 months) or seven consecutive days (16–17 months). During the experiment conducted at 12 months, the platform was placed at the center of the first quadrant between the center and the northeast (NE). At the age of 16–17 months, the tank was rotated by 45 degrees, and the platform was placed at the center of the second quadrant between the center and the southeast (SE). Moreover, all the visual cues surrounding the tank were changed to create a new configuration.
Tables 1–3 illustrate the release positions and corresponding platform locations used for the acquisition phase and probe trials at the above-mentioned ages. The distance traveled by the mouse to reach the platform and the time it took the animal to find it were recorded by the HVS video tracking system. Two (6, 12, and 16– 17 months) and five (12 and 16–17 months) days after the last acquisition session, probe trials were given, during which the platform was removed from the pool, and each mouse was released from the quadrant opposite to the trained platform location and allowed to search the pool for 60 s. The distance traveled and time spent in the target quadrant, where the platform had been located prior to its removal, the number of crossings of a circular area encompassing the original platform location (counter: 2 × platform diameter), and the average proximity to the former platform location were measured to assess the animal’s spatial reference memory for the location of the hidden platform.
Table 1.
Morris water maze reference. 6-mo; platform 4.
| Day | Trial 1 | Trial 2 | Trial 3 | Trial 4 | Trial 5 | Trial 6 |
|---|---|---|---|---|---|---|
| 1 | E | SW | SE | NE | S | W |
| 2 | S | N | E | SW | NE | SE |
| 3 | NE | SW | E | SE | W | S |
| 4 | E | N | S | NE | SW | SE |
| 5 | SW | NE | SE | W | E | S |
| 6 | E | S | N | SE | SW | NE |
| 9 (probe 2d) | NE |
Table 3.
16–17-months; platform 2.
| Day | Trial 1 | Trial 2 | Trial 3 |
|---|---|---|---|
| 1 | N | SW | NE |
| 2 | W | NNE | NW |
| 3 | NE | NWW | SW |
| 4 | NW | SWW | N |
| 5 | SW | NE | W |
| 6 | NE | NW | SWW |
| 7 | NWW | SW | NNE |
| 9 (probe 2d) | NE | ||
| 12 (probe 5d) | NE |
2.2.4.3. Working memory task
Mice were tested in the water maze for working memory at 12 months. In the working task, the position of the hidden platform varied from day to day but remained in the same place throughout the trials of a given day. The starting position was pseudo-randomly changed from trial to trial within a given day. On each day, four trials (1 “cued” trial + 3 test trials) were given. On the cued trial, each mouse was placed on the platform for 20 s, after which it was removed from the platform to a single holding cage, where it remained for 5 min. After 5 min, three test trials were given, with an inter-trial interval of 10–15 min. On each test trial, the animal was allowed to swim freely to find the hidden platform up to 60 s. Any mouse not locating the platform within 60 s was guided to the platform and allowed to stay on it for 15 s. Mice were tested for 10 days, with a one-day break after the seventh day. The distance traveled for each mouse was averaged over the last three days of testing and used for statistical analysis.
2.2.5. Y-maze
Mice were tested in the Y-maze for spatial recognition memory at 16–19 months. The Y-maze consisted of three arms of equal length (35 cm) and width (5 cm), which were interconnected at 120° and enclosed by walls (10 cm high). The inside of the arms were identical, providing no intra-maze cues. The maze was placed under a bright distal visual cues. During the first trial (training trial), one of the arms of the maze was blocked, and mice were placed into one of the remaining arms of the maze (start arm) and allowed to explore the unblocked two arms for 10 min. After a 1-h inter-trial interval, the blocked arm was opened (novel arm), and mice were placed in the start arm and allowed to explore freely all three arms of the maze for 5 min (test trial). The number of entries into and the time spent in each arm, and the first choice of entry were registered by a video tracking system (ANY-maze). The position of the novel vs. known arms (i.e., left or right) was counterbalanced within each genotype to reduce place preference effects. This test takes advantage of the innate tendency of mice to explore novel unexplored areas (e.g., the previously blocked arm). Mice with intact recognition memory will prefer to explore a novel arm over the familiar arms, whereas mice with impaired spatial memory will enter all arms randomly.
2.3. Statistical analysis
Statistical analysis of most data was performed by analysis of variance (ANOVA), with one between-subjects factor (genotype) and, when appropriate, a within-subjects factor (e.g., day). The Y-maze first-choice arm data were analyzed by chi-square test. When significant effects were found, the data were further analyzed by post hoc comparison tests (Tukey’s, Dunnett’s, or Fisher’s LSD). The level of significance was set at p < 0.05. Statistical analyses were carried out using the Prism software (GraphPad, La Jolla, CA).
3. Results
3.1. Four months
Behavioral testing was initiated in young adulthood at four months of age, when mice were first tested on the elevated zero maze, followed by the open field test and then by the novel object recognition test.
3.1.1. Elevated zero maze
Mice were first tested for anxiety-like behavior on the elevated zero maze. Four animals (1 ApoE3, 2 FDDKI/ApoE3, and 1 ApoE4) fell off the open areas of the maze during testing and were excluded from the data analysis. Fig. 1 shows the percentage of time spent in the open areas of the zero maze. Although ApoE4 mice spent more time in the open areas on average than mice of the other genotypes, one-way ANOVA found no significant effect of genotype, F(3,78) = 0.72, p = 0.5434.
Fig. 1.

Mean (±S.E.M.) percentage of time spent in the open areas of the elevated zero maze at 4 months of age. No significant effect of genotype was found.
3.1.2. Open field
Following the elevated zero maze test, mice were assessed for general locomotor activity levels and anxiety-like behavior in the open field. The results of the open field test over the three-day period are shown in Fig. 2. As shown in Fig. 2A, two-way ANOVA on the mean distance traveled during the 10-min testing period over three days found a significant main effect for day, F(2,164) = 167.7, p < 0.0001, indicating that mice habituated to the box over the three-day period, but no significant main effect for genotype, F(3,82) = 0.25, p = 0.8617, or interaction between genotype and day, F(6,164) = 1.19, p = 0.3144, indicating that mice of all genotypes habituated to the box in a similar manner. Similarly, the analysis of the time spent traveling at speed greater than 50 mm/s yielded a significant main effect for day, F(2,164) = 235.2, p < 0.0001, but no significant genotype main effect, F(3,82) = 0.17, p = 0.9181, or day × genotype interaction, F(6,164) = 1.11, p = 0.3594 (Fig. 2B). Thus, no differences were found among the four genotypes in measures of general locomotor activity. Fig. 2C shows the mean time spent in the center of the open field. On Day 1, ApoE4 mice spent more time in the arena center than mice of the other genotypes. On Days 2 and 3, ApoE4 and FDDKI/ApoE4 mice spent more time in the center than FDDKI/ApoE3 or ApoE3 mice, with FDDKI/ApoE3 mice spending the least amount of time. However, while ANOVA showed a significant main effect for day, F(2,164) = 6.61, p < 0.01, it found no significant main effect for genotype, F(3,82) = 1.64, p = 0.1864, or significant interaction between day and genotype, F(6,164) = 1.53, p = 0.1726. As indicated in Fig. 2D, the analysis of the number of entries into the arena center also showed a significant main effect for day, F(2,164) = 63.27, p < 0.0001, but no significant genotype main effect, F(3,82) = 0.78, p = 0.5058, or significant day × genotype interaction, F(6,164) = 0.75, p = 0.6099.
Fig. 2.

Performance in the open field at 4 months of age. Data are expressed as means (±S.E.M.) during the 10-min testing period over 3 days. (A) Total distance traveled. (B) Amount of time in which the animal ambulated at speed greater than 50 mm/s. There were no differences among the genotypes in general locomotor activity or habituation. (C) Amount of time the animal spent in the center of the arena (20 cm × 20 cm). (D) Total number of entries into the arena center. No significant differences were found in anxiety-related behavior.
3.1.3. Novel object recognition
One day after the completion of the open field test, the novel object recognition test was conducted to examine mice for visual recognition memory. The three-day open filed test had served as habituation for this test. Eleven mice (4 ApoE3, 4 FDDKI/ApoE3, and 3 FDDKI/ApoE4) that spent less than 10 s in total exploring the objects on either the training day or the test day were excluded from the statistical analysis. Fig. 3A depicts the time spent exploring two identical objects on the training day. Two-way ANOVA found no significant effect for side (i.e., left vs. right), F(1,71) = 0.40, p = 0.5289, indicating that mice spent the equal amount of time exploring the two identical objects. There was also no significant main effect for genotype, F(3,71) = 0.34, p = 0.7995, or significant interaction between side and genotype, F(3,71) = 0.69, p = 0.5597. The mean time spent exploring the novel and familiar objects on the test day (24 h after the training session) is shown in Fig. 3B. A significant main effect for novelty was found, F(1,71) = 28.3, p < 0.0001, indicating that, overall, mice spent significantly more time exploring the novel object than the familiar object. However, there was no significant genotype main effect, F(3,71) = 0.82, p = 0.4869, or significant interaction between novelty and genotype, F(3,71) = 0.08, p = 0.9713, showing that mice of all genotypes explored the novel and familiar objects in a similar manner. The analysis of the discriminatory ratios also showed no significant effect of genotype, F(3,71) = 0.86, p = 0.4647, although, as can be seen in Fig. 3C, FDDKI/ApoE3 mice had a lower mean discriminatory ration than did mice of the other genotypes. Thus, at 4 months of age, no significant differences were found among the genotypes in long-term visual recognition memory.
Fig. 3.

Performance on the novel object recognition test at 4 months of age. Data are expressed as means ± S.E.M. (A) Performance on the training day with two identical objects. Mice of all the genotypes spent equal time on the two identical objects. (B) Performance on the testing day after a 24-h retention interval. Mice of all the genotypes spent more time exploring the novel object than the familiar object. Statistical analysis was performed by Two-way RM ANOVA followed by uncorrected Fisher’s LSD (*p < 0.05, **p < 0.01). (C) Discriminatory ratios. No significant differences were found among the genotypes.
3.2. Six months
3.2.1. Morris water maze reference memory task
Mice were tested in the Morris water maze for spatial reference memory at 6 months of age. Five mice (4 ApoE3 and 1 FDDKI/ApoE3) were dropped from the study prior to the start of this experiment. As shown in Fig. 4A and B, the visible platform task conducted prior to the reference memory task revealed no significant differences among the four genotype groups in path length traveled, F(3,77) = 1.23, p = 0.3031, or swim speed, F(3,77) = 0.39, p = 0.7579, indicating that mice of the four genotypes did not differ in visual-motor abilities. Fig. 4C depicts the mean path length traveled by mice during the acquisition phase of the hidden platform task. Two-way ANOVA revealed a significant main effect for day, F(5,385) = 54.19, p < 0.0001, indicating animals’ acquisition of reference memory for the platform location. However, there was no significant main effect for genotype, F(3,77) = 0.23, p = 0.8781, or significant interaction between day and genotype, F(15,385) = 0.84, p = 0.6328, showing that mice of all four genotypes learned the task in a similar way. On the probe trial given 48 h after the last acquisition session, as shown in Fig. 4D, the analysis of the percentage of path length traveled in the four quadrants revealed no significant differences among the genotypes, with mice of all genotypes traveling the largest proportion of path length in the quadrant in which the platform had been formerly located (Quadrant 4). ANOVA showed a significant main effect for quadrant, F(3,231) = 26.75, p < 0.0001, but no significant genotype main effect, F(3,77) = 1.43, p = 0.2415, or quadrant × genotype interaction, F(9,231) = 0.68, p = 0.7274. Similarly, no significant differences were detected among the genotypes in the analysis of the percentage of time spent in the four quadrants, with ANOVA showing a significant main effect for quadrant, F(3,231) = 22.12, p < 0.0001, but no significant genotype main effect, F(3,77) = 0.49, p = 0.6935, or quadrant × genotype interaction, F(9, 231) = 0.67, p = 0.7313 (Fig. 4E). As can be seen in Fig. 4F, the analysis of the number of counter crossings in the target quadrant revealed no significant effect of genotype, F(3,77) = 0.14, p = 0.9333. There was also no significant effect of genotype on the average proximity to the former platform location, F(3,77) = 0.21, p = 0.8892 (Fig. 4G). In sum, at 6 months of age, no differences were found among the four genotypes in either the acquisition or retention of spatial reference memory in the Morris water maze.
Fig. 4.

Performance in the Morris water maze at 6 months of age. Data are expressed as means ± S.E.M. (A and B) Performance on the visible platform task. There were no significant differences among the genotypes in path length traveled (A) or swim speed (B). (C) Acquisition of spatial reference memory in the hidden platform task. Mean path lengths across 6 daily trials are shown. There were no differences among the genotypes in performance during acquisition. (D–G) Performance on the 60-s probe trial given 2 days after the last acquisition session. (D) Percentage of path length traveled in the four quadrants. (E) Percentage of time spent in the four quadrants. (F) Number of counter crossings in the target quadrant (Quadrant 4). (G) Average proximity to the former platform location. No significant differences were found among the genotypes in any of the measures. Statistical analysis was performed by Two-way RM ANOVA followed by Tukey’s multiple comparisons test (*p < 0.05, **p < 0.01, ***p < 0.001, ****p < 0.0001).
3.3. Twelve months
3.3.1. Morris water maze reference memory task
At 12 months of age, mice were tested for spatial reference memory again in the Morris water maze. At this age, the number of daily trials was reduced to three. In addition, a second probe trial was given 5 days after the last acquisition session to examine animals’ retention of spatial reference memory with a longer retention interval. Nine mice (1 ApoE3, 1 FDDKI/ApoE3, 1 ApoE4, and 6 FDDKI/ApoE4) were dropped from the study prior to the start of testing at this age. Fig. 5A and B shows the path length traveled and swim speed, respectively, in the visible platform task conducted prior to the reference memory task at this age. There were no significant genotype effects in either path length, F(3,69) = 0.11, p = 0.9564 (Fig. 5A), or swim speed, F(3,68) = 2.30, p = 0.0849 (Fig. 5B). As shown Fig. 5C, in the acquisition phase of the reference memory task, two-way ANOVA on path length traveled to reach the hidden platform showed a significant main effect for day, F(3,204) = 31.88, p < 0.0001, and a significant main effect for genotype, F(3,68) = 6.34, p < 0.001, but no significant day × genotype interaction, F(3,204) = 0.69, p = 0.7183. Tukey’s multiple comparison test revealed a significant difference between ApoE3 and FDDKI/ApoE4 mice on the fourth day (p < 0.01). Fig. 5D–G shows the results of the first probe trial conducted 48 h after the last acquisition session. The analysis of the percentage of path length traveled in the four quadrants found a significant main effect for quadrant, F(3,204) = 45.72, p < 0.0001, but no significant main effect for genotype, F(3,68) = 1.29, p = 0.2842, or significant quadrant × genotype interaction, F(9,204) = 0.51, p = 0.8651 (Fig. 5D). Similarly, the analysis of the percentage of time spent in the quadrants showed a significant main effect for quadrant, F(3,204) = 31.74, p < 0.0001, but no significant main effect for genotype, F(3,68) = 2.16, p = 0.1011, or significant quadrant × genotype interaction, F(9,204) = 1.20, p = 0.2964 (Fig. 5E). However, as can be seen in Fig. 5F, there was a clear trend in the number of counter crossings in the target quadrant (Quadrant 1), in which ApoE3 mice crossed the target counter more than did mice of the other genotypes. One-way ANOVA found a genotype effect that was almost significant, F(3,68) = 2.63, p = 0.0571. As shown in Fig. 5G, the analysis of the average proximity to the former platform location also showed a genotype effect that approached significance, F(3,68) = 2.46, p = 0.0699. Fig. 5H–K shows the results of the second probe trial given five days after the last acquisition. As shown in Fig. 5H, ApoE3 mice swam a longer distance in the target quadrant than in the other quadrants, while mice of the other genotypes did not. However, ANOVA found a significant main effect for quadrant, F(3,204) = 49.82, p < 0.0001, but no significant main effect for genotype, F(3,68) = 1.12, p = 0.3479, or significant quadrant × genotype interaction, F(9,204) = 1.67, p = 0.0971. As shown in Fig. 5I, the analysis of the percentage of time spent in the quadrants showed a significant main effect for day, F(3,204) = 36.00, p < 0.0001, and a significant quadrant × genotype interaction, F(9,204) = 2.47, p < 0.05, but no significant main effect for genotype, F(3,68) = 1.07, p = 0.3694. Tukey’s multiple comparison test revealed that ApoE3 mice spent a significantly larger proportion of time in the target quadrant than did FDDKI/ApoE4 mice (p < 0.05), and that ApoE3 mice also spent a significantly smaller proportion of time in the opposite quadrant (Quadrant 3) than did FDDKI/ApoE4 mice (p < 0.01). As shown in Fig. 5J, while ApoE3 mice crossed the counter in the target quadrant more than did mice of the other genotypes, ANOVA did not reveal any significant effect of genotype, F(3,68) = 1.65, p = 0.1864. The analysis of the proximity to the former platform location found a near significant genotype effect, F(3,68) = 2.700, p = 0.0525 (Fig. 5K). Thus, the results of the reference memory task at 12 months indicated that FDDKI/ApoE4 mice were impaired in both the acquisition and retention of spatial reference memory relative to ApoE3 mice at this age.
Fig. 5.

Performance in the Morris water maze at 12 months of age. Data are expressed as means ± S.E.M. (A and B) Performance on the visible platform task. There were no significant differences among the genotypes in path length traveled (A) or swim speed (B). (C) Acquisition of spatial reference memory in the hidden platform task. Mean path lengths across 3 daily trials are shown. ApoE3 mice traveled a significantly shorter distance to the hidden platform than did FDDKI/ApoE4 mice on the fourth day. **p < 0.01, ApoE3 vs. FDDKI/ApoE4. (D–G) Performance on the first 60-s probe trial given 2 days after acquisition. No significant differences were found among the genotypes in (D) the percentage of path length traveled in the four quadrants or (E) the percentage of time spent in the four quadrants. (F) Number of counter crossings in the target quadrant (Quadrant 1). ApoE3 mice crossed the target counter more than did FDDKI/ApoE4 mice (p < 0.05, see text). (G) Average proximity to the former platform location. ApoE3 mice swam closer to the former platform location than did FDDKI/ApoE4 mice (p < 0.01, see text). (H–K) Performance on the second 60-s probe trial given 5 days after acquisition. (H) Percentage of path length traveled in the four quadrants. No significant differences were found among the genotypes. (I) Percentage of time spent in the four quadrants. ApoE3 mice spent a significantly larger proportion of time in the target quadrant, as well as a significantly smaller proportion of time in the opposite quadrant, than did FDDKI/ ApoE4 mice. *p < 0.05, **p < 0.01, ApoE3 vs. FDDKI/ApoE4. (J) Number of counter crossings in the target quadrant (Quadrant 1). No significant differences were found among the genotypes. (K) Average proximity to the former platform location. ApoE3 mice swam closer to the former platform location than did FDDKI/ApoE4 mice (p < 0.05, see text). Statistical analysis was performed by Two-way RM ANOVA followed by Tukey’s multiple comparisons test and Ordinary one-way Anova followed by Tukey’s multiple comparisons test (in F) (*p < 0.05, **p < 0.01, ***p < 0.001, ****p < 0.0001).
3.3.2. Morris water maze working memory task
Following the second probe trial at 12 months, mice were subjected to a working memory task in the Morris water maze, in which the location of the hidden platform was varied daily. One FDDKI/ApoE3 mouse died prior to the start of this experiment. Fig. 6 illustrates animals’ performance, as measured by the path lengths traveled on the three trials averaged across the last three days of testing. As can be seen in the figure, ApoE3 mice had shorter mean path lengths on Trials 2 and 3 than did mice of the other genotypes. However, two-way ANOVA found a significant main effect for trial, F(2,134) = 4.55, p < 0.05, but no significant main effect for genotype, F(3,67) = 2.24, p = 0.0918, or significant trial × genotype interaction, F(6,134) = 0.32, p = 0.9248. Yet, post hoc comparisons (Dunnett’s) across trials revealed that the mean distance traveled by ApoE3 mice on Trial 3 was significantly smaller than that on Trial 1 (p < 0.05) and Trial 2 (p < 0.05). By contrast, the path lengths traveled on Trial 2 or Trial 3 by mice of the other three genotypes did not differ significantly from the path length on Trial 1, indicating that the significant main effect for trial was primarily due to the improvement in performance by ApoE3 mice. Thus, at 12 months of age, ApoE3 mice exhibited superior performance on the working memory task in the Morris water maze compared to mice of the other three genotypes.
Fig. 6.
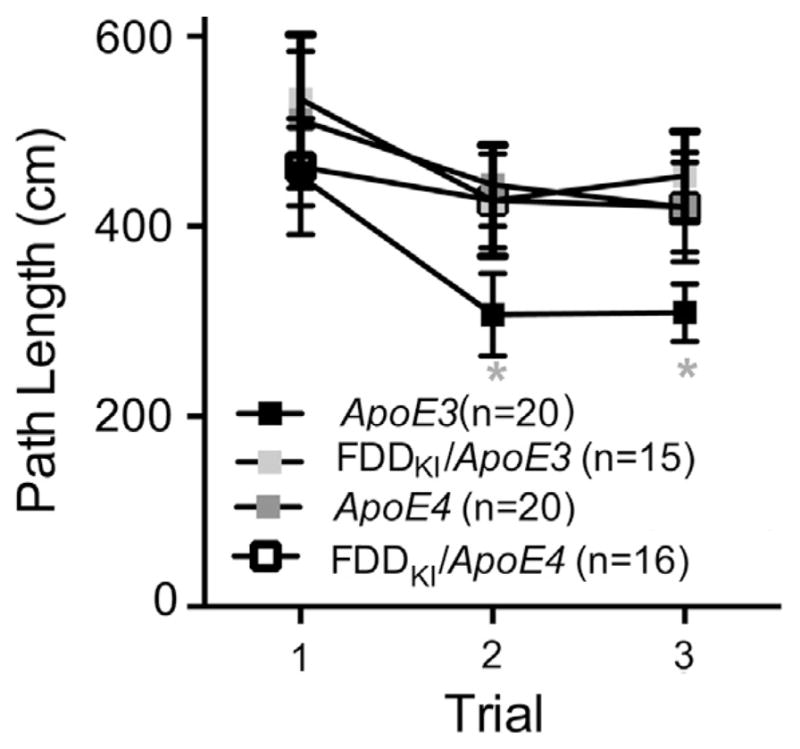
Performance on the working memory task in the Morris water maze. Data are expressed as means ± S.E.M. Path lengths traveled on the 3 daily trials averaged across the last 3 test days are shown. Only ApoE3 mice significantly improved performance across trials. *p < 0.05, vs. Trial 1, ApoE3.
3.4. Sixteen–seventeen months
3.4.1. Morris water maze reference memory task
At 16–17 months of age, mice were tested again for spatial reference memory in the Morris water maze and given three trials a day. Five mice (1 ApoE3, 3 ApoE4, and 1 FDDKI/ApoE4) were dropped from the study prior to the start of testing at this age. Fig. 7A and B shows the results of the visible platform task conducted prior to the reference memory task. Two mice (1 ApoE4 and 1 FDDKI/ApoE4) that exhibited floating behavior during the task were excluded from the analysis of swim speed. ANOVA revealed no significant differences among the four genotype groups in path length traveled, F(3,62) = 0.40, p = 0.7523 (Fig. 7A), or swim speed, F(3,60) = 0.67, p = 0.5748 (Fig. 7B). In the hidden platform task at this age, no significant differences in performance among the genotypes were found during acquisition (Fig. 7C), with two-way ANOVA showing a significant main effect for day, F(6,372) = 8.10, p < 0.0001, but no significant main effect for genotype, F(3,62) = 0.58, p = 0.6274, or day × genotype interaction, F(18,372) = 0.66, p = 0.8483. Fig. 7D–G shows the results of the first probe trial conducted 48 h after the last acquisition session. One ApoE4 mouse was dropped from the study prior to the start of this probe trial. The analysis of the percentage of path length traveled in the four quadrants (Fig. 7D) found a significant quadrant main effect, F(3,183) = 60.93, p < 0.0001, as well as a significant quadrant × genotype interaction, F(9,183) = 2.89, p < 0.01, but no significant main effect for genotype, F(3,61) = 0.60, p = 0.6186. Post hoc comparisons (Tukey’s) revealed that ApoE4 mice traveled significantly larger proportion of distance in the target quadrant (Quadrant 2) than ApoE3 (p < 0.001), FDDKI/ApoE3 (p < 0.05), or FDDKI/ ApoE4 (p < 0.01) mice. Similarly, the analysis of the percentage of time spent in the four quadrants (Fig. 7E), from which two mice (1 ApoE4 and 1 FDDKI/ApoE4) that floated during the trial were excluded, showed a significant quadrant main effect, F(3,177) = 43.73, p < 0.0001, and a significant quadrant × genotype interaction, F(9,177) = 2.38, p < 0.05, but no significant main effect for genotype, F(3,59) = 1.28, p = 0.2912. Tukey’s multiple comparison test further demonstrated that ApoE4 mice spent a significantly larger proportion of time in the target quadrant (Quadrant 2), compared to ApoE3 (p < 0.001), FDDKI/ApoE3 (p < 0.05), or FDDKI/ApoE4 (p < 0.01) mice. As shown in Fig. 7F, while ApoE4 mice had a larger number of counter crossings in the target quadrant on average than mice of the other genotypes, ANOVA found no significant effect of genotype, F(3,61) = 0.69, p = 0.5624. There was also no significant effect of genotype on the proximity to the former platform position, F(3,61) = 1.76, p = 0.1637 (Fig. 7G). Fig. 7H–K shows the results of the second probe trial conducted five days after acquisition. One FDDKI/ApoE3 mouse whose video track was briefly jumped during testing was excluded from analyses involving distance (i.e., the percentage of path length and the proximity), but it was included in the analyses of the other measures (i.e., the percentage of time and the number of counter crossings) since it was determined that these measurements were not affected by the tracking error. As can be seen in Fig. 7H, the analysis of the percentage of path length traveled in the four quadrants found a significant main effect for quadrant, F(3,180) = 83.63, p < 0.0001, as well as a significant quadrant × genotype interaction, F(9,180) = 2.95, p < 0.01, but no significant main effect for genotype, F(3,60) = 1.38, p = 0.2576. Post hoc comparisons (Tukey’s) indicated that ApoE4 mice traveled a significantly larger proportion of distance in the target quadrant than FDDKI/ApoE3 (p < 0.05) or FDDKI/ ApoE4 (p < 0.01) mice. Similarly, the analysis of the percentage of time spent in the quadrants (Fig. 7I) found a significant main effect for quadrant, F(3,183) = 76.27, p < 0.0001, and a significant quadrant × genotype interaction, F(9,183) = 2.45, p < 0.05, but no significant genotype main effect, F(3,61) = 0.56, p = 0.6432. Tukey’s comparisons revealed that ApoE4 mice spent a significantly larger proportion of time in the target quadrant than FDDKI/ApoE4 mice (p < 0.01), and that ApoE4 mice also spent a significantly smaller proportion of time in the opposite quadrant (Quadrant 4) than FDDKI/ApoE4 mice (p < 0.05). No significant effect of genotype was found on the number of counter crossings in the target quadrant, F(3,61) = 0.62, p = 0.6047, although, again, the mean was the highest for ApoE4 mice (Fig. 7J). No significant effect of genotype was found on the average proximity to the former platform location, F(3,60) = 1.37, p = 0.2621 (Fig. 7K). In sum, while no differences among the genotypes were found during acquisition, ApoE4 mice exhibited better retention of spatial reference memory than did mice of the other genotypes at 16–17 months of age.
Fig. 7.

Performance in the Morris water maze at 16–17 months of age. Data are expressed as means ± S.E.M. (A and B) Performance on the visible platform task. There were no significant differences among the genotypes in path length traveled (A) or swim speed (B). Two mice (1 ApoE4 and 1 FDDKI/ApoE4) that floated were excluded from the swim speed analysis. (C) Acquisition of spatial reference memory in the hidden platform task. Mean path lengths across 3 daily trials are shown. There were no differences among the genotypes in performance during acquisition. (D–G) Performance on the first 60-s probe trial given 2 days after the last acquisition session. (D) Percentage of path length traveled in the four quadrants. (E) Percentage of time spent in the four quadrants. Two mice (1 ApoE4 and 1 FDDKI/ApoE4) that floated were excluded from the analysis. ApoE4 mice swam longer distance and spent more time in the target quadrant (Quadrant 2) than did mice of the other genotypes, indicating superior retention of memory of the former platform location. *p < 0.05, **p < 0.01, ***p < 0.001, vs. ApoE4, Quadrant 2. No significant differences were found among the genotypes in (F) the number of counter crossings in the target quadrant or (G) the average proximity to the former platform location. (H–K) Performance on the second 60-s probe trial given 5 days after the last acquisition session. (H) Percentage of path length traveled in the four quadrants. One FDDKI/ApoE3 mouse was excluded from this analysis due to a video tracking error. ApoE4 mice swam a larger proportion of distance in the target quadrant (Quadrant 2) than did FDDKI/ApoE3 and FDDKI/ApoE4 mice. *p < 0.05, **p < 0.01, vs. ApoE4, Quadrant 2. #p < 0.05, ApoE3 vs. ApoE4, Quadrant 3. (I) Percentage of time spent in the four quadrants. ApoE4 mice spent a larger proportion of time in the target quadrant (Quadrant 2) than did FDDKI/ApoE4 mice. *p < 0.05, vs. ApoE4, Quadrant 2. #p < 0.05, ApoE4 vs. FDDKI/ApoE4, Quadrant 4. No significant differences were found among the genotypes in (J) the number of counter crossings in the target quadrant, or (K) the average proximity to the former platform location. One FDDKI/ApoE3 mouse was excluded from the proximity analysis due to a video tracking error.
3.4.2. Y-maze two-trial task
Following the last probe trial, the two-trial Y-maze task was conducted to evaluate mice for short-term spatial recognition memory. One FDDKI/ApoE4 mouse was dropped from the study prior to the start of this experiment. Fig. 8A shows the mean number of total arm entries during the 5-min test trial, which is an index for animals’ total activity levels. There was a significant effect of genotype, F(3,59) = 3.26, p < 0.05, and post hoc comparison test (Tukey’s) indicated that FDDKI/ApoE4 mice were more active than FDDKI/ApoE3 mice (p < 0.05). Given the significant genotype effect on the number of total arm entries, the percentage of entries into each arm, instead of raw numbers of arm entries, was used to analyze animals’ preference for the novel arm vs. the known arm. As depicted in Fig. 8B, the analysis of the percentage of entries into the three arms found a significant main effect for arm, F(2,118) = 25.85, p < 0.0001, but no significant genotype main effect, F(3,59) = 1.50, p = 0.2243, or arm × genotype interaction, F(6,118) = 2.15, p = 0.0528. Tukey’s multiple comparisons between the arms revealed that the novel arm was entered significantly more proportion-wise than the known arm by ApoE3 (p < 0.0001) and FDDKI/ApoE3 (p < 0.01) mice, but not by ApoE4 or FDDKI/ApoE4 mice. Also, the percentage of the number of entries into the novel arm was significantly larger compared to the start arm for ApoE3 (p < 0.0001), FDDKI/ApoE3 (p < 0.0001), and FDDKI/ApoE4 mice (p < 0.05), but not for ApoE4 mice. Fig. 8C compares the percentage of time spent in the novel arm only. One-way ANOVA revealed a small but significant effect of genotype, F(3,59) = 2.78, p = 0.0490. Post hoc comparisons (uncorrected Fisher’s LSD) showed that ApoE3 mice entered the novel arm significantly more proportion-wise than ApoE4 (p < 0.05) or FDDKI/ApoE4 mice (p < 0.05). Fisher’s LSD test was used here because, despite the significant overall effect of genotype, uncorrected comparison tests did not reveal any significant differences among the genotypes. As indicated in Fig. 8D, the analysis of the time spent in the three arms found a significant main effect for arm, F(2,118) = 5.41, p < 0.01, but no significant interaction between arm and genotype, F(6,118) = 0.88, p = 0.5108, or significant main effect for genotype, F(3,59) = 2.52, p = 0.0665. Tukey’s comparisons between the arms showed that ApoE3 mice spent significantly more time in the novel arm than in the known arm (p < 0.01), while mice of the other three genotypes did not. Fig. 8E depicts the mean time spent in the novel arm alone. As can be seen, ApoE3 mice spent the largest amount of time, followed by FDDKI/ApoE3 mice, and then by ApoE4 and FDDKI/ApoE4 mice. ANOVA found a genotype effect that was almost significant, F(3,59) = 2.73, p = 0.0518. Independent t-tests conducted separately showed that ApoE3 mice spent significantly more time in the novel arm than ApoE4 mice, t(33) = 2.19, p < 0.05, and FDDKI/ApoE4 mice, t(31) = 2.19, p < 0.05. Finally, we examined how many mice in each genotype group chose the novel arm as the first entry. As indicated in Fig. 8F, the percentage of mice that entered the novel arm first was the highest for ApoE3 mice (84%), compared to FDDKI/ApoE3 (64%), ApoE4 (56%), or FDDKI/ ApoE3 (64%) mice, although a chi-square analysis did not show significance, χ2(3,N = 63) = 3.50, p = 0.3207. In sum, the results of the two-trial Y-maze task demonstrated that, at 16–17 months of age, ApoE3 mice, and, to a lesser extent, FDDKI/ApoE3 mice distinguished between the novel and familiar arms better than ApoE4 or FDDKI/ ApoE4 mice after a 1-h retention interval.
Fig. 8.

Performance on the 5-min test trial of the two-trial task in Y-maze at 16–17 months of age. Data are expressed as means ± S.E.M. (A) Total number of arm entries. FDDKI/ApoE4 mice made significantly more arm entries than did FDDKI/ApoE3 mice. *p < 0.05. (B) Percentage of arm entries. ApoE3 and, to a smaller degree, FDDKI/ApoE3 mice entered the novel arm significantly more than the known arm, while ApoE4 and FDDKI/ApoE4 mice did not. Also, ApoE3, FDDKI/ApoE3, and, to a smaller degree, FDDKI/ApoE4 mice entered the novel arm significantly more than the start arm, while ApoE4 mice did not. *p < 0.05, **p < 0.01, ****p < 0.0001, vs. novel. (C) Percentage of entries into the novel arm. ApoE3 mice entered the novel arm significantly more than did ApoE4 and FDDKI/ApoE4 mice. (D) Time spent in the arms. Only ApoE3 mice spent significantly more time in the novel arm than in the known arm. **p < 0.01, vs. novel. (E) Time spent in the novel arm. No significant differences were found among the genotypes. (F) Number of animals that chose the novel arm as the first entry. ApoE3 mice had the highest percentage of animals that entered the novel arm first.
4. Discussion
In the present study, the same cohort of male ApoE3, FDDKI/ ApoE3, ApoE4, and FDDKI/ApoE4 mice was assessed longitudinally for cognitive behavioral changes. The results indicated that mice carrying the ApoE4 allele displayed working/short-term spatial memory impairment relative to mice carrying the ApoE3 allele starting in middle age, while long-term spatial memory of ApoE4 mice was not adversely affected even at 16–17 months. In addition, the FDD mutation impaired working/short-term spatial memory in mice carrying the ApoE3 allele and produced impaired retention of long-term spatial memory in mice carrying the ApoE4 allele in middle age. Finally, we noticed a long-term retention memory decline of ApoE3 and FDDKI/ApoE3 mice compared to ApoE4 mice at 16–17 months.
The results, which are summarized in Table 4, show that spatial memory deficits first appear at 12 months of age. FDDKI/ApoE4 mice were impaired in both the acquisition and retention of spatial reference memory compared to ApoE3 mice, while neither FDDKI/ ApoE3 nor ApoE4 mice were significantly impaired in either acquisition or retention relative to ApoE3 mice (Fig. 5C–K). In the MWM working memory task (Working MWM), in which the location of the hidden platform was varied daily, ApoE3 mice showed a significant gain in performance over the three trials, while mice of the other genotypes did not (Fig. 6), indicating that mice with the ApoE4 allele had compromised working memory function compared to mice with ApoE3 allele at this age. The present results also suggest that the FDD mutation induced working memory impairment in mice with the ApoE3 allele.
Table 4.
Summary of the analysis and the phenotypes of the mice of the different genotypes. ApoE3 (E3), FDDKI/ApoE3 (F/E3), ApoE4 (E4), FDDKI/Apo4 (F/E4). The tests showing statistically significant differences are in bold.
| EZM | OF | NOR | |
|---|---|---|---|
| 4 Months of age | |||
| E3 | No anxiety deficit | No general locomotor activity levels and anxiety-like deficits | No visual recognition memory deficit |
| F/E3 | No anxiety deficit | No general locomotor activity levels and anxiety-like deficits | No visual recognition memory deficit |
| E4 | No anxiety deficit | No general locomotor activity levels and anxiety-like deficits | No visual recognition memory deficit |
| F/E4 | No anxiety deficit | No general locomotor activity levels and anxiety-like deficits | No visual recognition memory deficit |
| MWM | |||
|
| |||
| 6 Months of age | |||
| E3 | No long term spatial memory deficit | ||
| F/E3 | No long term spatial memory deficit | ||
| E4 | No long term spatial memory deficit | ||
| F/E4 | No long term spatial memory deficit | ||
| MWM | Working MWM | ||
|
| |||
| 12 Months of age | |||
| E3 | No long term spatial memory deficit | No spatial working memory deficit | |
| F/E3 | No long term spatial memory deficit | *Spatial working memory deficit | |
| E4 | No long term spatial memory deficit | *Spatial working memory deficit | |
| F/E4 | *Long term spatial memory deficit | *Spatial working memory deficit | |
| MWM | Y Maze | ||
|
| |||
| 17 Months of age | |||
| E3 | *Long term spatial memory deficit | No short-term spatial recognition memory deficit | |
| F/E3 | *Long term spatial memory deficit | *Mild short-term spatial recognition memory deficit | |
| E4 | No long term spatial memory deficit | *Short-term spatial recognition memory deficit | |
| F/E4 | *Long term spatial memory deficit | *Short-term spatial recognition memory deficit | |
At 16–17 months, ApoE4 mice displayed superior retention of spatial reference memory relative to mice of the other three genotypes, as indicated by their significantly larger proportions of both path length traveled and time spent in the target quadrant (Fig. 7D, E, H and I). However, our ApoE3 and ApoE4 mice did not differ in performance on the second probe trial given 5 d after acquisition. Our results also indicated that, while FDDKI/ApoE4 mice showed impaired retention of reference memory relative to ApoE4 mice on both probe trials, FDDKI/ApoE3 mice showed equivalent levels of performance on the probe trials to ApoE3 mice, which suggests that the FDD mutation may preferentially affect mice carrying the ApoE4 allele in spatial reference memory retention.
The Y-maze two-trial test conducted at the same age revealed impairment of short-term spatial recognition memory in mice carrying ApoE4 in comparison to mice carrying ApoE3. Specifically, after a 1-h retention interval, ApoE3 mice, and, to a smaller degree, FDDKI/ApoE3 mice distinguished between the novel and familiar arms better than did ApoE4 or FDDKI/ApoE4 mice, as indicated by the percentage of arm entries (Fig. 8B and C) as well as the time spent in the arms (Fig. 8D). These findings suggest that the ApoE4 allele induces short-term spatial recognition memory deficits at this age. Previously, deficits in short-term (5 m) spatial recognition memory in female, but not male, ApoE4 mice on a C57BL/6J background relative to sex-matched ApoE3 mice have been reported in young age (4–5 months) by a study that used a spatial object recognition task (Grootendorst et al., 2005), although the same group showed, using the same procedure, that, in late middle age (15–18 months), female ApoE4 mice performed better than ApoE3 mice, while finding no difference between male ApoE3 and ApoE4 mice (Bour et al., 2008). The present results also showed that, while FDDKI/ApoE3 mice performed better than ApoE4 and FDDKI/ ApoE4 mice on this task, they did not achieve the same level of performance as ApoE3 mice in either measure, suggesting that the FDD mutation produced mild interference with short/term spatial recognition memory in mice carrying the ApoE3 allele at this age.
Altogether, our data depict roles for Bri2 and ApoE4 proteins in a long-term memory regulation pathway. A single mutation in one Itm2b/Bri2 allele can affect both long-term and working memory, while ApoE4 seems to regulate short-term/working memory. The presence of FDD mutation and ApoE4 leads to an exacerbation of long-term memory retention, further suggesting that these two actors play a role, likely in the hippocampus.
Table 2.
12-mo; platform 1.
| Day | Trial 1 | Trial 2 | Trial 3 |
|---|---|---|---|
| 1 | S | NW | SW |
| 2 | W | SE | SW |
| 3 | NS | N | W |
| 4 | E | NW | SW |
| 6 (probe 2d) | SW | ||
| 9 (probe 5d) | SW |
Acknowledgments
Funding
This work was supported by grants from the Alzheimer’s Association (ZEN-11-201425 to L.D.), the Edward N. & Della L. Thome Memorial Foundation grant (to L.D.), the National Institutes of Health (NIH; R01AG033007 to L.D.; NIH;1R21AG048971-01A1 to L.D; NIH; 5R01AG041531-04 to L.D), K.I. was supported by the Neuropathology Training Program T32 NS007098, the Bright Focus Foundation to D.D.P. The funders had no role in study design, data collection and analysis, decision to publish, or preparation of the manuscript.
Acknowledgement is made to the donors of [Alzheimer’s Disease Research, Macular Degeneration Research, or National Glaucoma Research], a program of Bright Focus Foundation, for support of this research.
References
- Bachmeier C, Shackleton B, Ojo J, Paris D, Mullan M, Crawford F. Apolipoprotein E isoform-specific effects on lipoprotein receptor processing. NeuroMolecular Medicine. 2014;16:686–696. doi: 10.1007/s12017-014-8318-6. [DOI] [PMC free article] [PubMed] [Google Scholar]
- Bales KR, Liu F, Wu S, Lin S, Koger D, DeLong C, Paul SM. Human APOE isoform-dependent effects on brain beta-amyloid levels in PDAPP transgenic mice. The Journal of Neuroscience: The Official Journal of the Society for Neuroscience. 2009;29:6771–6779. doi: 10.1523/JNEUROSCI.0887-09.2009. [DOI] [PMC free article] [PubMed] [Google Scholar]
- Baxter LC, Caselli RJ, Johnson SC, Reiman E, Osborne D. Apolipoprotein E epsilon 4 affects new learning in cognitively normal individuals at risk for Alzheimer’s disease. Neurobiology of Aging. 2003;24:947–952. doi: 10.1016/s0197-4580(03)00006-x. [DOI] [PubMed] [Google Scholar]
- Beffert U, Danik M, Krzywkowski P, Ramassamy C, Berrada F, Poirier J. The neurobiology of apolipoproteins and their receptors in the CNS and Alzheimer’s disease. Brain Research Brain Research Reviews. 1998;27:119–142. doi: 10.1016/s0165-0173(98)00008-3. [DOI] [PubMed] [Google Scholar]
- Bell RD, Sagare AP, Friedman AE, Bedi GS, Holtzman DM, Deane R, Zlokovic BV. Transport pathways for clearance of human Alzheimer’s amyloid beta-peptide and apolipoproteins E and J in the mouse central nervous system. Journal of Cerebral Blood Flow and Metabolism. 2007;27:909–918. doi: 10.1038/sj.jcbfm.9600419. [DOI] [PMC free article] [PubMed] [Google Scholar]
- Bondi MW, Salmon DP, Monsch AU, Galasko D, Butters N, Klauber MR, Saitoh T. Episodic memory changes are associated with the APOEepsilon 4 allele in nondemented older adults. Neurology. 1995;45:2203–2206. doi: 10.1212/wnl.45.12.2203. [DOI] [PubMed] [Google Scholar]
- Bosco P, Gueant-Rodriguez RM, Anello G, Spada RS, Romano A, Caraci F, Gueant JL. Allele epsilon 4 of APOE is a stronger predictor of Alzheimer risk in Sicily than in continental South Italy. Neuroscience Letters. 2005;388:168–172. doi: 10.1016/j.neulet.2005.06.056. [DOI] [PubMed] [Google Scholar]
- Bour A, Grootendorst J, Vogel E, Kelche C, Dodart JC, Bales K, Mathis C. Middle-aged human apoE4 targeted-replacement mice show retention deficits on a wide range of spatial memory tasks. Behavioural Brain Research. 2008;193:174–182. doi: 10.1016/j.bbr.2008.05.008. [DOI] [PubMed] [Google Scholar]
- Boyles JK, Pitas RE, Wilson E, Mahley RW, Taylor JM. Apolipoprotein E associated with astrocytic glia of the central nervous system and with nonmyelinating glia of the peripheral nervous system. The Journal of Clinical Investigation. 1985;76:1501–1513. doi: 10.1172/JCI112130. [DOI] [PMC free article] [PubMed] [Google Scholar]
- Castellano JM, Kim J, Stewart FR, Jiang H, DeMattos RB, Patterson BW, Holtzman DM. Human apoE isoforms differentially regulate brain amyloid-beta peptide clearance. Science Translational Medicine. 2011;3:89ra57. doi: 10.1126/scitranslmed.3002156. [DOI] [PMC free article] [PubMed] [Google Scholar]
- Corder EH, Saunders AM, Risch NJ, Strittmatter WJ, Schmechel DE, Gaskell PC, Jr, Pericak-Vance MA. Protective effect of apolipoprotein E type 2 allele for late onset Alzheimer disease. Nature Genetics. 1994;7:180–184. doi: 10.1038/ng0694-180. [DOI] [PubMed] [Google Scholar]
- Corder EH, Saunders AM, Strittmatter WJ, Schmechel DE, Gaskell PC, Small GW, Pericak-Vance MA. Gene dose of apolipoprotein E type 4 allele and the risk of Alzheimer’s disease in late onset families. Science (New York, NY) 1993;261:921–923. doi: 10.1126/science.8346443. [DOI] [PubMed] [Google Scholar]
- Crean S, Ward A, Mercaldi CJ, Collins JM, Cook MN, Baker NL, Arrighi HM. Apolipoprotein E epsilon4 prevalence in Alzheimer’s disease patients varies across global populations: A systematic literature review and metaanalysis. Dementia and Geriatric Cognitive Disorders. 2011;31:20–30. doi: 10.1159/000321984. [DOI] [PubMed] [Google Scholar]
- Flory JD, Manuck SB, Ferrell RE, Ryan CM, Muldoon MF. Memory performance and the apolipoprotein E polymorphism in a community sample of middle-aged adults. American Journal of Medical Genetics. 2000;96:707–711. doi: 10.1002/1096-8628(20001204)96:6<707::aid-ajmg1>3.0.co;2-v. [DOI] [PubMed] [Google Scholar]
- Fotinopoulou A, Tsachaki M, Vlavaki M, Poulopoulos A, Rostagno A, Frangione B, Efthimiopoulos S. BRI2 interacts with amyloid precursor protein (APP) and regulates amyloid beta (Abeta) production. Journal of Biological Chemistry. 2005;280:30768–30772. doi: 10.1074/jbc.C500231200. [DOI] [PubMed] [Google Scholar]
- Frieden C, Garai K. Structural differences between apoE3 and apoE4 may be useful in developing therapeutic agents for Alzheimer’s disease. Proceedings of the National academy of Sciences of the United States of America. 2012;109:8913–8918. doi: 10.1073/pnas.1207022109. [DOI] [PMC free article] [PubMed] [Google Scholar]
- Ghiso J, Rostagno A, Tomidokoro Y, Lashley T, Bojsen-Moller M, Braendgaard H, Frangione B. Genetic alterations of the BRI2 gene: Familial British and Danish dementias. Brain Pathology. 2006;16:71–79. doi: 10.1111/j.1750-3639.2006.tb00563.x. [DOI] [PMC free article] [PubMed] [Google Scholar]
- Giliberto L, Matsuda S, Vidal R, D’Adamio L. Generation and initial characterization of FDD knock in mice. PLoS One. 2009;4:e7900. doi: 10.1371/journal.pone.0007900. [DOI] [PMC free article] [PubMed] [Google Scholar]
- Grootendorst J, Bour A, Vogel E, Kelche C, Sullivan PM, Dodart JC, Mathis C. Human apoE targeted replacement mouse lines: h-apoE4 and h-apoE3 mice differ on spatial memory performance and avoidance behavior. Behavioural Brain Research. 2005;159:1–14. doi: 10.1016/j.bbr.2004.09.019. [DOI] [PubMed] [Google Scholar]
- Hardy J. Amyloid, the presenilins and Alzheimer’s disease. Trends in Neurosciences. 1997;20:154–159. doi: 10.1016/s0166-2236(96)01030-2. [DOI] [PubMed] [Google Scholar]
- Hauser PS, Narayanaswami V, Ryan RO. Apolipoprotein E: From lipid transport to neurobiology. Progress in Lipid Research. 2011;50:62–74. doi: 10.1016/j.plipres.2010.09.001. [DOI] [PMC free article] [PubMed] [Google Scholar]
- Holton JL, Lashley T, Ghiso J, Braendgaard H, Vidal R, Guerin CJ, Revesz T. Familial Danish dementia: A novel form of cerebral amyloidosis associated with deposition of both amyloid-Dan and amyloid-beta. Journal of Neuropathology and Experimental Neurology. 2002;61:254–267. doi: 10.1093/jnen/61.3.254. [DOI] [PubMed] [Google Scholar]
- Huang Y. Roles of apolipoprotein E4 (ApoE4) in the pathogenesis of Alzheimer’s disease: Lessons from ApoE mouse models. Biochemical Society Transactions. 2011;39:924–932. doi: 10.1042/BST0390924. [DOI] [PubMed] [Google Scholar]
- Kim J, Basak JM, Holtzman DM. The role of apolipoprotein E in Alzheimer’s disease. Neuron. 2009;63:287–303. doi: 10.1016/j.neuron.2009.06.026. [DOI] [PMC free article] [PubMed] [Google Scholar]
- Kim J, Yoon H, Basak J, Kim J. Apolipoprotein E in synaptic plasticity and Alzheimer’s disease: Potential cellular and molecular mechanisms. Molecules and Cells. 2014;37:767–776. doi: 10.14348/molcells.2014.0248. [DOI] [PMC free article] [PubMed] [Google Scholar]
- Knouff C, Hinsdale ME, Mezdour H, Altenburg MK, Watanabe M, Quarfordt SH, Maeda N. Apo E structure determines VLDL clearance and atherosclerosis risk in mice. The Journal of Clinical Investigation. 1999;103:1579–1586. doi: 10.1172/JCI6172. [DOI] [PMC free article] [PubMed] [Google Scholar]
- Mahley RW. Apolipoprotein E: Cholesterol transport protein with expanding role in cell biology. Science (New York, NY) 1988;240:622–630. doi: 10.1126/science.3283935. [DOI] [PubMed] [Google Scholar]
- Matsuda S, Giliberto L, Matsuda Y, Davies P, McGowan E, Pickford F, D’Adamio L. The familial dementia BRI2 gene binds the Alzheimer gene amyloid-beta precursor protein and inhibits amyloid-beta production. The Journal of Biological Chemistry. 2005;280:28912–28916. doi: 10.1074/jbc.C500217200. [DOI] [PubMed] [Google Scholar]
- Matsuda S, Giliberto L, Matsuda Y, McGowan EM, D’Adamio L. BRI2 inhibits amyloid beta-peptide precursor protein processing by interfering with the docking of secretases to the substrate. The Journal of Neuroscience: The Official Journal of the Society for Neuroscience. 2008;28:8668–8676. doi: 10.1523/JNEUROSCI.2094-08.2008. [DOI] [PMC free article] [PubMed] [Google Scholar]
- Matsuda S, Matsuda Y, Snapp EL, D’Adamio L. Maturation of BRI2 generates a specific inhibitor that reduces APP processing at the plasma membrane and in endocytic vesicles. Neurobiology of Aging. 2011;32:1400–1408. doi: 10.1016/j.neurobiolaging.2009.08.005. [DOI] [PMC free article] [PubMed] [Google Scholar]
- Matsuda S, Tamayev R, D’Adamio L. Increased AbetaPP processing in familial Danish dementia patients. Journal of Alzheimer’s Disease: JAD. 2011;27:385–391. doi: 10.3233/JAD-2011-110785. [DOI] [PMC free article] [PubMed] [Google Scholar]
- Nalbantoglu J, Tirado-Santiago G, Lahsaini A, Poirier J, Goncalves O, Verge G, Shapiro ML. Impaired learning and LTP in mice expressing the carboxy terminus of the Alzheimer amyloid precursor protein. Nature. 1997;387:500–505. doi: 10.1038/387500a0. [DOI] [PubMed] [Google Scholar]
- Oster-Granite ML, McPhie DL, Greenan J, Neve RL. Age-dependent neuronal and synaptic degeneration in mice transgenic for the C terminus of the amyloid precursor protein. Journal of Neuroscience. 1996;16:6732–6741. doi: 10.1523/JNEUROSCI.16-21-06732.1996. [DOI] [PMC free article] [PubMed] [Google Scholar]
- Panza F, Solfrizzi V, Torres F, Mastroianni F, Colacicco AM, Basile AM, Capurso A. Apolipoprotein E in Southern Italy: Protective effect of epsilon 2 allele in early- and late-onset sporadic Alzheimer’s disease. Neuroscience Letters. 2000;292:79–82. doi: 10.1016/s0304-3940(00)01447-6. [DOI] [PubMed] [Google Scholar]
- Panza F, Solfrizzi V, Torres F, Mastroianni F, Del Parigi A, Colacicco AM, Capurso A. Decreased frequency of apolipoprotein E epsilon4 allele from Northern to Southern Europe in Alzheimer’s disease patients and centenarians. Neuroscience Letters. 1999;277:53–56. doi: 10.1016/s0304-3940(99)00860-5. [DOI] [PubMed] [Google Scholar]
- Pfrieger FW. Cholesterol homeostasis and function in neurons of the central nervous system. Cellular and Molecular Life Sciences. 2003;60:1158–1171. doi: 10.1007/s00018-003-3018-7. [DOI] [PMC free article] [PubMed] [Google Scholar]
- Pitas RE, Boyles JK, Lee SH, Hui D, Weisgraber KH. Lipoproteins and their receptors in the central nervous system. Characterization of the lipoproteins in cerebrospinal fluid and identification of apolipoprotein B, E(LDL) receptors in the brain. The Journal of Biological Chemistry. 1987;262:14352–14360. [PubMed] [Google Scholar]
- Plant GT, Revesz T, Barnard RO, Harding AE, Gautier-Smith PC. Familial cerebral amyloid angiopathy with nonneuritic amyloid plaque formation. Brain. 1990;113(Pt 3):721–747. doi: 10.1093/brain/113.3.721. [DOI] [PubMed] [Google Scholar]
- Revesz T, Holton JL, Doshi B, Anderton BH, Scaravilli F, Plant GT. Cytoskeletal pathology in familial cerebral amyloid angiopathy (British type) with non-neuritic amyloid plaque formation. Acta Neuropathologica. 1999;97:170–176. doi: 10.1007/s004010050970. [DOI] [PubMed] [Google Scholar]
- Rostagno A, Revesz T, Lashley T, Tomidokoro Y, Magnotti L, Braendgaard H, Ghiso J. Complement activation in chromosome 13 dementias. Similarities with Alzheimer’s disease. The Journal of Biological Chemistry. 2002;277:49782–49790. doi: 10.1074/jbc.M206448200. [DOI] [PubMed] [Google Scholar]
- Saunders AM, Strittmatter WJ, Schmechel D, George-Hyslop PH, Pericak-Vance MA, Joo SH, Roses AD. Association of apolipoprotein E allele epsilon 4 with late-onset familial and sporadic Alzheimer’s disease. Neurology. 1993;43:1467–1472. doi: 10.1212/wnl.43.8.1467. [DOI] [PubMed] [Google Scholar]
- Selkoe DJ. The molecular pathology of Alzheimer’s disease. Neuron. 1991;6:487–498. doi: 10.1016/0896-6273(91)90052-2. [DOI] [PubMed] [Google Scholar]
- Selkoe DJ. Deciphering the genesis and fate of amyloid beta-protein yields novel therapies for Alzheimer disease. The Journal of Clinical Investigation. 2002;110:1375–1381. doi: 10.1172/JCI16783. [DOI] [PMC free article] [PubMed] [Google Scholar]
- Selkoe DJ. Alzheimer’s disease. Cold Spring Harbor Perspectives in Biology. 2011;3 doi: 10.1101/cshperspect.a004457. [DOI] [PMC free article] [PubMed] [Google Scholar]
- Sherrington R, Rogaev EI, Liang Y, Rogaeva EA, Levesque G, Ikeda M, St George-Hyslop PH. Cloning of a gene bearing missense mutations in early-onset familial Alzheimer’s disease. Nature. 1995;375:754–760. doi: 10.1038/375754a0. [DOI] [PubMed] [Google Scholar]
- Stromgren E, Dalby A, Dalby MA, Ranheim B. Cataract, deafness, cerebellar ataxia, psychosis and dementia – A new syndrome. Acta Neurologica Scandinavica. 1970;46(Suppl 43):261. doi: 10.1111/j.1600-0404.1970.tb02219.x. [DOI] [PubMed] [Google Scholar]
- Suh YH, Kim HS, Lee JP, Park CH, Jeong SJ, Kim SS, Kim SS. Roles of A beta and carboxyl terminal peptide fragments of amyloid precursor protein in Alzheimer disease. Journal of Neural Transmission. Supplementum. 2000:65–82. doi: 10.1007/978-3-7091-6284-2_6. [DOI] [PubMed] [Google Scholar]
- Sullivan PM, Mace BE, Maeda N, Schmechel DE. Marked regional differences of brain human apolipoprotein E expression in targeted replacement mice. Neuroscience. 2004;124:725–733. doi: 10.1016/j.neuroscience.2003.10.011. [DOI] [PubMed] [Google Scholar]
- Sullivan PM, Mezdour H, Aratani Y, Knouff C, Najib J, Reddick RL, Maeda N. Targeted replacement of the mouse apolipoprotein E gene with the common human APOE3 allele enhances diet-induced hypercholesterolemia and atherosclerosis. The Journal of Biological Chemistry. 1997;272:17972–17980. doi: 10.1074/jbc.272.29.17972. [DOI] [PubMed] [Google Scholar]
- Tamayev R, D’Adamio L. Inhibition of gamma-secretase worsens memory deficits in a genetically congruous mouse model of Danish dementia. Molecular Neurodegeneration. 2012;7:19. doi: 10.1186/1750-1326-7-19. [DOI] [PMC free article] [PubMed] [Google Scholar]
- Tamayev R, Giliberto L, Li W, d’Abramo C, Arancio O, Vidal R, D’Adamio L. Memory deficits due to familial British dementia BRI2 mutation are caused by loss of BRI2 function rather than amyloidosis. The Journal of Neuroscience: The Official Journal of the Society for Neuroscience. 2010;30:14915–14924. doi: 10.1523/JNEUROSCI.3917-10.2010. [DOI] [PMC free article] [PubMed] [Google Scholar]
- Tamayev R, Matsuda S, Arancio O, D’Adamio L. Beta-but not gamma-secretase proteolysis of APP causes synaptic and memory deficits in a mouse model of dementia. EMBO Molecular Medicine. 2012;4:171–179. doi: 10.1002/emmm.201100195. [DOI] [PMC free article] [PubMed] [Google Scholar]
- Tamayev R, Matsuda S, Fa M, Arancio O, D’Adamio L. Danish dementia mice suggest that loss of function and not the amyloid cascade causes synaptic plasticity and memory deficits. Proceedings of the National academy of Sciences of the United States of America. 2010;107:20822–20827. doi: 10.1073/pnas.1011689107. [DOI] [PMC free article] [PubMed] [Google Scholar]
- Tamayev R, Matsuda S, Giliberto L, Arancio O, D’Adamio L. APP heterozygosity averts memory deficit in knockin mice expressing the Danish dementia BRI2 mutant. The EMBO Journal. 2011;30:2501–2509. doi: 10.1038/emboj.2011.161. [DOI] [PMC free article] [PubMed] [Google Scholar]
- Tang MX, Maestre G, Tsai WY, Liu XH, Feng L, Chung WY, Mayeux R. Effect of age, ethnicity, and head injury on the association between APOE genotypes and Alzheimer’s disease. Annals of the New York Academy of Sciences. 1996;802:6–15. doi: 10.1111/j.1749-6632.1996.tb32593.x. [DOI] [PubMed] [Google Scholar]
- Tang MX, Stern Y, Marder K, Bell K, Gurland B, Lantigua R, Mayeux R. The APOE-epsilon4 allele and the risk of Alzheimer disease among African Americans, whites, and Hispanics. JAMA. 1998;279:751–755. doi: 10.1001/jama.279.10.751. [DOI] [PubMed] [Google Scholar]
- Vidal R, Frangione B, Rostagno A, Mead S, Revesz T, Plant G, Ghiso J. A stop-codon mutation in the BRI gene associated with familial British dementia. Nature. 1999;399:776–781. doi: 10.1038/21637. [DOI] [PubMed] [Google Scholar]
- Vidal R, Revesz T, Rostagno A, Kim E, Holton JL, Bek T, Frangione B. A decamer duplication in the 3′ region of the BRI gene originates an amyloid peptide that is associated with dementia in a Danish kindred. Proceedings of the National academy of Sciences of the United States of America. 2000;97:4920–4925. doi: 10.1073/pnas.080076097. [DOI] [PMC free article] [PubMed] [Google Scholar]
- Weisgraber KH, Rall SC, Jr, Mahley RW. Human E apoprotein heterogeneity. Cysteine-arginine interchanges in the amino acid sequence of the apo-E isoforms. The Journal of Biological Chemistry. 1981;256:9077–9083. [PubMed] [Google Scholar]
- West HL, Rebeck GW, Hyman BT. Frequency of the apolipoprotein E epsilon 2 allele is diminished in sporadic Alzheimer disease. Neuroscience Letters. 1994;175:46–48. doi: 10.1016/0304-3940(94)91074-x. [DOI] [PubMed] [Google Scholar]
- Wilson RS, Schneider JA, Barnes LL, Beckett LA, Aggarwal NT, Cochran EJ, Bennett DA. The apolipoprotein E epsilon 4 allele and decline in different cognitive systems during a 6-year period. Archives of Neurology. 2002;59:1154–1160. doi: 10.1001/archneur.59.7.1154. [DOI] [PubMed] [Google Scholar]
- Worster-Drought C, Hill TR, McMenemey WH. Familial presenile dementia with spastic paralysis. Journal of Neurology and Psychopathology. 1933;14:27–34. doi: 10.1136/jnnp.s1-14.53.27. [DOI] [PMC free article] [PubMed] [Google Scholar]
- Youmans KL, Tai LM, Nwabuisi-Heath E, Jungbauer L, Kanekiyo T, Gan M, Ladu MJ. APOE4-specific changes in Abeta accumulation in a new transgenic mouse model of Alzheimer disease. The Journal of Biological Chemistry. 2012;287:41774–41786. doi: 10.1074/jbc.M112.407957. [DOI] [PMC free article] [PubMed] [Google Scholar]
- Yu JT, Tan L, Hardy J. Apolipoprotein E in Alzheimer’s disease: An update. Annual Review of Neuroscience. 2014;37:79–100. doi: 10.1146/annurev-neuro-071013-014300. [DOI] [PubMed] [Google Scholar]
- Zannis VI, Breslow JL. Human very low density lipoprotein apolipoprotein E isoprotein polymorphism is explained by genetic variation and posttranslational modification. Biochemistry. 1981;20:1033–1041. doi: 10.1021/bi00507a059. [DOI] [PubMed] [Google Scholar]