

Abstract
The primary cilium is a specialized organelle that projects from the surface of many cell types. Unlike its motile counterpart it cannot beat but does transduce extracellular stimuli into intracellular signals and acts as a specialized subcellular compartment. The cilium is built and maintained by the transport of proteins and other biomolecules into and out of this compartment. The trafficking machinery for the cilium is referred to as IFT or intraflagellar transport. It was originally identified in the green algae Chlamydomonas and has been discovered throughout the evolutionary tree. The IFT machinery is widely conserved and acts to establish, maintain, and disassemble cilia and flagella. Understanding the role of IFT in cilium signaling and regulation requires a methodology for observing it directly. Here we describe current methods for observing the IFT process in mammalian primary cilia through the generation of fluorescent protein fusions and their expression in ciliated cell lines. The observation protocol uses high-resolution time-lapse microscopy to provide detailed quantitative measurements of IFT particle velocities in wild-type cells or in the context of genetic or other perturbations. Direct observation of IFT trafficking will provide a unique tool to dissect the processes that govern cilium regulation and signaling.
I. Introduction
A. Introduction to the Primary Cilium
Cilia are microtubule-based projections that are present in organisms throughout the evolutionary tree. The motile forms, which in some organisms are referred to as flagella, are found in many single-celled organisms and tissues in metazoans and serve to drive the motion of fluid at the cellular surface. Primary or nonmotile cilia are found in metazoans where they are thought to act as a specialized extracellular signal transduction apparatus and as a privileged subcellular compartment for specific biochemical reactions.
Motile cilia are constructed of nine outer doublet microtubules and one central pair of microtubules (9+2 arrangement). Motile cilia have microtubule motor dynein-mediated interconnections between the outer doublets that promote ATP-dependent sliding, which, in turn, induces a bending motion of the entire structure and their characteristic whip-like motion. Primary cilia, in contrast, do not have the central pair of microtubules (9+0 arrangement) nor do they have the motor-mediated connections between outer doublets. As a result, these cilia are not motile (with the lone exception being the nodal cilia that determine left–right symmetry in the early embryo) and have been thought to be a vestigial feature of the many cell types on which they are found [reviewed in Gerdes et al. (2009)].
B. Intraflagellar Transport—Building and Maintaining Cilia
Cilia are dynamic structures that are assembled and maintained by a specialized, internal transport machinery termed intraflagellar transport (IFT). Originally identified in the green algae Chlamydomonas, components of the IFT machinery have been found to be required for cilia formation in all ciliated organisms (Cole et al., 1998; Kozminski et al., 1993). The dynamicity of the cilium, as observed decades ago in classic deflagellation experiments in Chlamydomonas (Rosenbaum et al., 1969), is due to the continuous bidirectional movement of IFT particles along axonemal microtubules just under the ciliary membrane (Fig. 1) (Kozminski et al., 1993). Anterograde activities deliver IFT particles to the tip of cilium and retrograde activities return them back to the cell body. Both motilities are tightly regulated to keep cilia intact and maintain them at their genetically specified lengths [Dentler (2005); Marshall and Rosenbaum (2001); Marshall et al. (2005); and reviewed in Wilson et al. (2008)]. The disruption of IFT leads to defects in cilia assembly and maintenance, resulting in various human diseases, including polycystic kidney disease, first shown by Pazour et al. (2000) [reviewed in Pedersen and Rosenbaum (2008)].
Fig. 1.

Primary cilia assembly and maintenance via intraflagellar transport. Primary cilia, often found on the apical surface of tubular or ductal epithelia, are formed and maintained via intraflagellar transport. This process proceeds by transport of cilia components by kinesin (plus-end motor) “up” and removal of proteins by dynein (minus-end) “down” the outer doublet microtubules of the primary cilium. The delivery and removal of proteins is a dynamic process constantly turning over the axonemal and membrane components.
II. Rationale
A. Observing Intraflagellar Transport
The original observation of IFT was based on high-resolution differential interference contrast (DIC) imaging in the flagella of Chlamydomonas (Kozminski et al., 1993). The dynamic motion of small membrane bulges supported the hypothesis that material required for flagellar assembly and maintenance may be transported along flagellum itself. Subsequent electron microscopy and biochemical studies (Cole et al., 1998; Kozminski et al., 1995) identified the ultrastructural morphology and protein composition of the IFT machinery. These provided a number of key insights based on where these proteins are localized in the complex architecture of the flagellum and through genetic perturbation their role in building and maintaining flagella. The identification of proteins of the IFT machinery has also enabled a flurry of activity in other model systems. Homologues in other unicellular organisms (Davidge et al., 2006; Tsao and Gorovsky, 2008), nematodes (Cole et al., 1998), insects (Avidor-Reiss et al., 2004), and vertebrates (Pazour et al., 2000) have demonstrated a remarkable conservation in the cellular process of cilium assembly.
The ability to visualize the live movement of IFT was first described in Chlamydomonas by DIC-based methods (Kozminski et al., 1993). However the molecular description of the IFT particles provided a unique opportunity to make live observations through fusions of IFT proteins to fluorescent proteins. Fluorescent proteins have now been derived from many species since their original discovery in the jellyfish, Aequorea victoria, and expression in other systems (Chalfie et al., 1994), giving rise to many colors (Shaner et al., 2005). The first fluorescent protein fusion movement of IFT was described by Orozco et al. (1999) in the nematode Caenorhabditis elegans demonstrating the processive motion of IFT particles in living sensory neuronal cilia. Since that time a number of systems have been used to observe IFT imaging via fluorescent protein fusions including Chlamydomonas (Mueller et al., 2005), trypanosomes (Absalon et al., 2008), sea urchin (Morris et al., 2004), and cultured mammalian cell lines (Follit et al., 2006; Nachury et al., 2007; Tran et al., 2008). Central to these observations has been the ability to dissect particle velocities as well as distinctions between anterograde and retrograde motility. While at this writing this technique is in its infancy, we expect it to be a core technique for understanding the complex process of cilium assembly, regulation, and signaling. Here we describe current techniques for the construction of mammalian cell lines stably expressing IFT-fluorescent protein fusions, high-resolution time-lapse imaging, and analysis of IFT particle transport.
III. Methods for Generation and Characterization of IFT/GFP Fusion Cell Lines
A. Background
Generation of cell lines stably expressing fluorescent protein fusions to cilium proteins has been an important element of high-quality mammalian IFT protein imaging. Transient transfection can result in high levels of expression that can itself interfere with cilium assembly but also results in high cellular background, such that primary cilia are not easily distinguished from the cell body by widefield fluorescence microscopy. A variety of methods exist to generate stably expressing cell lines: (1) integration after transient transfection, (2) retroviral integration, (3) lentiviral mediated integration, (4) Flp-recombinase mediated integration into genomic Frt sites (e.g., Flp cell lines, Invitrogen, Carlsbad, CA, USA) to name a few. Here we describe a method of retroviral gene transfer we have used successfully to generate a number of murine inner medullary collecting duct (IMCD) cell lines stably expressing fluorescent proteins fusions to IFT and other cilium proteins. Here we describe in detail the generation and characterization of the IFT88-EYFP cell line that has been used previously to study IFT trafficking (Tran et al., 2008). The major steps are: (1) building the fluorescent protein fusion cDNA, (2) generation of high titer retroviral virions bearing the fusion cDNA of interest, (3) infection of target cells, and (4) clonal selection and characterization. Under optimal conditions this entire process requires 4–6 weeks.
B. Materials and Methods
293-GP retroviral packaging cell line
Murine inner medullary collecting duct (IMCD) cell line (or parental cell line of choice)
Plasmid for expression of vesicular stomatitis virus G-glycoprotein (pVSV-G)
Polybrene (hexadimethrine bromide)
Transient transfection reagent (Effectene, QIAGEN, Valencia, CA, USA; or reagent of your choice)
Dulbecco’s minimal essential medium (DMEM) supplemented with L-glutamine
Fetal bovine serum (FBS)
100× penicillin/streptomycin (pen/strep)
Blasticidin (or appropriate mammalian selection reagent)
Syringe filter (cellulose acetate, 0.45-μm pore size)
Anti-acetylated alpha-tubulin antibody
Antibody against IFT/cilium protein of interest (in this case anti-IFT88/Polaris)
DAPI
C. Generation of IFT/GFP Cell Lines
A variety of modern molecular reagents now permit rapid amplification and cloning of cDNA sequences into fluorescent protein fusions, so we leave the details of isolation of the cDNA of interest and cloning the fusion sequence open to the preference of the reader. However, there are a few guidelines we have used for the choice of cDNAs and the fluorescent protein. In many cases we have chosen to use cDNAs from the same species as the cell lines of interest (e.g., murine IFT88 into a murine kidney cell line). While the proteins, especially the IFT proteins, are strongly conserved, this choice eliminates cross-species issues when considering possible mislocalization problems that can arise. This becomes of particular importance if the fusion cDNA is being used to replace the endogenous protein, either in a cell line generated from genetically modified mice or in the context of an RNA interference (RNAi)-mediated knockdown.
Fluorescent proteins (FPs) should be chosen for the imaging equipment available. The most popular FP is EGFP, the enhanced version of the green fluorescent protein codon-optimized for mammalian expression and available in a variety of reading frames. The spectral characteristics of EGFP (excitation maximum near 488 nm) are excellent for most fluorescence illuminators as well as confocal imaging with laser-based excitation. Another popular set of FPs are those with fluorescence emission in red and have taken many forms including mCherry and Tag-RFP being the most popular monomeric forms. Many of these are also compatible with a variety of fluorescence light sources. Dual color imaging is possible with EGFP and one of the red variants or with the yellow and cyan variants of the Aequorea GFP (e.g., Venus and Cerulean, respectively) (Shaner et al., 2005). Once the fusion cDNA has been generated, transient transfection can be used to test cilium localization; however, as described above, this can result in overexpression and difficulty in cilium localization.
To generate a stable cell line expressing murine IFT88 fused (at the C-terminus) to enhanced yellow fluorescent protein (EYFP) (IFT88-EYFP) a retroviral expression plasmid based on a vector derived from Moloney murine leukemia virus (MoMLV) was generated. Our retroviral vector was constructed from a modified pBABE vector (Morgenstern and Land, 1990) containing the blasticidin resistance gene expressed from a SV40 promoter that is independent of the viral long terminal repeat promoter. Into this vector (pBABEblast) we cloned the IFT88-EYFP fusion cDNA. A packaging cell line derived from the human embryonic kidney cell line 293 that expresses the MoMLV gag and pol genes (293-GP) but lacking a viral envelope gene was used to generate retroviral particles via cellular expression of a VSV-G (amphotropic) envelope protein. The VSV-G-pseudotyped MoMLV retrovirus has a number of advantages. First, this MoMLV-derived retrovirus has high stability for long-term storage. Second, due to the virus’ stability it can be concentrated to high titers by ultracentrifugation or PEG-mediated (polyethylene glycol) precipitation. And third, VSV-G-pseudotyped MoMLV virus extends cell tropism. Such viruses can infect a broad spectrum of cell types of mammalian as well as nonmammalian origin.
To make VSV-G-pseudotyped MoMLV retrovirus, the 293-GP packaging cell line was split 1:10 to a 10-cm plate (~106 cells) in 10 ml of DMEM/10% FBS/1 × pen/strep (growth medium) 24 h prior to transfection. The cells must be approximately 60–70% confluent prior to transfection. The transfection cocktail was prepared by adding 4 μg retroviral plasmid (pBABEblast-IFT88-EYFP), 3 μg pVSV-G plasmid, EC buffer (from Effectene kit) to bring total volume to 300 μl. After the addition of 16 μl of enhancer, the mixture was vortexed for 1 s and incubated for 5 min at 37°C. Then 60 μl of the Effectene reagent was added, followed by vortexing for 10 s and incubation at 37°C for 20 min. After incubation of this mixture and addition of 1 ml of growth medium the transfection cocktail was immediately spread dropwise over 293-GP cells and gently agitated to ensure uniform mixing. Approximately 10 h post-transfection, the transfection growth medium was gently replaced with 6 ml of fresh growth medium. The growth medium containing the retroviral particles was collected 48 h after medium change. The retroviral supernatant was gently collected using 20-ml syringe and filtered through a 0.45-μm filter to remove living cells and large cellular debris. The retroviral supernatant was ready for immediate use. The retroviral supernatant is stable at 4°C for 2 weeks. Frozen stocks can be stored at −80°C at the expense of decreased viral infectivity.
To generate the IFT88-EYFP-expressing cell line, murine inner medullary collecting duct (IMCD) cells were infected by VSV-G-pseudotyped MoMLV retrovirus. We, and others, have used a variety of cell lines for IFT imaging including IMCD (murine), MDCK (canine), PtK2 (rat kangaroo), and RPE (human). An important parameter in choosing the parental cell line is the robust production of long primary cilia in culture. Some cells require extensive culture after reaching confluence to produce primary cilia, whereas others produce cilia at high percentage even before the onset of confluence. The length of primary cilia varies greatly between cell lines but for robust imaging, primary cilia should be at least 4–6 μm on average.
The retrovirus integrates its viral genome, encoding the gene of interest, into the host genome after the infected cell has undergone nuclear envelope breakdown and mitosis. Thus, it is critical that the host cells undergo mitosis shortly after virus infection. One day prior to infection, IMCD cells were split into 6-well plates (~200,000 cells with 2 ml of growth medium per well). Retroviral infection was performed by adding 300 μl of infection cocktail consisting of retroviral stock (fresh or thawed) supplemented by Polybrene to a final concentration of 10 μg/ml to each well. Polybrene is a cationic polymer, which acts to neutralize the charge repulsion between virions and the cell surface, thereby increasing infection efficiency. Approximately 10 h postinfection, virus-containing medium was replaced by 2 ml of fresh growth medium. Selection medium consisting of growth medium supplemented with 2 μg/ml blasticidin was applied 48 h later and then changed every 3 days for 2 weeks. Selection agent concentrations should be optimized for each agent and cell line to ensure cell death in the absence of infection and genomic integration.
Colonies were isolated after selection by conventional methods (e.g., cloning cylinders) and placed into 24-well plates. These monoclonal lines were expanded to 6-well plates for characterization.
D. Characterization of Cell Lines
The successful visualization of IFT particle trafficking in the cilium depends strongly on the level of IFT88-EYFP expression. The clone with the highest level of expression of the tagged protein is not always the best choice for imaging as IFT88 and other IFT/cilium proteins are present in the cytoplasm as well as in the cilium. Thus, at a high level of expression the fluorescence coming from the cytoplasmic pool of the protein can interfere with the quality of resolution of the IFT particles in the cilium. At high concentrations fluorescent-tagged proteins can also form aggregates interfering with IFT imaging and cell viability. In addition to level of expression, it is essential to have a number of independent phenotypic measurements to ensure the fidelity of localization of the fusion protein and the absence of unintended artifacts. For example, colocalization of the tagged gene of interest with cilia, measurements of cell-cycle profile and timing, and cilia morphology and length distribution are all important correlative measures to ensure that the fusion protein recapitulates the behavior of the endogenous protein. In certain circumstances where RNA interference can be carried out against the endogenous protein, or genetic deletion of the gene of interest, rescue of the gene-loss phenotype is the definitive test for appropriate functioning of the fusion gene product.
The expanded monoclonal cell lines expressing IFT88-EYFP and control IMCD cells were cultured in 6-well plates, and soluble cell lysates were subjected to SDS-PAGE and immunoblotting. Detection of IFT88 by anti-IFT88/polaris (kind gift of Bradley K. Yoder, University of Alabama at Birmingham, USA) demonstrated expression of the endogenous and fusion proteins (Fig. 2). Those clones with detectable expression were selected for further characterization.
Fig. 2.

Measurement of the expression level of IFT88-EYFP in monoclonal lines. Immunoblotting cell lysates from monoclonal cell lines shows the level of IFT88-EYFP in comparison to the endogenously expressed protein (tubulin used as a loading control). Different clones express varying levels of the fusion protein and while low expressors are usually eliminated at this stage, further phenotypic analyses are required to assess the utility of the chosen cell lines.
Monoclonal cell lines were subjected to immunofluorescence analysis to observe cilium morphology and cilium length. IFT88-EYFP and control cells were cultured on glass coverslips to 100% confluency. Cells were processed to detect the EYFP fusion protein via intrinsic fluorescence and primary cilia using an anti-acetylated alpha-tubulin. Immunofluorescence samples were imaged on a Nikon TE2000-E2 inverted microscope system (Nikon Instruments, Melville, NY, USA) with a Plan-Fluor 60× NA 1.4 oil objective. The colocalization of exogenously expressed IFT88-EYFP and primary cilia shows that the fusion protein can enter primary cilia (Fig. 3A). Cilium length was measured by using ImageJ (http://rsb.info.nih.gov/ij/) software using acetylated tubulin as a primary cilium marker (Fig. 3B). Analysis of cilia lengths in parental IMCD cells and the IFT88-EYFP-4 clonal line shows statistically similar cilia length distribution indicating no gross perturbation in cilium length in this monoclonal line (Fig. 3C). A number of monoclonal lines were generated to permit comparison between cell lines and to avoid observations based on clonal artifacts.
Fig. 3.

Phenotypic characterization of IFT fusion protein cell lines (A) IFT88-EYFP (green) is localized to primary cilia. Acetylated alpha-tubulin was used as a ciliary marker (red). Scale bars are 5μm. (B) Cilia length is measured for both the parental cell line and the monoclonal cell lines by axonemal staining via indirect immunofluorescence of acetylated alpha-tubulin. (C) Histograms depict distribution of cilia length in parental IMCD and in the monoclonal IFT88-EYFP-4 cell line (n>150). (See Plate no. 12 in the Color Plate Section.)
IV. Live Imaging of Mammalian IFT
A. Background
Observing IFT requires following particles that are themselves beyond the resolution limit of the optical microscope (~250-nm resolution vs 100- to 200-nm particles) (Kozminski et al., 1995). This resolution limit limits our ability to determine IFT particle size or number with precision. However, the long, processive motions of IFT particles observed by DIC microscopy indicate that the subresolution fluorescent dots could be followed over long distances (relative to the resolution limit) and long-time frames to permit accurate measurement of their motions. That is, they move many times the resolution limit in a measureable time-frame to be able to calculate a velocity. This velocity has been characterized in a number of model systems, and in mammalian cells can be used to determine motion of many components of the IFT process—motors, adaptors, or cargos and any changes that may occur as a result of external perturbation or genetic modification (e.g., Tran et al., 2008). Below we outline current methods to determine IFT particle velocity in living mammalian primary cilia using the cell lines generated in the previous section.
B. Materials and Methods
18-mm poly-L-lysine-coated coverslips
Leibovitz’s L-15 phenol red-free medium
FBS
100× L-glutamine
100× pen/strep
100× sodium pyruvate
100× MEM nonessential amino acids (NEAA)
35×50-mm microscope coverslips
Vacuum grease
Inverted microscope with epifluorescence illumination
High numerical aperture objectives (NA>1.0)
Cooled CCD or EMCCD camera and software for timelapse imaging
C. Preparation of Cells
To permit the visualization of primary cilium IFT particle movement and IFT velocity measurements, cells are imaged in their quiescent state when they reach the highest frequency of ciliation. This can be done in two ways: either by (1) contact inhibition when cultured in growth medium to 100% confluency or by (2) serum starvation (0.2% FBS) for 24–48 h imposed on ~60% confluent cells. Note that these parameters were defined for IMCD cells and use of other cell lines may require different parameters for high levels of ciliation.
One of the obstacles that make it difficult to image and achieve high-resolution IFT particle visualization along the cilium axis is that this organelle is projected perpendicular to the cell surface and thus orthogonal to the optical x–y image frame. To overcome this problem and to position the primary cilium perpendicular to the light path (i.e., parallel to the imaging frame), a simple home-made chamber was devised. The procedure for cell preparation for imaging is illustrated schematically in Fig. 4. IFT88-EYFP cells, usually a clonal line of IMCD cells expressing IFT88-EYFP cells, were cultured on 18-mm poly-L-lysine-coated coverslips in growth medium (Fig. 4; step 1). A confluent monolayer of cells was washed one time with PBS and then immersed in live cell media consisting of Leibovitz’s L-15 phenol red-free medium, with 10% FBS (unless using a serum starvation protocol), L-glutamine, pen/strep, sodium pyruvate, and NEAAs. Coverslips were then placed face down on a larger 35×50-mm microscope cover glass having on the surface a small droplet of live cell medium.
Fig. 4.

Schematic of sample preparation for IFT Imaging. IMCD cells expressing IFT88-EYFP were cultured on poly-L-lysine-coated coverslips in growth medium (step 1). Slides with confluent monolayer of cells were transferred, cell side down, on a large microscope cover glass with a small amount of live cell medium on the surface. To avoid medium evaporation this simple chamber was sealed with vacuum grease (gray) (steps 2 and 3). Chambers with cells were imaged on an inverted microscopy imaging system. IFT particles are seen as a punctuate pattern throughout the ciliary axoneme by conventional widefield imaging (steps 4 and 5). Scale bar is 5 μm.
The amount of live cell medium between the two coverslips is critical for successful cilium imaging. We suggest adjusting the volume so that it will allow cilia imaging in the focal plane positioned at the center of the home-made chamber. This involves adding enough media to prevent bubbles from accumulating and not so much as to have the upper coverslip floating on the lower one. Depending on the cell type, confluency state, morphology (i.e. cuboidal or flattened), the volume of medium used can be varied slightly. The amount of medium can be roughly estimated based on the cells and cilia thickness and the diameter of coverslips used to culture the cells. For 100% confluent monolayer of IMCD cells growing on 18-mm coverslips the total amount of medium was ~5 μl. After 2–3 min of being immersed in live cell medium approximately 1 μl of medium was left on the coverslip surface. Thus, 4 μl was placed on 35×50-mm microscope cover glass. When placing the 18-mm coverslips face down on a 4-μl droplet of medium it is important to avoid bubbles and avoid applying pressure over the entire coverslip and permit the medium to spread evenly via surface tension. To avoid medium evaporation the chamber was sealed with vacuum grease gently applied around the edge of the smaller coverslip once it was in place (Fig. 4; steps 2 and 3).
D. Live Imaging of Primary Cilia
The “chamber” with cells was imaged on a TE2000-E2 inverted microscope system (Nikon Instrument Inc.) enclosed within a temperature-controlled environment (In Vivo Scientific, St. Louis, MO, USA) (Fig. 4; steps 4 and 5). The size of the large microscope cover glass was chosen to fit in the sample holder of the incubation chamber of the light microscope. Cells were kept at 37°C during analysis. Time-lapse images were captured by IPLab software to a cooled CCD camera (COOLSNAP HQ, Roper Scientific, Tuscon, AZ, USA). For a selected field, greater than 100 frames were collected at rapid intervals (anywhere from 100 to 750 ms interframe intervals) using a PlanApo 60× NA 1.4 oil objective with exposure time between 100 and 200 ms at 2×2 binning. A live-cell image of a large field of IMCD cells stably expressing IFT88-EYFP is shown in Fig. 4 (step 5). Visualization of the primary cilia revealed a punctuate pattern of distribution of IFT88-EYFP throughout the ciliary axoneme as seen for endogenous IFT88. Figure 5A depicts a typical sequence of frames revealing IFT88-EYFP particle movement (http://www.elsevierdirect.com/companions/9780123749734, Supplemental movie 1). Particle movement can be visualized in the still frames, but does not lend itself easily to quantitative analysis. Kymographic analysis, described below, produces images that can be used to easily view particle trajectories and calculate velocities (Fig. 5B).
Fig. 5.

IFT particles movement. (A) Visualization of the IFT88-EYFP particles in live IMCD cells revealed a punctuate distribution throughout the ciliary axoneme. White arrowheads and double arrowheads highlight particle movement. The white circle indicates the cilium tip. (B) To determine the IFT particles velocities, time-lapse image sequences were assembled into kymographs. White solid lines on the kymograph indicate anterograde movements whereas white dashed lines indicated retrograde velocities [arrowhead and double arrowhead correspond to the movements in panel (A)]. Horizontal scale bars are 5 μm, vertical scale bar is 5 s.
E. Analysis
To determine the IFT particle velocity, time-lapse image sequences were assembled into kymographs using the ImageJ software with the kymograph plugin. The kymograph-based velocity measurement is illustrated schematically in Fig. 6. First, the time series of moving particles along the cilium, 2D images (x, y) were converted into a time series, or stack (3D images—x, y, and t) (Fig. 6A). Next a linear region of interest was drawn along the cilium. The kymograph takes this region from each image to generate a new image in which the horizontal axis is the length of linear region and the vertical axis is time for each extracted region (Fig. 6B). The kymographic image can be generated with the use of the multiple kymograph plugin for ImageJ. The lines on the time–space–image correspond to the paths of each moving particle along the cilium. The y-axis of the kymograph is a time axis, which depicts the time of particle movement along the cilium from the basal body to the tip (anterograde movement) or in the reverse direction (retrograde movement). The unit of the y-axis is the time interval of the taken sequence images. The x-axis represents the distance of traveled particles along the cilium (the line ROI) in the unit of the pixel size of cilium length. To calculate velocities from the kymograph a line was drawn along each track of the particles and the slope calculated, which is the inverse of the velocity (Fig. 6C). The larger the angle between the trajectory and the vertical (time) axis, the faster is the particle movement; the smaller the angle the slower the particle movement. The velocity unit is given in pixels per the time interval of the sequence, which can be converted into μm/sec based on the length mapping through the microscope and interframe interval. It is of note that the cilium tip usually has the brightest intensity, which appears as a bright edge in the kymograph, and can help to identify the direction of the particle movement, that is, anterograde versus retrograde. An example kymograph of IFT88 movement is presented in Fig. 5B. There are a number of anterograde trajectories visible in this kymograph and one retrograde motion. Analysis of many such trajectories on many kymographs can provide a velocity histogram (Fig. 7) for the IFT88-EYFP particle movement. Here we see that for IFT88 in IMCD cells the retrograde velocity (0.6 μm/s) is approximately two times faster than the anterograde velocity (0.3 μm/s). Measurements of this type carried out under various external signaling or genetic perturbations promise to be an important tool in dissecting mechanisms in primary cilia assembly and signaling.
Fig. 6.
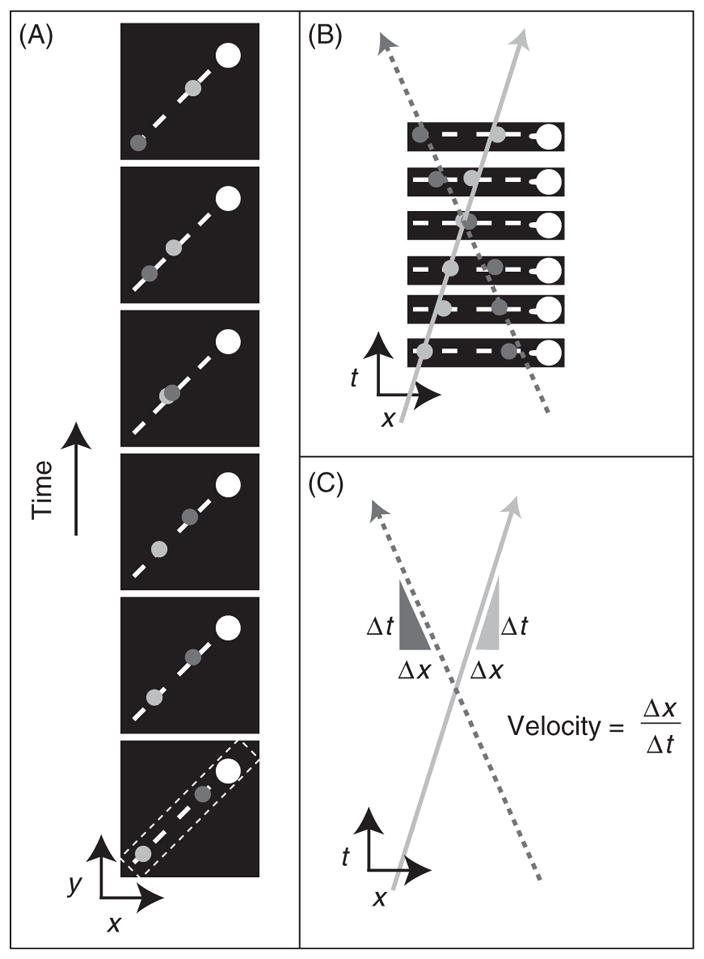
Schematic illustration of kymograph based analysis of IFT velocities. (A) The sequential frames of particles moving along the cilium 2D images (x, y) were converted into a time series, 3D images (x, y, and t). A line region of interest was identified on the first frame, along the axis of the cilium. The bulging side of the cilium is the tip. (B) The kymograph, a new single time–space–image, is generated from gray values along the line of each frame of the time series. The lines correspond to the paths of each moving particle along the cilium (solid line anterograde and dashed line retrograde). (C) The slopes of these lines correspond to velocities of moving particles.
Fig. 7.

To determine the IFT particles velocities, time-lapse image sequences were assembled into kymographs and velocities calculated as described. Anterograde velocity in mammalian cilia is slower that the retrograde in IMCD cells. Velocity is given in μm/s.
V. Outlook
Measurements of IFT in mammalian primary cilia have already overcome some important technical challenges revealing many opportunities for discovery. Regulation of the IFT process itself and its impact on cilium signaling and length regulation is an area of keen interest in the field and the ability to correlate IFT measurements across model systems, such as Chlamydomonas, nematodes, and mammals will be a powerful experimental tool. That being said, the velocities of IFT particles in various model systems do differ; in Chlamydomonas the anterograde IFT velocity is 2 μm/s whereas nematode sensory cilia have anterograde IFT particles moving at 0.7 μm/s and mammalian primary cilia slower yet at 0.3 μm/s. These differences point to important species-specific regulation of cilium trafficking. Nonetheless, the ability to visualize mammalian primary cilia in the simple chamber geometry presented here can provide detailed experimental observations of the many ciliary membrane and axonemal proteins and help in defining their role in cilium regulation and the increasing number of physiologic cilium functions. Finally the wealth of genetic data linking ciliary proteins to human disease provides fertile ground for revealing links between observations of IFT trafficking, cilium signaling, and the pathogenesis of human ciliopathies.
Acknowledgments
The authors thank members of the Shah lab for discussions and especially Yinghua Guan for microscopy advice and the IFT88-EYFP examples used here. A part of this work was supported by the NIH Harvard Polycystic Kidney Disease Center (P50DK074030 to J.V.S.).
References
- Absalon S, Blisnick T, Kohl L, Toutirais G, Doré G, Julkowska D, Tavenet A, Bastin P. Intraflagellar transport and functional analysis of genes required for flagellum formation in trypanosomes. Mol Biol Cell. 2008;19:929–944. doi: 10.1091/mbc.E07-08-0749. [DOI] [PMC free article] [PubMed] [Google Scholar]
- Avidor-Reiss T, Maer AM, Koundakjian E, Polyanovsky A, Keil T, Subramaniam S, Zuker CS. Decoding cilia function: Defining specialized genes required for compartmentalized cilia biogenesis. Cell. 2004;117:527–539. doi: 10.1016/s0092-8674(04)00412-x. [DOI] [PubMed] [Google Scholar]
- Chalfie M, Tu Y, Euskirchen G, Ward WW, Prasher DC. Green fluorescent protein as a marker for gene expression. Science. 1994;263:802–805. doi: 10.1126/science.8303295. [DOI] [PubMed] [Google Scholar]
- Cole DG, Diener DR, Himelblau AL, Beech PL, Fuster JC, Rosenbaum JL. Chlamydomonas kinesin-II-dependent intraflagellar transport (IFT): IFT particles contain proteins required for ciliary assembly in Caenorhabditis elegans sensory neurons. J Cell Biol. 1998;141:993–1008. doi: 10.1083/jcb.141.4.993. [DOI] [PMC free article] [PubMed] [Google Scholar]
- Davidge JA, Chambers E, Dickinson HA, Towers K, Ginger ML, McKean PG, Gull K. Trypanosome IFT mutants provide insight into the motor location for mobility of the flagella connector and flagellar membrane formation. J Cell Sci. 2006;119:3935–3943. doi: 10.1242/jcs.03203. [DOI] [PubMed] [Google Scholar]
- Dentler W. Intraflagellar transport (IFT) during assembly and disassembly of Chlamydomonas flagella. J Cell Biol. 2005;170:649–659. doi: 10.1083/jcb.200412021. [DOI] [PMC free article] [PubMed] [Google Scholar]
- Follit JA, Tuft RA, Fogarty KE, Pazour GJ. The intraflagellar transport protein IFT20 is associated with the Golgi complex and is required for cilia assembly. Mol Biol Cell. 2006;17:3781–3792. doi: 10.1091/mbc.E06-02-0133. [DOI] [PMC free article] [PubMed] [Google Scholar]
- Gerdes JM, Davis EE, Katsanis N. The vertebrate primary cilium in development, homeostasis, and disease. Cell. 2009;137:32–45. doi: 10.1016/j.cell.2009.03.023. [DOI] [PMC free article] [PubMed] [Google Scholar]
- Kozminski KG, Beech PL, Rosenbaum JL. The Chlamydomonas kinesin-like protein FLA10 is involved in motility associated with the flagellar membrane. J Cell Biol. 1995;131:1517–1527. doi: 10.1083/jcb.131.6.1517. [DOI] [PMC free article] [PubMed] [Google Scholar]
- Kozminski KG, Johnson KA, Forscher P, Rosenbaum JL. A motility in the eukaryotic flagellum unrelated to flagellar beating. Proc Natl Acad Sci USA. 1993;90:5519–5523. doi: 10.1073/pnas.90.12.5519. [DOI] [PMC free article] [PubMed] [Google Scholar]
- Marshall WF, Qin H, Rodrigo Brenni M, Rosenbaum JL. Flagellar length control system: Testing a simple model based on intraflagellar transport and turnover. Mol Biol Cell. 2005;16:270–278. doi: 10.1091/mbc.E04-07-0586. [DOI] [PMC free article] [PubMed] [Google Scholar]
- Marshall WF, Rosenbaum JL. Intraflagellar transport balances continuous turnover of outer doublet microtubules: Implications for flagellar length control. J Cell Biol. 2001;155:405–414. doi: 10.1083/jcb.200106141. [DOI] [PMC free article] [PubMed] [Google Scholar]
- Morgenstern J, Land H. Advanced mammalian gene transfer: High titre retroviral vectors with multiple drug selection markers and a complementary helper-free packaging cell line. Nucleic Acids Res. 1990;18:3587–3596. doi: 10.1093/nar/18.12.3587. [DOI] [PMC free article] [PubMed] [Google Scholar]
- Morris RL, English CN, Lou JE, Dufort FJ, Nordberg J, Terasaki M, Hinkle B. Redistribution of the kinesin-II subunit KAP from cilia to nuclei during the mitotic and ciliogenic cycles in sea urchin embryos. Dev Biol. 2004;274:56–69. doi: 10.1016/j.ydbio.2004.06.017. [DOI] [PubMed] [Google Scholar]
- Mueller J, Perrone CA, Bower R, Cole DG, Porter ME. The FLA3 KAP subunit is required for localization of kinesin-2 to the site of flagellar assembly and processive anterograde intraflagellar transport. Mol Biol Cell. 2005;16:1341–1354. doi: 10.1091/mbc.E04-10-0931. [DOI] [PMC free article] [PubMed] [Google Scholar]
- Nachury MV, Loktev AV, Zhang Q, Westlake CJ, Peränen J, Merdes A, Slusarski DC, Scheller RH, Bazan JF, Sheffield VC, Jackson PK. A core complex of BBS proteins cooperates with the GTPase Rab8 to promote ciliary membrane biogenesis. Cell. 2007;129:1201–1213. doi: 10.1016/j.cell.2007.03.053. [DOI] [PubMed] [Google Scholar]
- Orozco JT, Wedaman KP, Signor D, Brown H, Rose L, Scholey JM. Movement of motor and cargo along cilia. Nature. 1999;398:674. doi: 10.1038/19448. [DOI] [PubMed] [Google Scholar]
- Pazour GJ, Dickert BL, Vucica Y, Seeley ES, Rosenbaum JL, Witman GB, Cole DG. Chlamydomonas IFT88 and its mouse homologue, polycystic kidney disease gene tg737, are required for assembly of cilia and flagella. J Cell Biol. 2000;151:709–718. doi: 10.1083/jcb.151.3.709. [DOI] [PMC free article] [PubMed] [Google Scholar]
- Pedersen LB, Rosenbaum JL. Intraflagellar transport (IFT) role in ciliary assembly, resorption and signalling. Curr Top Dev Biol. 2008;85:23–61. doi: 10.1016/S0070-2153(08)00802-8. [DOI] [PubMed] [Google Scholar]
- Rosenbaum JL, Moulder JE, Ringo DL. Flagellar elongation and shortening in Chlamydomonas. The use of cycloheximide and colchicine to study the synthesis and assembly of flagellar proteins. J Cell Biol. 1969;41:600–619. doi: 10.1083/jcb.41.2.600. [DOI] [PMC free article] [PubMed] [Google Scholar]
- Shaner NC, Steinbach PA, Tsien RY. A guide to choosing fluorescent proteins. Nat Methods. 2005;2:905–909. doi: 10.1038/nmeth819. [DOI] [PubMed] [Google Scholar]
- Tran PV, Haycraft CJ, Besschetnova TY, Turbe-Doan A, Stottmann RW, Herron BJ, Chesebro AL, Qiu H, Scherz PJ, Shah JV, Yoder BK, Beier DR. THM1 negatively modulates mouse sonic hedgehog signal transduction and affects retrograde intraflagellar transport in cilia. Nat Genet. 2008;40:403–410. doi: 10.1038/ng.105. [DOI] [PMC free article] [PubMed] [Google Scholar]
- Tsao CC, Gorovsky MA. Different Effects of Tetrahymena IFT172 Domains on Anterograde and Retrograde Intraflagellar Transport. Mol Biol Cell. 2008;19:1450–1461. doi: 10.1091/mbc.E07-05-0403. [DOI] [PMC free article] [PubMed] [Google Scholar]
- Wilson NF, Iyer JK, Buchheim JA, Meek W. Regulation of flagellar length in Chlamydomonas. Semin Cell Dev Biol. 2008;19:494–501. doi: 10.1016/j.semcdb.2008.07.005. [DOI] [PMC free article] [PubMed] [Google Scholar]