Abstract
The aim of the study was to evaluate in human immunodeficiency virus (HIV)-infected patients estimated glomerular filtration rate (eGFR) trajectories during treatment with different protease inhibitors (PIs) or a non-nucleoside reverse transcriptase inhibitor (NNRTI) plus tenofovir (TDF) or abacavir (ABC) and lamivudine or emtricitabine (xTC).
Retrospective study of patients followed at a single clinical center; all patients who started TDF or ABC for the first time with a NNRTI or lopinavir/r (LPV/r) or atazanavir/r (ATV/r) or darunavir/r (DRV/r), for whom at least 1 eGFR value before the start and during the studied treatment was known, were included in this analysis. eGFR was calculated by means of the CKD-EPI formula. Univariate and multivariate mixed linear model (MLM) was applied to estimate eGFR slope with the considered antiretroviral treatment.
In the 1658 patients treated with TDF/xTC (aged 43 [37–48] years, with an eGFR of 105 [96; 113] mL/min/1.73 m2, 80% males, 92% Caucasians, 10% coinfected with HCV, 4% with diabetes, 11% with hypertension, 38% naive for antiretroviral therapy (ART), 37% with HIV-RNA <50 copies/mL) the median follow-up was 2.5 (1.2–4.6) years. Their adjusted eGFR slopes (95% CI) were −1.26 (−1.58; −0.95), −0.43 (−1.20; +0.33), −0.86 (−1.28; −0.44), and −0.20 (−0.42; +0.02) mL/min/1.73 m2 per year in patients treated with ATV/r, DRV/r, LPV/r, and NNRTI, respectively. Patients receiving ATV/r or LPV/r had a greater adjusted decline in eGFR compared with those receiving NNRTIs (difference −1.06 [−1.44; −0.69] mL/min/1.73 m2 per year, P <0.001; and −0.66 [−1.13; −0.20] mL/min/1.73 m2 per year, P = 0.005, respectively); adjusted eGFR slopes were similar in patients receiving DRV/r and in those receiving NNRTIs. Patients receiving ATV/r had a greater adjusted eGFR decline than those treated with DRV/r (difference −0.83 [−1.65; −0.02] mL/min/1.73 m2 per year; P = 0.04), but not than those receiving LPV/r; no significant difference was observed in adjusted eGFR slopes between patients receiving DRV/r and those receiving LPV/r. In the 286 patients treated with ABC and lamivudine, eGFR slopes were similar, independent of the PI.
In patients receiving TDF/xTC, eGFR trajectories were small for all regimens and declined less in patients receiving DRV/r or NNRTIs than in those treated with ATV/r or LPV/r.
INTRODUCTION
Tenofovir disoproxil fumarate (TDF) is a recommended nucleotide reverse transcriptase inhibitor (NRTI) for all first-line regimens,1–4 but patients treated with this drug can experience kidney toxicity. Although kidney toxicity associated with TDF is primarily tubular,5–7 patients starting their first-line treatment with regimens including TDF had a larger relative decline in glomerular filtration rate (GFR) than those who received alternative nucleoside analogues.8–15 Exposure to TDF was also associated with increased odds16–19 and to an higher incidence18,20,21 of chronic kidney disease (CKD); however, the loss in eGFR attributable to TDF through 10 years of follow-up was relatively mild in 1 study.22
Many HIV-infected patients treated with TDF receive this drug along with ritonavir (RTV)-boosted protease inhibitors (PIs/r), which may have renal toxicity themselves and contribute to renal toxicity due to TDF: studies from large international cohorts found an increased risk of CKD associated with the use of either ritonavir-boosted atazanavir (ATV/r) or lopinavir (LPV/r) or unboosted atazanavir, which was independent of TDF use.19,20 When patients included in 1 of these cohorts with normal kidney function were followed up, cumulative exposure to TDF, ATV/r, or LPV/r was significantly associated with increasing risk of CKD.23 However, the risk of developing CKD with the widely used PI/r darunavir/ritonavir (DRV/r) was not specifically investigated in this study.
Cumulatively, data from different studies showed that regimens based on TDF and a PI/r were associated with greater declines in renal function over 48 weeks than those based on TDF in combination with a non-NRTI (NNRTI).17,24–31 In particular, in treatment-naive patients randomized to receive abacavir/lamivudine (ABC/3TC) or TDF/emtricitabine (FTC) with efavirenz (EFV) or ATV/r (A5202 Study), statistically significant improvements from baseline to weeks 48 and 96 in creatinine clearance were found in all treatment arms, except in that of patients treated ATV/r with TDF/FTC.32 Similar findings emerged from a smaller randomized clinical trial.33
Thus, different PIs/r have different impact on kidney function, which might depend in part upon the association with TDF. However, GFR trajectories in patients treated with different PIs/r or with NNRTIs and different NRTI backbones have not been fully studied.
The primary objective of this study was to evaluate if, in patients treated with a PI/r plus TDF or ABC (and 3TC or FTC), estimated GFR (eGFR) trajectories differ according to the use of different PIs/r in the same regimen. The secondary objective was to compare eGFR trajectories in patients treated with TDF or ABC and different PIs/r to those observed in patients treated with TDF or ABC and NNRTIs.
METHODS
Retrospective cohort study on patients on treatment with TDF or ABC and a PI or a NNRTI, followed at the Infectious Diseases Department of the San Raffaele Scientific Hospital in Milan (Italy) since September 1995 up to September 2014. Data recorded in the database of the Infectious Diseases Department of the San Raffaele (IDD-HSR) in Milan, Italy, were used for the analyses. Briefly, this is an observational database that collects demographic, clinical, therapeutic, and laboratory data of adult subjects receiving primary care for HIV infection, as outpatients or inpatients, at the Infectious Diseases Department of the San Raffaele Scientific Institute in Milan, Italy. At their first visit (in our clinic), subjects provide written informed consent to include their clinical and laboratory data in the IDD-HSR for scientific purposes. Information on prescribed antiretroviral and concomitant drugs (type, dosage, date of start or stop) are prospectively recorded into the database at each visit by the treating physician and then checked by skilled data managers. For the purpose of the present study, the following demographics and clinical characteristics were retrieved from the database: baseline age, gender, race (ancestry), body mass index (BMI), HIV risk factor, time since HIV diagnosis, coinfection with hepatitis C virus (HCV), presence of diabetes or hypertension, ongoing diuretic therapy, previous diagnosis of acquired immune deficiency syndrome (AIDS), baseline and nadir cluster differentiation 4 (CD4)+ cell count, antiretroviral therapy (ART) history (naive vs. experienced), time since ART initiation (only for treatment-experienced patients), HIV viral load, eGFR.
Eligible patients were those who started tenofovir (TDF) or abacavir (ABC) in combination with a NNRTI (efavirenz or nevirapine) or lopinavir/r (LPV/r) or atazanavir/r (ATV/r) or darunavir/r (DRV/r), who had a baseline eGFR determination (within 90 days before the start of the considered regimen) and with at least 1 eGFR determination during follow-up, while on this regimen.
Follow-up accrued from the start of TDF/ABC (baseline) up to the stop of any drug of the regimen or lost to follow-up or data freezing (September 2014). For subjects with multiple treatment episodes with TDF or ABC in combination with a NNRTI or LPV/r or ATV/r or DRV/r, the first episode was considered.
For the analysis of eGFR slopes in patients treated with TDF, follow-up after discontinuation of PI or NNRTI or TDF was also considered (the freezing date was always September 2014).
eGFR was calculated using the CKD Epidemiology Collaboration Equation (CKD-EPI).34
A CKD diagnosis was defined as the occurrence of 2 consecutive eGFR determinations <60 mL/min/1.73 m2.
Statistical Analysis
eGFR trajectories were estimated during treatment with the studied regimens.
The analyses considered those characteristics that likely determined the choice of the PI/r being considered and thus serving as confounding factors for the outcome of the study. Specifically, we evaluated the following variables: age, gender, race, body mass index, time since HIV diagnosis, baseline CD4+, baseline viral load, hypertension, diabetes, current use of diuretics, nadir CD4+, time since ART initiation, first line versus nonfirst line regimen, HCV coinfection, calendar year of the start of the study regimen.
Results were described as median (interquartile range, IQR) or frequency (%). At univariate analysis, comparisons of subjects’ characteristics between antiretroviral treatment groups were performed using the χ2/Fisher exact test for categorical variables and by use of the Kruskal–Wallis test or the Wilcoxon rank sum test for continuous variables.
Univariate and multivariate mixed linear models (MLM) with random slope and intercept for each patient were fitted to estimate eGFR changes according to the third drug included in the regimen: 1 NNRTI, ATV/r, DRV/r, LPV/r. Slopes were reported with the corresponding 95% confidence interval. All the baseline characteristics were entered into the multivariate models as potential confounders with the exception of age, gender, race, and creatinine levels as they are already included into the CKD-EPI formula. CD4+ and HIV-RNA were used as time-updated variables.
The incidence rate of CKD development in each study regimen was calculated as number of CKD events per 1000 person-years of follow-up (PYFU). Poisson regression was used for comparisons of incidence rates in the 4 study regimens (ATV/r, DRV/r, LPV/r, and NNRTI).
All analyses were conducted using SAS statistical software version 9.2 (Statistical Analyses System Inc, Cary, NC).
RESULTS
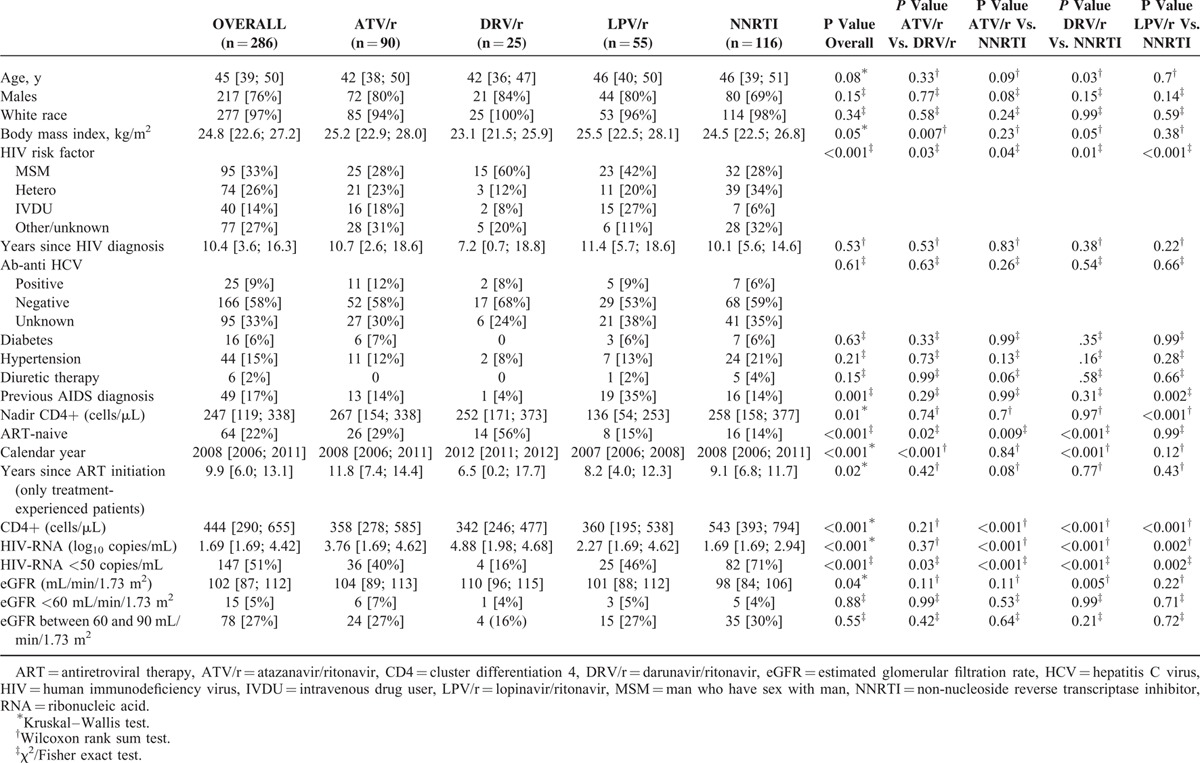
One thousand nine-hundred forty-four patients (1658 treated with TDF and 286 patients treated with ABC), among 4256 on antiretroviral treatment, fulfilled the inclusion criteria. Their baseline characteristics are described in Tables 1 and 2.
TABLE 1.
Baseline Demographic, Clinical and Laboratory Characteristics of Patients Treated With Tenofovir Plus Emtricitabine or Lamivudine and Either Atazanavir/Ritonavir or Darunavir/Ritonavir or Lopinavir/Ritonavir or a Non-Nucleoside Reverse Transcriptase Inhibitor
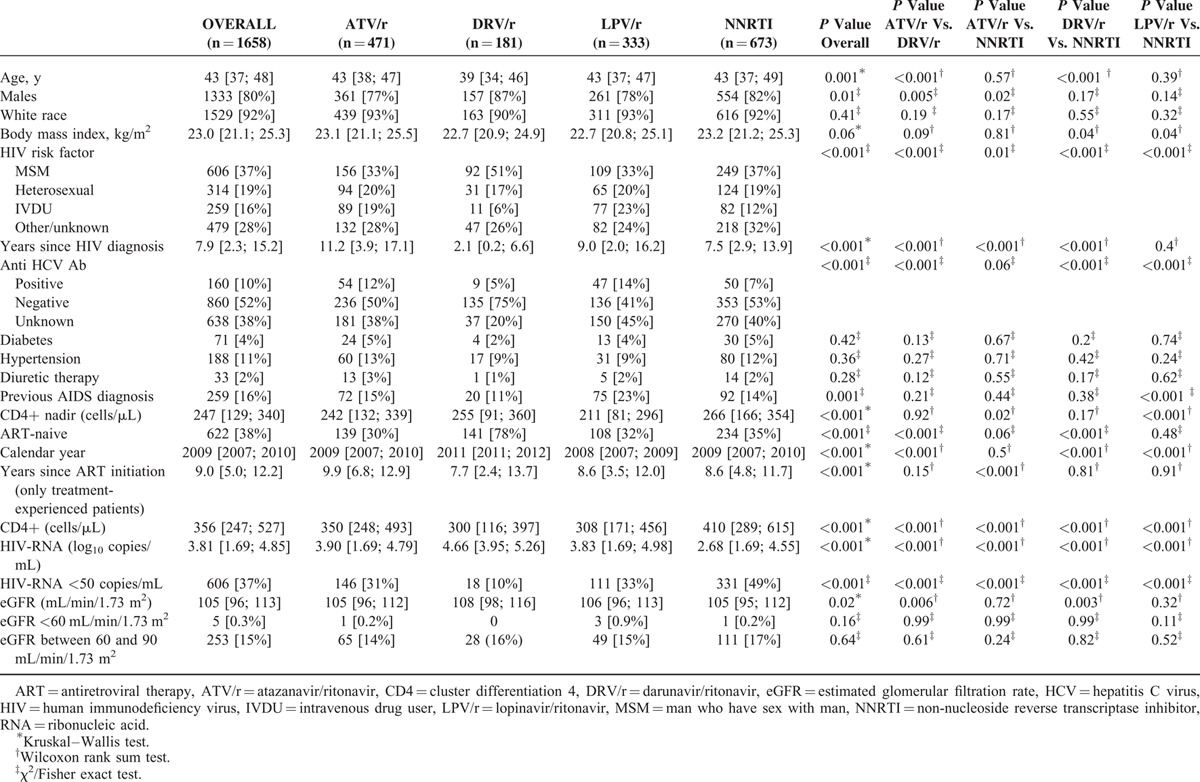
TABLE 2.
Baseline Demographic, Clinical and Laboratory Characteristics of Patients Treated With Abacavir Plus Lamivudine and Either Atazanavir/Ritonavir or Darunavir/Ritonavir or Lopinavir/Ritonavir or a Non-Nucleoside Reverse Transcriptase Inhibitor
Patients Treated With TDF
Among patients treated with TDF (n = 1658), 471 (28%) received also ATV/r, 181 (11%) DRV/r, 333 (20%) LPV/r, and 673 (41%) a NNRTI (584 [87%] EFV, 89 [13%] nevirapine); statistically significant differences in baseline characteristics between these 4 groups were observed with regard to age, gender, BMI, years since HIV diagnosis, coinfection with HCV, previous AIDS diagnosis, nadir and current CD4+ count, ART-naive status, calendar year, HIV-RNA, eGFR; no baseline difference was observed with regard to race, proportion of patients with hypertension or diabetes, on diuretic therapy, and with an eGFR <60 or between 60 and 90 mL/min/1.73 m2 (Table 1).
At the end of follow-up (i.e., stop of any drug of the regimen or lost to follow-up or data freezing [September 2014]), the number of patients on study was 1626 (98% of the 1658 initially included: 12 died and 20 were lost to follow-up, after a median [IQR] follow-up of 2.5 [1.2; 4.6] years). The numbers of patients at the end of the observational period in the different groups were: 462/471, 98% (2 deaths and 7 lost to follow-up), after a median (IQR) follow-up of 2.3 (1.1; 4.3) years in the ATV/r group, 325/333, 98% (3 deaths and 5 lost to follow-up), after a median (IQR) follow-up of 1.9 (0.8; 3.5) years in the LPV/r group, 178/181, 98% (2 deaths and 1 lost to follow-up), after a median (IQR) follow-up of 1.6 (0.9; 2.5) years in the DRV/r group, and 661/673, 98% (5 deaths and 7 lost to follow-up), after a median (IQR) follow-up of 3.7 (1.7; 5.4) years in the NNRTI group.
After a median (IQR) overall follow-up of 2.5 (1.2; 4.6) years (2.3 [1.1; 4.3], 1.6 [0.9; 2.5], 1.9 [0.8; 3.5], and 3.7 [1.7; 5.4] years, in patients treated with ATV/r, DRV/r, LPV/r, and NNRTIs, respectively; P <0.001 for all paired comparisons), a modification of any component of the regimen occurred in 1070 (65%) patients (in 347 [74%], 96 [53%], 291 [87%], and 336 [50%] patients treated with ATV/r, DRV/r, LPV/r, and NNRTIs, respectively; P <0.001 for all paired comparisons). Among patients with modifications in the regimen, eGFR at the time of modification was 102 (88; 111) (100 [84; 110], 106 [90; 114], 101 [89; 109], and 104 [92; 112] mL/min/1.73 m2 in patients treated with ATV/r, DRV/r, LPV/r, and NNRTI, respectively; P = 0.001 and P = 0.03 for the comparison of patients treated with ATV/r vs. NNRTI and for patients treated with LPV/r vs. NNRTI, respectively). The number of eGFR determinations per patient during follow-up was 9 (4; 15) (8 [4; 15], 6 [4; 10], 7 [4; 13], and 11 [6; 16] in patients treated with ATV/r, DRV/r, LPV/r and NNRTI, respectively; P <0.001 for every comparison between each PI/r and NNRTIs and P = 0.003 for the comparison of patients treated with ATV/r vs. those treated with DRV/r).
Crude eGFR slopes (mL/min/1.73 m2 per year) [95% CI] were −0.44 ([−0.65; −0.24] per 10-years older; P <0.0001) for age and −0.38 [−1.08; +0.32] vs. −0.94 [−1.13; −0.75], P = 0.136, for non-white race vs. white race, respectively. Crude eGFR slopes (95% CI) were −1.66 (−2.02; −1.30), −1.11 (−1.92; −0.31), −1.47 (−1.98; −0.96), and −0.39 (−0.65; −0.13) mL/min/1.73 m2 per year in patients treated with ATV/r, DRV/r, LPV/r, and NNRTI, respectively (ATV/r vs. NNRTI: P <0.001; DRV/r vs. NNRTI: P = 0.12; LPV/r vs. NNRTI: P <0.001; no significant differences for other comparisons).
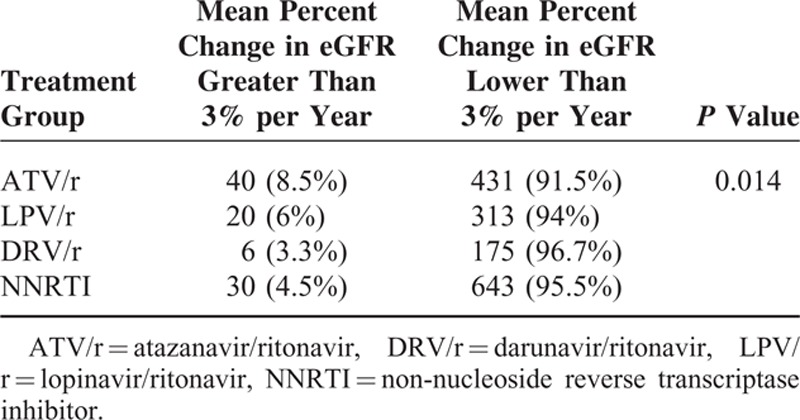
Among the 1658 patients included in this study, 96 (5.8%) had a decline in eGFR ≤3% per year with significant differences among treatment groups (P = 0.014) (Table 3).
TABLE 3.
Proportions of Patients Treated With Tenofovir Plus Emtricitabine or Lamivudine and Either Atazanavir/Ritonavir or Darunavir/Ritonavir or Lopinavir/Ritonavir or a Non-Nucleoside Reverse Transcriptase Inhibitor and With a Change From Baseline in Estimated Glomerular Filtration Rate (eGFR) Lower or Greater Than 3%
Among subjects with a baseline eGFR ≥90 mL/min/1.73 m2, CKD developed in 6 (1.3%), none, 3 (0.9%), and 2 (0.3%) patients treated with ATV/r, DRV/r, LPV/r and NNRTI, respectively. Crude incidence rates (95% CI) of CKD were 4.48 (1.61; 8.78), 3.71 (0.7; 9.09), and 0.81 (0.08; 2.32) per 1000-PYFU in patients treated with ATV/r, LPV/r and NNRTI, respectively (LPV/r vs. ATV/r: P = 0.79; LPV/r vs. NNRTI: P = 0.06; ATV/r vs. NNRTI: P = 0.02).
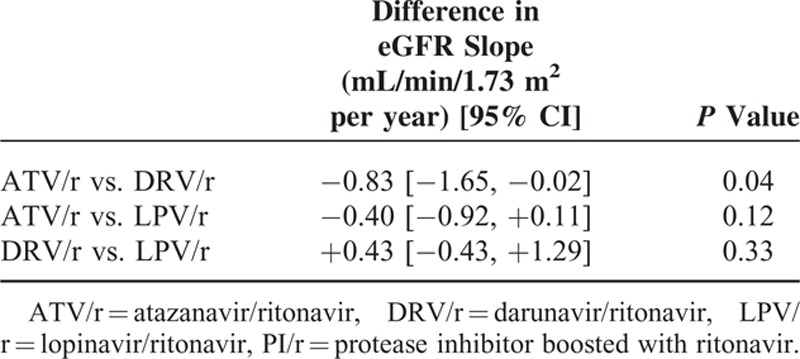
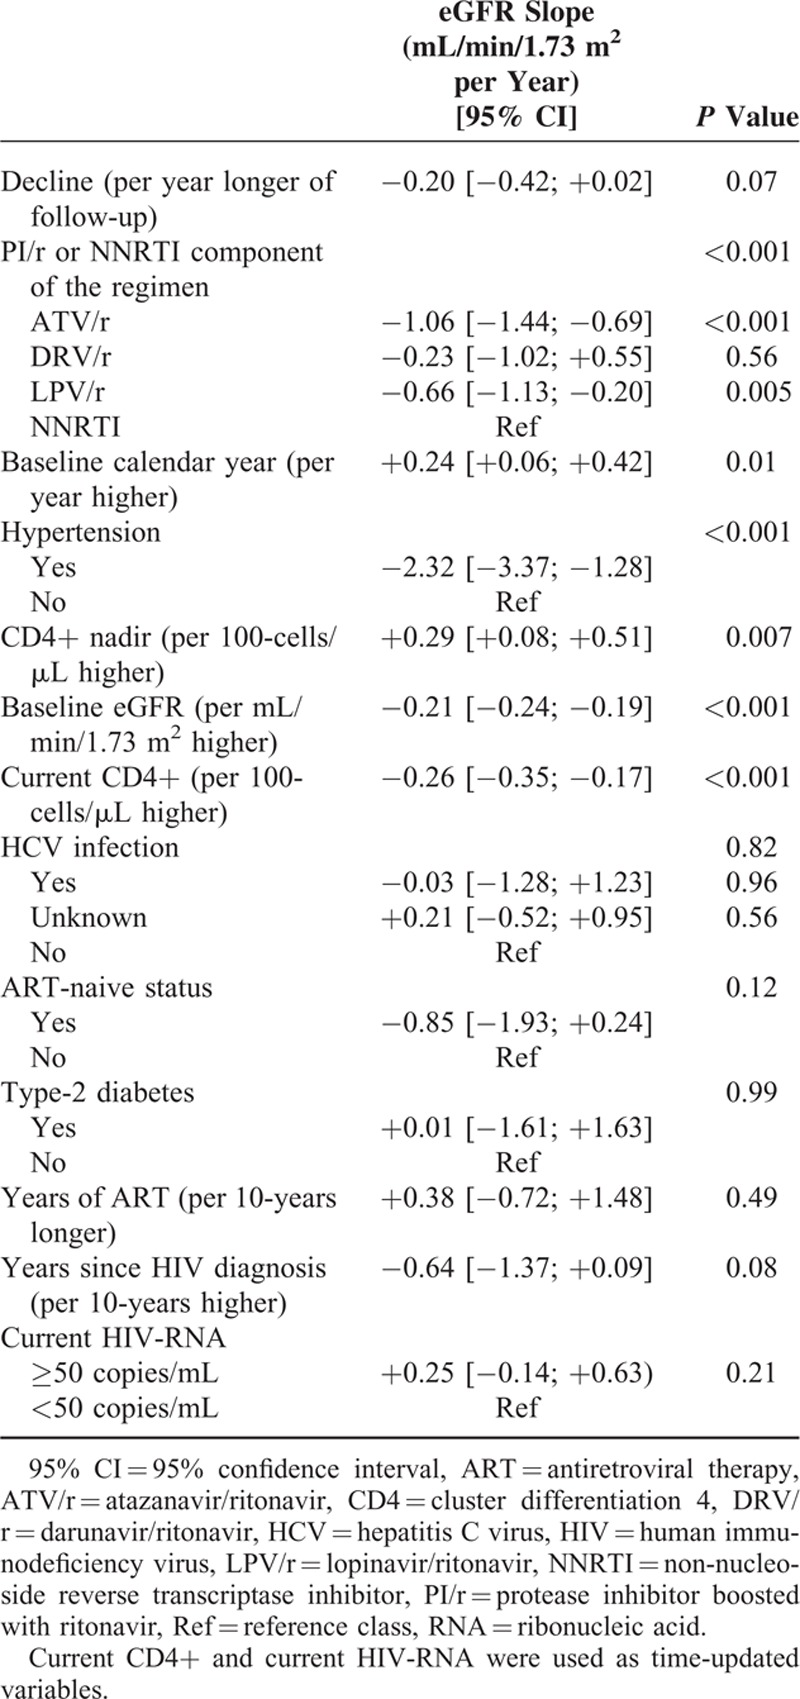
Adjusted eGFR slopes (95% CI) were −1.26 (−1.58; −0.95), −0.43 (−1.20; +0.33), −0.86 (−1.28; −0.44), and −0.20 (−0.42; +0.02) mL/min/1.73 m2 per year in patients treated with ATV/r, DRV/r, LPV/r, and NNRTI, respectively, as shown in Table 4, patients treated with ATV/r or LPV/r had a greater adjusted decline in eGFR compared with those treated with NNRTIs (P <0.001 and P = 0.005, respectively), while patients receiving DRV/r had an adjusted eGFR slope not statistically different from that observed in those receiving NNRTIs. Patients treated with ATV/r had a greater adjusted eGFR decline than those treated with DRV/r (P = 0.04), but not than those treated with LPV/r; no significant statistical difference was observed in adjusted eGFR slopes between patients treated with DRV/r and those treated with LPV/r (Table 4).
TABLE 4.
Multivariate Mixed Linear Model: Differences Between PI/r-Based Regimens in Estimated Glomerular Filtration Rate (eGFR) Changes in Patients Treated With Tenofovir Plus Emtricitabine or Lamivudine and Either Atazanavir/Ritonavir or Darunavir/Ritonavir or Lopinavir/Ritonavir or a Non-Nucleoside Reverse Transcriptase Inhibitor
The multivariate analysis (Table 5) also showed that eGFR slopes were independently associated with the type of ART (P < 0.001), baseline calendar year (P = 0.01), hypertension (P < 0.001), nadir CD4+ cell count (P = 0.007), current CD4+ cell count (P < 0.001), and baseline eGFR (P < 0.001).
TABLE 5.
Multivariate Mixed Linear Model (Including 1635 Patients With 15,229 eGFR Determinations): Estimated Glomerular Filtration Rate (eGFR) Changes in Patients Treated With Tenofovir Plus Emtricitabine or Lamivudine and Either Atazanavir/Ritonavir or Darunavir/Ritonavir or Lopinavir/Ritonavir or a Non-Nucleoside Reverse Transcriptase Inhibitor
Following discontinuation of only the third drug (393/1070 [24%] subjects: 77 [16%] ATV/r, 47 [26%] DRV/r, 128 [38%] LPV/r, 141 [21%] NNRTI), over a median follow-up of 1.13 (0.45–2.53) years, the mean eGFR increased for patients who discontinued ATV/r [mean slope (95% CI): +0.57 (−0.57; +1.71) mL/min/1.73 m2 per year] and among patients who discontinued DRV/r [mean slope (95% CI): +1.36 (−0.57; +3.29) mL/min/1.73 m2 per year] while eGFR declines were observed for patients who discontinued either LPV/r [mean slope (95% CI): −0.82 (−1.40; −0.24) mL/min/1.73 m2 per year] or NNRTI [mean slope (95% CI): −0.50 (−1.36; +0.35) mL/min/1.73 m2 per year].
Following discontinuation of only TDF (244/1070 [23%] subjects: 91 [19%] ATV/r, 20 [11%] DRV/r, 73 [22%] LPV/r, 40 [6%] NNRTI, and 20 patients were lost to follow-up), over a median follow-up of 1.13 (0.45–2.53) years, the mean eGFR increased for patients treated with ATV/r [mean slope (95% CI): +1.28 (+0.32; +2.24) mL/min/1.73 m2 per year], among patients treated with DRV/r [mean slope (95% CI): +6.96 (+3.79; +10.13) mL/min/1.73 m2 per year] and among patients treated with NNRTI [mean slope (95% CI): +1.39 (+0.14; +2.64) mL/min/1.73 m2 per year] while an eGFR decline, not statistically significant, was observed for patients treated with LPV/r [mean slope (95% CI): −0.07 (−0.99; +0.86) mL/min/1.73 m2 per year].
Patients Treated With ABC
Among patients treated with ABC (n = 286), statistically significant differences in baseline characteristics between these groups were observed with regard to BMI, HIV risk factor, previous AIDS diagnosis, nadir and current CD4+ count, ART-naive status, calendar year, years since ART initiation, HIV-RNA, proportion of subjects with undetectable viral load and eGFR (Table 2).
At the end of follow-up (i.e., stop of any drug of the regimen or lost to follow-up or data freezing [September 2014]), the number of patients in each treatment group was 280 (98% of the 286 initially included: 4 died and 2 were lost to follow-up, after a median (IQR) follow-up of 2.5 (1.2; 4.9) years. The numbers of patients at the end of the observational period in the different groups were: 90/90, 100% (no deaths or lost to follow-up), after a median (IQR) follow-up of 2.8 (1.3; 4.9) years in the ATV/r group, 55/55, 100% (no deaths or lost to follow-up), after a median (IQR) follow-up of 1.5 (1.0; 2.0) years in the LPV/r group, 25/25, 100% (no deaths or lost to follow-up), after a median (IQR) follow-up of 1.8 (0.7; 4.2) years in the DRV/r group and 110/116, 95% (4 deaths and 2 lost to follow-up), after a median (IQR) follow-up of 3.4 (1.3; 5.9) years in the NNRTI group.
After a median (IQR) follow-up of 2.5 (1.2; 4.9) years (2.8 [1.3; 4.9], 1.5 [1.0; 2.0], 1.8 [0.7; 4.2], and 3.4 [1.3; 5.9] years, in patients treated with ATV/r, DRV/r, LPV/r, and NNRTIs, respectively; P = 0.001 for ATV/r vs. DRV/r, P = 0.26 for ATV/r vs. NNRTI, P < 0.001 for DRV/r vs. NNRTI, P = 0.003 for LPV/r vs. NNRTI), a modification of any component of the regimen occurred in 177 (62%) patients (in 56 [62%], 16 [64%], 49 [89%], and 56 [48%] patients treated with ATV/r, DRV/r, LPV/r and NNRTIs, respectively; P < 0.001 for the comparison LPV/r vs. NNRTI; no significant differences for other comparisons between regimens). Among patients with modifications in the regimen, eGFR at the time of modification was 99 (84; 111) (99 [86; 112], 105 [97; 114], 97 [90; 106], and 99 [83; 111] mL/min/1.73 m2 in patients treated with ATV/r, DRV/r, LPV/r and NNRTI, respectively; no significant differences for all comparisons between regimens).
The number of eGFR determinations per patient during follow-up was 8 (3; 16) (8 [4; 17], 4 [3; 7], 7 [3; 16], and 11 [3; 17] in patients treated with ATV/r, DRV/r, LPV/r, and NNRTI, respectively; P = 0.002 for the comparisons ATV/r vs. DRV/r and DRV/r vs. NNRTI, no significant differences for other comparisons between regimens).
Crude eGFR slopes (95% CI) were +0.41 (−0.25; +1.06), +1.45 (−1.07; +3.97), −0.14 (−1.06; +0.79), and +0.004 (−0.53; +0.54) mL/min/1.73 m2 per year for ATV/r, DRV/r, LPV/r, and NNRTI, respectively. Based on 2406 eGFR determinations, adjusted eGFR slopes (95% CI) were +0.54 (−0.08; +1.16), +2.09 (−0.03; +4.21), +0.07 (−0.77; +0.91), and +0.33 (−0.17; +0.82) mL/min/1.73 m2 per year for ATV/r, DRV/r, LPV/r, and NNRTI, respectively, with no significant differences among groups (ATV/r vs. DRV/r: P = 0.16; ATV/r vs. LPV/r: P = 0.36; DRV/r vs. LPV/r: P = 0.08).
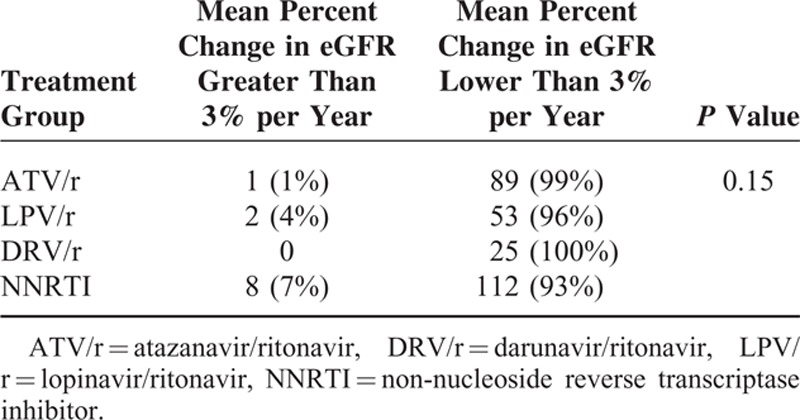
Among the 286 patients included in this study, 11 (4%) had a decline in eGFR ≤3% per year without significant differences among treatment groups (P = 0.150) (Table 6).
TABLE 6.
Proportions of Patients Treated With Abacavir Plus Lamivudine and Either Atazanavir/Ritonavir or Darunavir/Ritonavir or Lopinavir/Ritonavir or a Non-Nucleoside Reverse Transcriptase Inhibitor and With a Change From Baseline in Estimated Glomerular Filtration Rate (eGFR) Lower or Greater Than 3%
Among subjects with a baseline eGFR ≥90 mL/min/1.73 m2, 3 of 208 (1.4%) patients treated with NNRTI developed CKD (crude incidence rate [95% CI]: 9.87 [1.86; 24.2] per 1000-PYFU) and none in patients treated with PIs/r.
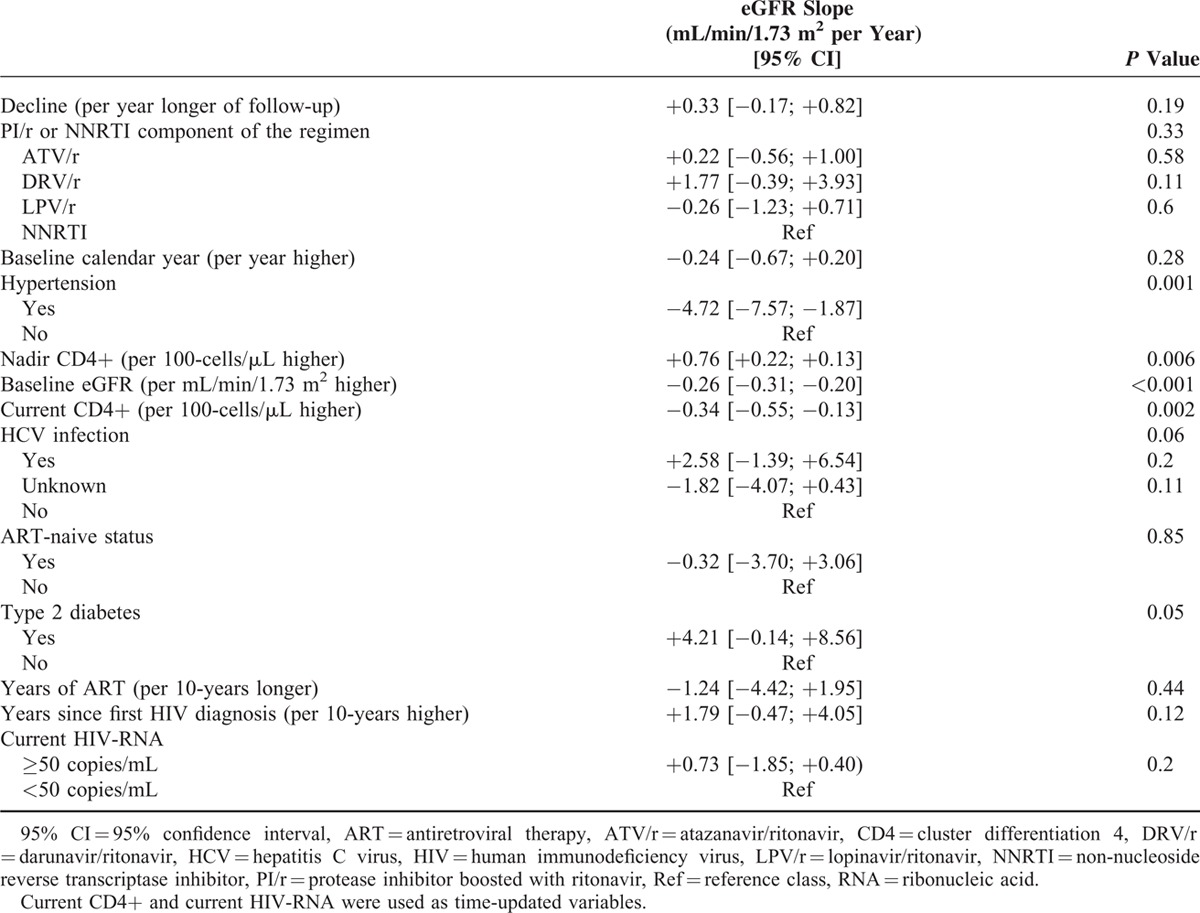
Results of the multivariate mixed linear model are shown in Tables 7 and 8.
TABLE 7.
Multivariate Mixed Linear Model: Differences Between Pi/r-Based Regimens in Estimated Glomerular Filtration Rate (eGFR) Changes in Patients Treated With Abacavir Plus Lamivudine and Either Atazanavir/Ritonavir or Darunavir/Ritonavir or Lopinavir/Ritonavir or a Non-Nucleoside Reverse Transcriptase Inhibitor
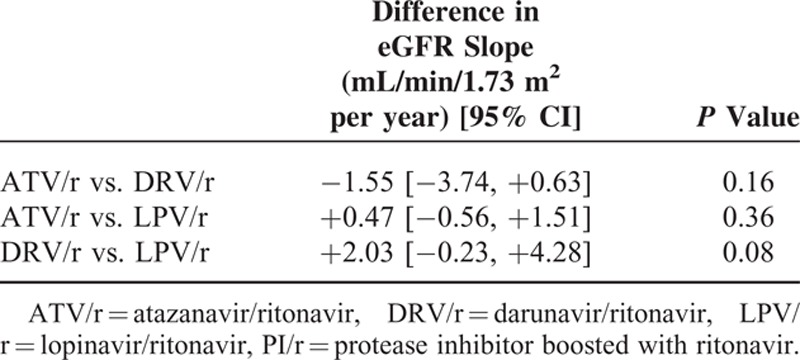
TABLE 8.
Multivariate Mixed Linear Model: Estimated Glomerular Filtration Rate (eGFR) Changes in Patients Treated With Abacavir Plus Lamivudine and Either Atazanavir/Ritonavir or Darunavir/Ritonavir or Lopinavir/Ritonavir or a Non-Nucleoside Reverse Transcriptase Inhibitor
DISCUSSION
Known factors associated with an increased risk of CKD in HIV-infected individuals include older age, female sex, diabetes, hypertension, injection drug use, coinfection with HCV, lower CD4+ cell count, specific antiretroviral drugs (including TDF, particularly when associated with a PI/r, such as ATV/r, LPV/r or indinavir), history of acute kidney injury, higher HIV-RNA level.13,35,36 To the best of our knowledge, our study is the first investigating eGFR trajectories with different antiretrovirals and, specifically, with DRV/r; thus a direct comparison between our results and those from previous studies having the development of CDK as end-point is difficult. Nonetheless, our findings seem consistent with those of the studies mentioned above: we found that, in patients treated with TDF, a more rapid eGFR decline was independently associated with the use of ATV/r and of LPV/r and also with hypertension, lower nadir CD4+ cell counts, and higher baseline eGFR. However, we also observed an independent association between eGFR decline and current CD4+ cell counts and baseline calendar years. In the D:A:D: cohort, advanced CKD/end-stage renal disease (ESRD) was independently associated with lower current CD4+ cell count (1.37 [95% CI, 1.19–1.56]/halving).37 Similarly, in the NA-ACCORD cohort, in which black race accounts for roughly one-third of enrolled patients, higher baseline CD4+ counts were independently associated with a lower incident rate ratio of ESRD.38 In both these studies, however, one-third of patients not receiving ART and eGFR slopes were not evaluated: the apparent inconsistency between these previous and our finding may thus be due to differences in study designs, end-points, and study populations. Finally, it must be underlined that, in our study, patients treated with DRV/r had a more recent baseline and lower baseline CD4+ counts: thus, the effect of current CD4+ counts and calendar year on eGFR slopes may be, at least in part, driven by the PI/r received.
Ryom et al37 found no consistent or significant associations between current or previous use of any antiretroviral and advanced CKD/ESRD. However, this lack of association has not been confirmed in a subsequent analysis of data collected by the same cohort23 and, using data from multiple cohorts, the same authors were able to confirm the association between use of certain antiretroviral drugs and the development of CKD.36 Our result may help in explaining how a cumulative exposure to ATV/r and LPV/r leads to an increased and cumulative risk of CKD.23
Not surprisingly, and on par with other cohort studies that found an independent association between pre-existing renal impairment and CKD,37,39–42 we observed a more rapid decline of eGFR in patients with lower baseline eGFR.
Changes in eGFR and creatinine clearance in patients treated with a PI/r may be in part due to the known inhibitory effect of RTV on tubular creatinine secretion via multidrug and toxin extrusion 1 (MATE1) complex.43,44 Data from in vitro experiments suggest that RTV has minimal effect on multidrug resistance protein 4 (MRP4), the apical tubular tenofovir (TFV) transporter.45 However, increased tubular TFV exposure may result from the inhibitory effect of RTV on the P-glycoprotein (P-gp).46 In patients treated with LPV/r, plasma exposure to TFV was increased by 50% and the intracellular TFV-diphosphate (DP) AUC(0–4) was increased by 59%, with respect to those receiving nevirapine;47 it has been hypothesized that this finding is the consequence of an increased absorption of TDF.48 LPV/r has been also shown to reduce TFV renal clearance by 17.5%,49 but this might simply reflect the effect of RTV rather than that of LPV.44 It remains unclear whether LPV/r has intrinsic nephrotoxic properties or whether LPV/r merely enhances the nephrotoxicity of TDF,44 but it should be noted that in the D:A:D: cohort the use of LPV/r was associated with a greater risk of CKD independent of the use of TDF19,23 and that HIV-infected women taking TDF and LPV/r had significantly more renal events compared with those treated with TDF and NVP.42
When TFV-DP concentrations within peripheral blood mononuclear cells were compared among individuals receiving either ATV/r or DRV/r-based regimens, there was a trend toward higher TFV-DP concentrations among women and participants receiving ATV/r.50 ATV/r has been associated with increased risks of reduced GFR, nephrolithiasis, proximal tubular dysfunction, interstitial nephritis, and acute kidney injury, independent of concurrent TDF use.13,19,20,31,36,51–54 Renal function changes significantly improved (or declined less) with EFV-including regimens compared with ATV/r-including regimens in the A5202 Study (in which treatment-naive patients were randomized to ABC/3TC or TDF/FTC with open-label ATV/r or EFV), independent of the backbone.55 Thus, the association of ATV/r and TDF may be particularly at risk for kidney because of cumulative or synergistic toxicity, which may explain the faster decline in eGFR that we observed in patients treated with these 2 drugs. The characteristics of our study do not allow us to speculate further on this issue. However, it seems unlikely that the greater decrease in eGFR that we observed in patients receiving ATV/r was merely due to an enhanced TDF toxicity, linked to an increase in TFV concentrations in tubular cells due to the coadministration of RTV: if this would be true, we should have observed similar eGFR slopes in patients treated with DRV/r. It seems unlikely as well that the greater decrease in eGFR that we observed in patients receiving ATV/r was due solely to the inhibition of the tubular secretion of creatinine caused by RTV;43 again, if this was the only explanation we should have observed a similar eGFR decrease in patients treated with DRV/r (and even more with LPV/r, due to the 2-fold RTV dose prescribed). Furthermore, it has been observed that eGFR improved less in patients randomized to first-line ATV/r + TDF/FTC than in those randomized to other regimens when it was estimated by cystatin C-based equations, suggesting that ATV/r likely has an effect on eGFR independent of any possible serum creatinine increase due simply to MATE1 inhibition.55
An enhanced TDF toxicity might in part explain differences in eGFR slopes between patients who received LPV/r and those treated with DRV/r, because the dose of RTV for the former is 2-fold compared with the latter.
Darunavir was not included (or not specifically mentioned23,36) in previous large analyses on the relationship between antiretroviral use and changes in eGFR or the development of CKD.18,20 To our knowledge, our study is the first investigating specifically the impact of DRV/r on the kidney and suggests that, like NNRTIs (and differently from other PI/s), DRV/r has minimal (if any) impact on kidney function.
A new prodrug of tenofovir (tenofovir alafenamide—TAF), which yields lower plasma concentrations of TFV, will be soon available.56 Patients treated with elvitegravir/cobicistat/FTC/TAF had fewer renal adverse event-related discontinuations (none with TAF regimen), significantly smaller decreases in eGFR, and significantly less proteinuria and tubulopathy than those treated with elvitegravir/cobicistat/FTC/TDF.57 This suggests that TAF has less renal toxicity compared with TDF; however, we cannot anticipate if the differences that we observed between studied PIs/r would persist when TDF will be substituted with TAF.
Contrary to what we found in patients treated with TDF, in those receiving ABC we did not observe differences in eGFR slopes between PIs/r. This might mean that different impacts of PIs/r on eGFR are evident only when TDF is coadministrated, because of a synergistic renal toxicity; however, we cannot exclude that we did not have sufficient statistical power to elicit differences between PIs/r in this group of patients. Indeed, among treatment-naive patients randomized to start their first-line regimen with ATV/r plus TDF and FTC or ATV/r plus ABC and 3TC, those starting TDF showed a reduction in eGFR both at weeks 48 and 96, while those starting ABC showed an increase in eGFR both at weeks 48 and 96.33 In a substudy, no difference was observed between ATV/r and EFV in patients randomized to ABC/3TC.55 Altogether, these findings suggest that the more rapid decline in eGFR observed in patients treated with ATV/r and TDF is due to an enhanced toxicity of TDF by ATV/r (and possibly to a “synergistic” toxicity of these 2 drugs) rather than a predominant kidney toxicity of ATV/r.
The main limitation of our study is its retrospective design. Although we tried to correct for all measurable confounders, we cannot exclude that some unknown or unmeasured confounding still remained. A further limit is the relatively small sample size of the group treated with ABC-based regimens. However, as ABC is currently recommended by most recent guidelines only in combination with dolutegravir,2,4 for patients treated with a PI/r the main clinical concern is the association with TDF.
We were unable to assess the influence of some potential and relatively common causes of progressive impaired renal function, such as renal artery stenosis, nephrolithiasis, lupus erythematosus, abuse of non-steroidal anti-inflammatory drugs, as such conditions were not systematically investigated. Furthermore, not all patients had regular proteinuria measurement: thus, we were not able to assess whether there are different risks of tubulopathy with different PI/r.
To conclude, among patients receiving TDF (and FTC or 3TC), declines in eGFR trajectories were small for all regimens, but smaller in those receiving DRV/r or NNRTIs than in those treated with ATV/r or LPV/r. eGFR trajectories in patients treated with DRV/r plus TDF and FTC or 3TC were not statistically different from those observed in patients receiving a NNRTI plus TDF and FTC or 3TC. In patients receiving ABC/3TC, no between regimen differences were observed.
Footnotes
Abbreviations: 3TC = lamivudine, ABC = abacavir, AIDS = acquired immune deficiency syndrome, ART = antiretroviral therapy, ATV/r = atazanavir boosted with ritonavir, AUC = area under the curve, BMI = body mass index, CD4 = cluster differentiation 4, CKD = chronic kidney disease, CKD-EPI = chronic kidney disease epidemiology collaboration equation, DRV/r = Darunavir boosted with ritonavir, EFV = Efavirenz, eGFR = estimated glomerular filtration rate, ESRD = end-stage renal disease, FTC = Emtricitabine, HCV = hepatitis C virus, HIV = human immunodeficiency virus, IDD-HSR = Infectious Diseases Department of the San Raffaele Hospital, IQR = interquartile range, LPV/r = Lopinavir boosted with ritonavir, MATE1 = Multidrug and Toxin Estrusion 1, MLM = mixed linear model, MRP4 = multidrug resistance protein 4, NNRTI = non-nucleoside reverse transcriptase inhibitor, P-gp = P-glycoprotein, PI = protease inhibitor, PYFU = person-years of follow-up, RNA = ribonucleic acid, TAF = Tenofovir Alafenamide, TDF = tenofovir disoproxil fumarate, TFV = Tenofovir, xTC = Lamivudine or Emtricitabine.
NG has been an advisor for Gilead Sciences, AbbVie, and Janssen-Cilag and has received speakers’ honoraria from Gilead Sciences, ViiV, Bristol-Myers Squibb, Merck Sharp and Dohme, Roche, AbbVie, Boehringer Ingelheim, and Janssen-Cilag.
SN has received consultancy payments and speaking fee from Bristol-Myers Squibb, Gilead, ViiV Health Care, Merck Sharp & Dohme.
AC has received consultancy payments and speaking fee from Bristol-Myers Squibb, Gilead, ViiV Health Care, Merck Sharp & Dohme, Janssen-Cilag.
AL has received consultancy payments and speaking fee from Bristol-Myers Squibb, Gilead Sciences, ViiV Health Care, Merck Sharp & Dohme, ABBvie, Janssen-Cilag.
For the remaining authors none were declared.
This research was realized by an unrestricted support from Janssen-Cilag Spa, Cologno Monzese, Italy. The authors maintained independent scientific control over this research project, including data analysis and interpretation of final results. Study data were obtained during the course of routine clinical practice.
The results of this study have been presented in part at the 19th Workshop on HIV Observational Databases (IWHOD), March 26–28, 2015, Catania, Italy, Abstract 23 and at the Italian Conference on AIDS and Retroviruses, May 17–19, 2015, Riccione, Italy Abstract OC 70.
The authors have no conflicts of interest to disclose.
REFERENCES
- 1.HIV/AIDS Italian Expert Panel. Italian Guidelines on the use of antiretroviral drugs and on the clinical and diagnostics management of persons living with HIV; December 18, 2014. Available at: http://www.salute.gov.it/portale/temi/p2_6.jsp?lingua=italiano&id=187&area=aids&menu=vuoto (accessed November 30, 2015). [Google Scholar]
- 2.European AIDS Clinical Society. European Guidelines for treatment of HIV-infected adults in Europe, Version 8.0, October 2015, Available at: http://www.eacsociety.org/guidelines/eacs-guidelines/eacs-guidelines.html (accessed November 30, 2015) [Google Scholar]
- 3.Günthard HF, Aberg JA, Eron JJ, et al. Antiretroviral treatment of adult HIV infection: 2014 recommendations of the International Antiviral Society-USA Panel. JAMA 2014; 312:410–425. [DOI] [PubMed] [Google Scholar]
- 4.Panel on Antiretroviral Guidelines for Adults and Adolescents. Guidelines for the use of antiretroviral agents in HIV-1-infected adults and adolescents. Department of Health and Human Services. Available at: http://www.aidsinfo.nih.gov/ContentFiles/AdultandAdolescentGL.pdf (accessed November 30, 2015) [Google Scholar]
- 5.Labarga P, Barreiro P, Martin-Carbonero L, et al. Kidney tubular abnormalities in the absence of impaired glomerular function in HIV patients treated with tenofovir. AIDS 2009; 23:689–696. [DOI] [PubMed] [Google Scholar]
- 6.Herlitz LC, Mohan S, Stokes MB, et al. Tenofovir nephrotoxicity: acute tubular necrosis with distinctive clinical, pathological, and mitochondrial abnormalities. Kidney Int 2010; 78:1171–1177. [DOI] [PubMed] [Google Scholar]
- 7.Karras A, Lafaurie M, Furco A, et al. Tenofovir-related nephrotoxicity in human immunodeficiency virus-infected patients: three cases of renal failure, Fanconi syndrome, and nephrogenic diabetes insipidus. Clin Infect Dis 2003; 36:1070–1073. [DOI] [PubMed] [Google Scholar]
- 8.Gallant JE, Parish MA, Keruly JC, et al. Changes in renal function associated with tenofovir disoproxil fumarate treatment, compared with nucleoside reverse-transcriptase inhibitor treatment. Clin Infect Dis 2005; 40:1194–1198. [DOI] [PubMed] [Google Scholar]
- 9.Gallant JE, Winston JA, DeJesus E, et al. The 3-year renal safety of a tenofovir disoproxil fumarate vs. a thymidine analogue-containing regimen in antiretroviral-naive patients. AIDS 2008; 22:2155–2163. [DOI] [PubMed] [Google Scholar]
- 10.Horberg M, Tang B, Towner W, et al. Impact of tenofovir on renal function in HIV-infected, antiretroviral-naive patients. J Acquir Immune Defic Syndr 2010; 53:62–69. [DOI] [PubMed] [Google Scholar]
- 11.Fux CA, Simcock M, Wolbers M, et al. Tenofovir use is associated with a reduction in calculated glomerular filtration rates in the Swiss HIV Cohort Study. Antivir Ther 2007; 12:1165–1173. [PubMed] [Google Scholar]
- 12.Cooper RD, Wiebe N, Smith N, et al. Systematic review and meta-analysis: renal safety of tenofovir disoproxil fumarate in HIV-infected patients. Clin Infect Dis 2010; 51:496–505. [DOI] [PubMed] [Google Scholar]
- 13.Rasch MG, Engsig FN, Feldt-Rasmussen B, et al. Renal function and incidence of chronic kidney disease in HIV patients: a Danish cohort study. Scand J Infect Dis 2012; 44:689–696. [DOI] [PubMed] [Google Scholar]
- 14.Jose S, Hamzah L, Campbell LJ, et al. Incomplete reversibility of estimated glomerular filtration rate decline following tenofovir disoproxil fumarate exposure. J Infect Dis 2014; 210:363–373. [DOI] [PMC free article] [PubMed] [Google Scholar]
- 15.Mulenga L, Musonda P, Mwango A, et al. Effect of baseline renal function on tenofovir-containing antiretroviral therapy outcomes in Zambia. Clin Infect Dis 2014; 58:1473–1480. [DOI] [PMC free article] [PubMed] [Google Scholar]
- 16.Mocroft A, Kirk O, Gatell J, et al. Chronic renal failure among HIV-1-infected patients. AIDS 2007; 21:1119–1127. [DOI] [PubMed] [Google Scholar]
- 17.Kalayjian RC, Lau B, Mechekano RN, et al. Risk factors for chronic kidney disease in a large cohort of HIV-1 infected individuals initiating antiretroviral therapy in routine care. AIDS 2012; 26:1907–1915. [DOI] [PMC free article] [PubMed] [Google Scholar]
- 18.Scherzer R, Estrella M, Li Y, et al. Association of tenofovir exposure with kidney disease risk in HIV infection. AIDS 2012; 26:867–875. [DOI] [PMC free article] [PubMed] [Google Scholar]
- 19.Ryom L, Mocroft A, Kirk O, et al. Association between antiretroviral exposure and renal impairment among HIV-positive persons with normal baseline renal function: the D:A:D study. J Infect Dis 2013; 207:1359–1369. [DOI] [PMC free article] [PubMed] [Google Scholar]
- 20.Mocroft A, Kirk O, Reiss P, et al. Estimated glomerular filtration rate, chronic kidney disease and antiretroviral drug use in HIV-positive patients. AIDS 2010; 24:1667–1678. [DOI] [PubMed] [Google Scholar]
- 21.Flandre P, Pugliese P, Cuzin L, et al. Risk factors of chronic kidney disease in HIV-infected patients. Clin J Am Soc Nephrol 2011; 6:1700–1707. [DOI] [PubMed] [Google Scholar]
- 22.Laprise C, Baril JG, Dufresne S, et al. Association between tenofovir exposure and reduced kidney function in a cohort of HIV-positive patients: results from 10 years of follow-up. Clin Infect Dis 2013; 56:567–575. [DOI] [PubMed] [Google Scholar]
- 23.Mocroft A, Lundgren JD, Ross M, et al. Cumulative and current exposure to potentially nephrotoxic antiretrovirals and development of chronic kidney disease in HIV-positive individuals with a normal baseline estimated glomerular filtration rate: a prospective international cohort study. Lancet HIV 2016; 3:e23–e32. [DOI] [PubMed] [Google Scholar]
- 24.Goicoechea M, Liu S, Best B, et al. Greater tenofovir-associated renal function decline with protease inhibitor-based versus nonnucleoside reverse-transcriptase inhibitor-based therapy. J Infect Dis 2008; 197:102–108. [DOI] [PubMed] [Google Scholar]
- 25.Kiser JJ, Carten ML, Aquilante CL, et al. The effect of lopinavir/ritonavir on the renal clearance of tenofovir in HIV-infected patients. Clin Pharmacol Ther 2008; 83:265–272. [DOI] [PubMed] [Google Scholar]
- 26.Gallant JE, Moore RD. Renal function with use of a tenofovir-containing initial antiretroviral regimen. AIDS 2009; 23:1971–1975. [DOI] [PMC free article] [PubMed] [Google Scholar]
- 27.Tordato F, Cozzi Lepri A, Cicconi P, et al. Evaluation of glomerular filtration rate in HIV-1-infected patients before and after combined antiretroviral therapy exposure. HIV Med 2011; 12:4–13. [DOI] [PubMed] [Google Scholar]
- 28.Déti EK, Thiébaut R, Bonnet F, et al. Prevalence and factors associated with renal impairment in HIV-infected patients, ANRS C03 Aquitaine Cohort, France. HIV Med 2010; 11:308–317. [DOI] [PubMed] [Google Scholar]
- 29.Overton ET, Nurutdinova D, Freeman J, et al. Factors associated with renal dysfunction within an urban HIV-infected cohort in the era of highly active antiretroviral therapy. HIV Med 2009; 10:343–350. [DOI] [PMC free article] [PubMed] [Google Scholar]
- 30.Young J, Schäfer J, Fux CA, et al. Renal function in patients with HIV starting therapy with tenofovir and either efavirenz, lopinavir or atazanavir. AIDS 2012; 26:567–575. [DOI] [PubMed] [Google Scholar]
- 31.Daar ES, Tierney C, Fischl MA, et al. Atazanavir plus ritonavir or efavirenz as part of a 3-drug regimen for initial treatment of HIV-1. Ann Intern Med 2011; 154:445–456. [DOI] [PMC free article] [PubMed] [Google Scholar]
- 32.Sax PE, Tierney C, Collier AC, et al. Abacavir/lamivudine versus tenofovir DF/emtricitabine as part of combination regimens for initial treatment of HIV: final results. J Infect Dis 2011; 204:1191–1201. [DOI] [PMC free article] [PubMed] [Google Scholar]
- 33.Albini L, Cesana BM, Motta D, et al. A randomized, pilot trial to evaluate glomerular filtration rate by creatinine or cystatin C in naive HIV-infected patients after tenofovir/emtricitabine in combination with atazanavir/ritonavir or efavirenz. J Acquir Immune Defic Syndr 2012; 59:18–30. [DOI] [PubMed] [Google Scholar]
- 34.Levey AS, Bosch JP, Lewis JB, et al. A more accurate method to estimate glomerular filtration rate from serum creatinine: a new prediction equation. Modification of Diet in Renal Disease Study Group. Ann Intern Med 1999; 130:461–470. [DOI] [PubMed] [Google Scholar]
- 35.Lucas GM, Ross MJ, Stock PG, et al. Clinical practice guideline for the management of chronic kidney disease in patients infected with HIV: 2014 update by the HIV Medicine Association of the Infectious Diseases Society of America. Clin Infect Dis 2014; 59:e96–e138. [DOI] [PMC free article] [PubMed] [Google Scholar]
- 36.Mocroft A, Lundgren JD, Ross M, et al. Development and validation of a risk score for chronic kidney disease in HIV infection using prospective cohort data from the D:A:D study. PLoS Med 2015; 12:e1001809. [DOI] [PMC free article] [PubMed] [Google Scholar]
- 37.Ryom L, Mocroft A, Kirk O, et al. Predictors of advanced chronic kidney disease and end-stage renal disease in HIV-positive persons. AIDS 2014; 28:187–199. [DOI] [PubMed] [Google Scholar]
- 38.Abraham AG, Althoff KN, Jing Y, et al. End-stage renal disease among HIV-infected adults in North America. Clin Infect Dis 2015; 60:941–949. [DOI] [PMC free article] [PubMed] [Google Scholar]
- 39.Ryom L, Kirk O, Lundgren JD, et al. Advanced chronic kidney disease, end-stage renal disease and renal death among HIV-positive individuals in Europe. HIV Med 2013; 14:503–508. [DOI] [PubMed] [Google Scholar]
- 40.De Wit S, Sabin CA, Weber R, et al. Incidence and risk factors for new-onset diabetes in HIV-infected patients: the Data Collection on Adverse Events of Anti-HIV Drugs (D:A:D) study. Diabetes Care 2008; 31:1224–1229. [DOI] [PMC free article] [PubMed] [Google Scholar]
- 41.Jotwani V, Li Y, Grunfeld C, et al. Risk factors for ESRD in HIV-infected individuals: traditional and HIV-related factors. Am J Kidney Dis 2012; 59:628–635. [DOI] [PMC free article] [PubMed] [Google Scholar]
- 42.Mwafongo A, Nkanaunena K, Zheng Y, et al. Renal events among women treated with tenofovir/emtricitabine in combination with either lopinavir/ritonavir or nevirapine. AIDS 2014; 28:1135–1142. [DOI] [PMC free article] [PubMed] [Google Scholar]
- 43.Lepist EI, Zhang X, Hao J, et al. Contribution of the organic anion transporter OAT2 to the renal active tubular secretion of creatinine and mechanism for serum creatinine elevations caused by cobicistat. Kidney Int 2014; 86:350–357. [DOI] [PMC free article] [PubMed] [Google Scholar]
- 44.Yombi JC, Pozniak A, Boffito M, et al. Antiretrovirals and the kidney in current clinical practice: renal pharmacokinetics, alterations of renal function and renal toxicity. AIDS 2014; 28:621–632. [DOI] [PubMed] [Google Scholar]
- 45.Cihlar T, Ray AS, Laflamme G, et al. Molecular assessment of the potential for renal drug interactions between tenofovir and HIV protease inhibitors. Antivir Ther 2007; 12:267–272. [PubMed] [Google Scholar]
- 46.Lee CG, Gottesman MM, Cardarelli CO, et al. HIV-1 protease inhibitors are substrates for the MDR1 multidrug transporter. Biochemistry 1998; 37:3594–3601. [DOI] [PubMed] [Google Scholar]
- 47.Pruvost A, Negredo E, Théodoro F, et al. Pilot pharmacokinetic study of human immunodeficiency virus-infected patients receiving tenofovir disoproxil fumarate (TDF): investigation of systemic and intracellular interactions between TDF and abacavir, lamivudine, or lopinavir-ritonavir. Antimicrob Agents Chemother 2009; 53:1937–1943. [DOI] [PMC free article] [PubMed] [Google Scholar]
- 48.Kearney BP, Mathias A, Mittan A, et al. Pharmacokinetics and safety of tenofovir disoproxil fumarate on coadministration with lopinavir/ritonavir. J Acquir Immune Defic Syndr 2006; 43:278–283. [DOI] [PubMed] [Google Scholar]
- 49.Lepist EI, Murray BL, Tong L, et al. Effect of cobicistat and ritonavir on proximal renal tubular cell uptake and efflux transporters. In: Program and abstracts of the 51st Interscience Conference on Antimicrobial Agents and Chemotherapy (Chicago). 2011; Washington, DC: American Society for Microbiology, (ICAAC 2011). Chicago, September 17–20, 2011 Abstract A1-1724. [Google Scholar]
- 50.Lahiri CD, Tao S, Jiang Y, et al. Impact of protease inhibitors on intracellular concentration of tenofovir-diphosphate among HIV-1 infected patients. AIDS 2015; 29:1113–1115. [DOI] [PMC free article] [PubMed] [Google Scholar]
- 51.Dauchy FA, Lawson-Ayayi S, de La Faille R, et al. Increased risk of abnormal proximal renal tubular function with HIV infection and antiretroviral therapy. Kidney Int 2011; 80:302–309. [DOI] [PubMed] [Google Scholar]
- 52.Rockwood N, Mandalia S, Bower M, et al. Ritonavir-boosted atazanavir exposure is associated with an increased rate of renal stones compared with efavirenz, ritonavir-boosted lopinavir and ritonavir-boosted darunavir. AIDS 2011; 25:1671–1673. [DOI] [PubMed] [Google Scholar]
- 53.Hamada Y, Nishijima T, Watanabe K, et al. High incidence of renal stones among HIV-infected patients on ritonavir-boosted atazanavir than in those receiving other protease inhibitor-containing antiretroviral therapy. Clin Infect Dis 2012; 55:1262–1269. [DOI] [PubMed] [Google Scholar]
- 54.Chan-Tack KM, Truffa MM, Struble KA, et al. Atazanavir-associated nephrolithiasis: cases from the US Food and Drug Administration's Adverse Event Reporting System. AIDS 2007; 21:1215–1218. [DOI] [PubMed] [Google Scholar]
- 55.Gupta SK, Kitch D, Tierney C, et al. Cystatin C-based renal function changes after antiretroviral initiation: a substudy of a randomized trial. Open Forum Infect Dis 2014; 1:1–12. [DOI] [PMC free article] [PubMed] [Google Scholar]
- 56.Markowitz M, Zolopa A, Squires K, et al. Phase I/II study of the pharmacokinetics, safety and antiretroviral activity of tenofovir alafenamide, a new prodrug of the HIV reverse transcriptase inhibitor tenofovir, in HIV-infected adults. J Antimicrob Chemother 2014; 69:1362–1369. [DOI] [PubMed] [Google Scholar]
- 57.Sax PE, Wohl D, Yin MT, et al. Tenofovir alafenamide versus tenofovir disoproxil fumarate, coformulated with elvitegravir, cobicistat, and emtricitabine, for initial treatment of HIV-1 infection: two randomised, double-blind, phase 3, non-inferiority trials. Lancet 2015; 385:2606–2615. [DOI] [PubMed] [Google Scholar]


