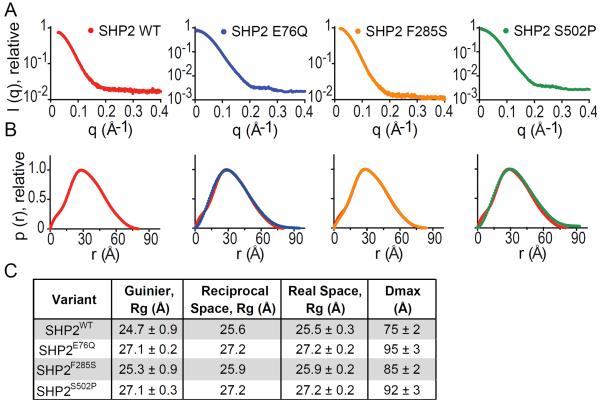
Figure 3. Small Angle X-Ray Scattering (SAXS) Analysis of Cancer-Associated SHP2 Proteins.
(A) SHP2 protein SAXS intensity profiles across radially-averaged scattering vector, q. (B) Distance distribution analysis of SHP2 proteins, calculated through the p(r) function with indirect Fourier transformation of the SAXS intensity profiles. For each mutant, the p(r) function of SHP2WT (red) is displayed for comparison. (C) Radii of gyration (Rg) and maximal end-to-end distance (Dmax) values shown with standard deviations, calculated as described in methods.

