Abstract
Tissue elasticity is measured by shear wave elasticity imaging methods using acoustic radiation force to create the shear waves. Phase aberration and tissue attenuation can hamper the generation of shear waves for in vivo applications. In this study effects of phase aberration and attenuation in ultrasound focusing for creating shear waves were explored. This includes the effects of phase shifts and amplitude attenuation on shear wave characteristics such as shear wave amplitude, shear wave speed, shear wave center frequency and bandwidth. Two samples of swine belly tissue were used to create phase aberration and attenuation experimentally. To explore the phase aberration and attenuation effects individually, tissue experiments were complemented with ultrasound beam simulations using FOCUS and shear wave simulations using Finite Element Model (FEM) analysis. The ultrasound frequency used to generate shear waves was varied from 3.0 to 4.5 MHz.
Results
The measured acoustic pressure and resulting shear wave amplitude decreased approximately 40% to 90% with the introduction of the tissue samples. Acoustic intensity and shear wave displacement were correlated for both tissue samples, the resulting Pearson’s correlation coefficients were 0.99 and 0.97. Analysis of shear wave generation with tissue samples (Phase Aberration and Attenuation case), measured phase screen (Only Phase Aberration case) and FOCUS/FEM model (Only Attenuation case) showed that tissue attenuation affected the shear wave generation more than tissue aberration. Decreasing the ultrasound frequency helped maintain a focused beam for creation of shear waves in the presence of both phase aberration and attenuation.
Keywords: Phase aberration, Attenuation, Shear waves, Acoustic Radiation Force
I. Introduction
Fundamental mechanical properties of soft tissues are closely related to the state of health of the tissue and can be used as an indicator for medical diagnosis. Several acoustic radiation force-based elasticity imaging methods have been developed to study tissue mechanical properties noninvasively. These methods include Acoustic Radiation Force Impulse (ARFI) imaging [1], Shear Wave Elasticity Imaging (SWEI) [2], Supersonic Shear Imaging (SSI) [3] and Shearwave Dispersion Ultrasound Vibrometry (SDUV) [4].
A challenge for acoustic radiation force-based shear wave methods is to quantify the tissue mechanical properties in vivo when both shear wave generation and detection have poor quality. In most ultrasound imaging systems the focusing and steering time delays, which assure that signals on all channels are in phase at the focal area, are calculated based on a constant acoustic velocity [5]. The acoustic velocity actually varies from 1470 m/s in fat to 1665 m/s in collagen [6]. Focusing delays are usually inaccurate when tissue layers with varying acoustic velocity lie between the transducer and the organ of interest. The ultrasound beams become defocused due to the inhomogeneities in acoustic velocity. This effect is commonly known as phase aberration.
The effects of inhomogeneities in acoustic velocities have been studied extensively for conventional ultrasound B-mode imaging applications [7–11]. Krammer and Hassler [7] have shown in vitro time-of-flight fluctuations of ultrasound pulses passing through human abdominal wall depends on sample thickness and composition. The measured values of time delay standard deviation of a sample composed of skin and fat was 20 ns for 14 mm thickness and in a sample containing muscle produced a standard deviation of 74 ns for 23 mm thickness. In a similar study by Sumino, et al. [8], signals were received from a linear array transducer and the wavefront distortions were analyzed via cross-correlation methods, which resulted in time delay differences on the order of 29 ns in a human abdominal wall of about 20 mm thickness. While these studies indicate significant variation in time delay of ultrasound pulses passing through abdominal tissue samples, in vivo settings such as body temperature were not evaluated. Hinkelman, et al [9, 10] reported ultrasonic pulse arrival time by propagation of ultrasound pulses through entire abdominal wall samples and individual layers of fat and muscle at room and body temperature. The measurements at room temperature were 10 to 20 ns less than those made at body temperature and muscle layers caused greater arrival time distortion but less energy and wave-front distortion than fat layers.
In addition to conventional ultrasound imaging, ultrasound phase aberration has been studied for static elastography imaging [12] but not extensively for shear wave elasticity imaging [13]. For in vivo shear wave generation, acoustic waves travel through different tissues, such as skin, fat and muscle, before entering the tissue of interest (e.g. liver, kidney, myocardium, vessels, breast, thyroid, prostate), and such tissue layers can decrease the magnitude of the acoustic energy within the focal region due to phase aberration and ultrasound attenuation. The radiation force, F (kg/cm2s2), is proportional to the intensity of the ultrasound beam, I (W/cm2), as given by
| (1) |
where α (Np/m) is the ultrasound attenuation and c (m/s) is the sound speed in the medium. A reduction in the intensity through defocusing due to aberration and/or attenuation of the medium will cause the radiation force and the induced motion amplitude to decrease. It has been shown in numerous studies that displacement amplitude is a main determinant of the error associated with shear wave speed measurements [14]. For instance, ARFI/SWEI in vivo studies aim for about 10 μm peak displacement and require four times the push length of phantom studies [15]. Palmeri, et al. [15], proposed that lower ultrasound frequencies for the radiation force push beam could be used to minimize the effects of phase aberration. Lower frequencies may be attractive because for a given amount of time delay errors in the focusing delays imposed by sound speed inhomogeneities, beams with lower ultrasound frequencies will be affected less because the time error is a smaller percentage of the total ultrasound period and it will have less impact on defocusing the ultrasound beam.
In addition to phase aberration, ultrasound attenuation is another mechanism that can affect shear wave generation; it results from the interaction of ultrasound waves with tissue through absorption and scattering mechanisms. Ultrasound attenuation is usually modeled to be proportional to frequency; therefore, by lowering the push beam frequency the ultrasound attenuation is reduced. Shi, et al. [13], reported on measurements made in in vivo swine liver with the overlying tissue intact and ex vivo with the tissue layers removed. They also used a portion of swine belly tissue to explore the effects that the tissue had on the peak displacement and shear modulus estimates and found that these parameters varied with different areas and thicknesses of tissue investigated. One of the drawbacks of this study is that the tissue samples were not characterized fully and did not separate the effects of attenuation and phase aberration.
As a higher percentage of the American population becomes obese [16], the amount of overlying tissue over organs such as the liver or kidneys will cause increasingly significant phase aberration, affecting the ability to apply acoustic radiation force shear wave elasticity imaging methods in these organs for noninvasive diagnostic examinations. To this end, it is necessary to study how phase aberration and attenuation affects the ultrasound beams used to generate shear waves using ultrasound radiation force. Although phase aberration and attenuation affects both shear wave generation beams and shear wave detection beams, this study is only focused in on the generation of the beams.
In this study we systematically investigated the effects of phase aberration and attenuation on shear wave generation. Two samples of swine tissue were used to alter the ultrasound beam used for shear wave generation (Phase Aberration and Attenuation case). The swine tissue samples were characterized in terms of measured ultrasound pulse arrival time and energy fluctuations by insertion loss method. To separate the effects of attenuation and aberration individually, the tissue samples’ phase screen and attenuation were measured and used to alter the ultrasound beam experimentally by adding the measured phase screen to the transmit delays for the push beam transmit (Only Phase Aberration case) and through FOCUS and FEM simulations (Only Attenuation case). Acoustic pressure, shear wave amplitude, shear wave speed, shear wave center frequency and bandwidth at different ultrasound push frequencies were evaluated for each case (Phase Aberration and Attenuation, Only Phase Aberration and Only Attenuation).
II. Materials and Methods
A homogenous custom elastic phantom and two samples of excised swine belly tissue were used. An elastic phantom with agarose concentration (by weight) of 1% was prepared by dissolving agar (Sigma-Aldrich, St. Louis, MO) into distilled deionized water. The solution was then magnetically stirred while a preservative of 1% potassium sorbate (Sigma-Aldrich, St. Louis, MO) and 1% cellulose particles (Sigma-Aldrich, St. Louis, MO) with size 20 μm were added to provide ultrasonic scattering. The solution was heated to 90 °C, degassed, poured in a 9 × 9 × 6 cm and a 9 × 9 × 4 cm containers for shear wave measurements (width × length × height) without tissue layer and with tissue layer respectively, and a 5 × 5 × 1.6 cm container for speed of sound and attenuation measurements (width × length × height) and cooled to room temperature. The tissue samples consisted of the skin, subcutaneous fat, and muscle. Fig. 1 shows pictures of the tissue samples. The tissue samples thickness were approximately 23.75 mm for Sample 1 and 23.25 mm for Sample 2. All experimental measurements were obtained in saline bath close to body temperature (33 °C to 35 °C).
Fig. 1.
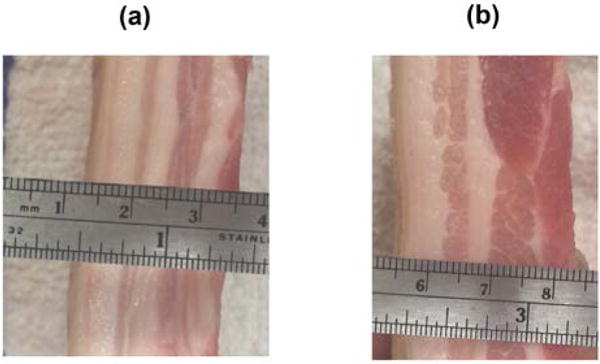
Individual excised pork belly tissue (a) Sample 1, (b) Sample 2.
A. Tissue phase screen and tissue attenuation measurements
Measurements of the time delay of ultrasound pulses passing through a tissue sample were performed with a loss-insertion method. An unfocused single element transducer (V382, Olympus Panametrics NDT., Waltham, Massachusetts) with a diameter of 12.7 mm and a center frequency of 3.5 MHz was used to transmit a 1 μs ultrasound pulse. The ultrasound pulse traveled through either saline or a saline-tissue complex before being received by a needle hydrophone (PVDF TNU001A, NTR Systems, Inc., Seattle, WA). The saline temperature was controlled to be close to body temperature (33 °C to 35 °C). Fig. 2(a) illustrates the experimental set up, the tissue samples were attached to a plate that was moved in two dimensions (z–x plane) by a motor every 0.25 mm over an area of 20 mm × 40 mm orthogonal to the transmitter-hydrophone positions. The ultrasound echoes were digitized at 100 MHz, interpolated to 200 MHz and processed by a cross-correlation method described by Hinkelman, et al. [9] to estimate the tissue phase screen time delays and root-mean-square (rms) arrival time for each tissue sample.
Fig. 2.
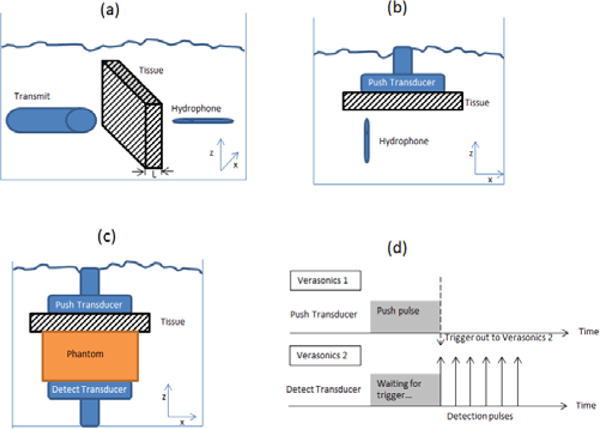
Experimental set up, (a) Tissue phase screen and attenuation measurements, (b) Acoustic field measurements, (c) Shear wave generation and (d) Pulse sequence for shear wave generation and detection, adapted from [20].
Attenuation measurements were obtained by spectral analysis of insertion-loss measurements, where Ps(t) is the received pulse by the hydrophone with the saline path only and Pt(t) is the received pulse when the tissue sample is inserted [17]. The attenuation, α(f) (dB/cm/MHz), is computed by equation (2):
| (2) |
where As(f) and At(f) are the amplitude spectra of Ps(t) and Pt(t), respectively, and L (cm) is the thickness of the tissue sample. The computed attenuation, α(f), is then fit to a power-law relation, equation (3), by a least squares fit:
| (3) |
where f (MHz) is frequency, β (dB/cm) and n are material-dependent parameters.
B. Acoustic field measurements
The acoustic pressure field from the L7-4 probe (Phillips Healthcare, Andover, MA) push beam driven by a Verasonics system (V1, Verasonics, Inc. Kirkland, WA) was measured using a needle hydrophone (PVDF TNU001A, NTR Systems, Inc., Seattle, WA), Fig. 2(b) illustrates the experimental set up. The ultrasound signal was digitized at 50 MHz. The push beam frequencies were 3.00, 3.46, 4.09 and 4.50 MHz. Two-dimensional scans were performed with a spatial resolution of 0.3 mm in the mid-elevation plane (x–z plane) of the L7-4 transducer. Measurements were performed in a tank filled with saline close to body temperature (33 °C to 35 °C) where the transducer repeatedly transmitted the push pulse while the hydrophone was translated by step motors to scan the pressure field. The L7-4 was focused at 40 mm depth from the transducer surface. All measurements were made with 128 elements used for push beam transmission and in a 20 × 40 mm area centered at z = 40 mm and the center of the transducer.
C. Shear wave generation and detection
Two Verasonics ultrasound systems, each equipped with a 128 element linear array transducer (L7-4), were used in this study. The two probes were placed opposed to each other on opposite sides of the phantom. One probe (Push transducer) was used to transmit a 40 mm depth focused push beam at 3.00, 3.46, 4.09 and 4.50 MHz with 128 elements and 600 μs duration (Verasonics 1). The other probe (Detect transducer) was used to detect the shear wave motion using flash imaging technique [18] at a frame rate of 10 kHz with 3 angle compounding (Verasonics 2). The Verasonics ultrasound system uses parallel channel processing to generate one complete two-dimensional (2D) ultrasound image for one transmission [3]. The center frequency for image reconstruction was 5 MHz and the spatial resolution in x-direction (Δx) and z-direction (Δz) were one wavelength (λ). Each tissue sample was placed on top of the phantom and below the push probe (Verasonics 1), as shown in Fig. 2(c). The push and detection from the two systems were synchronized by trigger signals; refer to Fig. 2(d). Saline solution close to body temperature (33 °C to 35 °C) was poured between the tissue sample and the phantom surface to ensure acoustic coupling.
Shear wave displacements were calculated by a two-dimensional (2D) in-phase/quadrature (IQ) data autocorrelation method [19]. Shear wave particle velocity was estimated from the time derivative of displacement and then band pass filtered from 50 Hz to 950 Hz. To improve signal-to-noise (SNR) ratio, the shear wave displacement at the focal depth of push beam was averaged over 5 mm along the beam axis (z-axis in Fig. 2(c)).
D. Shear wave speed measurement and frequency analysis
The speeds of the generated shear waves were measured as well as the center frequencies and bandwidths of the shear waves. Shear wave speed (group velocity, cg) was estimated using a Radon transform algorithm [20–22]. The shear wave center frequency (fc), a parameter that describes the frequency content of shear wave, in the frequency-domain was calculated from the peak energy in the two-dimensional fast Fourier transform (2D FFT) of shear wave particle velocity. Similarly, the bandwidth was estimated from the upper −12 dB frequency relative to the center frequency on the 2D FFT space (k-space) [23]. All processing methods were performed in customized MATLAB (The MathWorks, Inc., Natick, MA) code.
E. Speed of sound measurements
The speed of sound of the phantom was calculated using the set up described for the tissue phase screen and tissue attenuation measurements (Fig. 2(a)). A single element transducer transmitted an ultrasound pulse. The ultrasound pulse traveled through either saline or saline-phantom-saline complex before received by the hydrophone. The acoustic velocity (speed of sound) through saline was estimated according to Duck, et. al. [24] with salt concentration of 9 g/1000 cm3 and saline temperature of 33 °C to 35 °C.
The time, ttotal, needed for the pulse to go through the saline-phantom-saline complex is described by:
| (4) |
| (5) |
where d is the phantom thickness, csaline is the speed of sound in saline and D is the distance between the transducer and the hydrophone. Solving Eq. (5) for cphantom, the speed of sound in the phantom is described by:
| (6) |
F. Experiments and simulations
Both experiments and simulations that were used in this study are organized in three cases: Phase Aberration and Attenuation case, Only Phase Aberration case, and Only Attenuation case. The diagram in Fig. 3 summarized each case. For the experiments (Phase Aberration and Attenuation case, Only Phase Aberration case) the linear array transducer that was used had approximately 60% bandwidth. To minimize the effects of such finite bandwidth the measured acoustic pressure and shear wave displacements were normalized with respect to when there was no phase screen or no tissue sample(s).
Fig. 3.
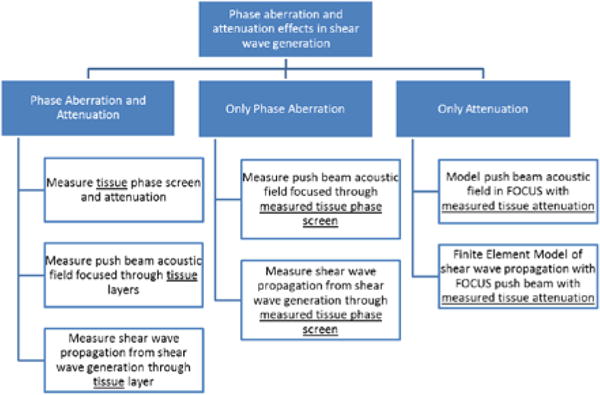
Experiments and simulation block diagram.
1) Phase Aberration and Attenuation case
In vivo shear wave generation is affected by both phase aberration and tissue attenuation. To understand phase aberration and tissue attenuation, excised pork belly tissue samples were used. First, the tissue samples phase aberration (arrival time) and attenuation were measured in a two-dimensional area as described in section II.A. Second, the push beam acoustic pressure field was measured when focusing through only saline (control case) and then when focusing through the tissue samples, as described in section II.B. Finally, shear wave propagation was measured when focusing through only saline (control case) and then when focusing through the tissue samples, as described in section II.C. From the tissue phase aberration measurement, the tissue sample’s arrival time characteristics such as phase screen (arrival time as a function of spatial distance) and the root-mean-square (rms) of each measured phase screen were calculated. The acoustic pressure field measurements were normalized to the saline (control case) scan to minimize the effects of transducer bandwidth, then a 5 × 5 mm2 window centered at the focus was used to calculate the average pressure. The shear wave propagation measurements were characterized by the shear wave temporal peak displacement averaged in a 5 × 5 mm2 window centered at the focus and normalized to the saline (control case) to minimize the transducer bandwidth effect. Additionally shear wave group velocities and center frequency were calculated as described in section II.D.
2) Only Phase Aberration case
To characterize the phase aberration effect without the tissue attenuation component in shear wave generation, the measured tissue phase screen was used instead of the tissue samples. First, the push beam acoustic pressure field was measured when focusing through only saline (control case) and then when focusing through the measured phase screen, as described in section II.B. Similarly, shear wave propagation was measured as described in section II.C when focusing through only saline (control case) and then when focusing through the measured tissue phase screen. Transmit geometrical delays calculated by the Verasonics 1 system were modified by adding the measured phase screen delays for each tissue sample.
3) Only Attenuation case
To characterize the tissue attenuation effect without the phase aberration component in shear wave generation, the measured tissue attenuation was used instead of the tissue samples. The push beam acoustic pressure field was obtained through FOCUS and the shear wave propagation was obtained through Finite Element Model (FEM).
a) Radiation force field simulation using FOCUS
The simulation program FOCUS [25–27] was used to simulate the acoustic radiation force field generated by a focused beam from a linear array transducer. The simulated transducer had 128 elements with element size of 7.0 × 0.3 mm (height × width). The center frequency of the push pulses were 3.00, 3.46, 4.09 and 4.50 MHz.
The pressure field was calculated in a 40 × 10 × 40 mm space (lateral × elevation × axial, represented by x, y, and z) with a spatial resolution of 0.1 mm. The pressure field was calculated in a two layered medium, the first layer from the transducer face to 2 cm depth represented the tissue sample with frequency dependent attenuation shown in Table I; the second layer from 2 cm depth to 4 cm depth represented the phantom with frequency dependent attenuation of 0.4 dB/MHz/cm. These attenuation values were selected from preliminary studies.
Table I.
Tissue samples characteristics
| Sample | Thickness, mm | RMS Delay, ns (mean ± SD, n = 80) |
Attenuation, dB/cm/MHz (mean ± SD, n = 80) |
|---|---|---|---|
| 1 | 23.75 | 27.73 ± 8.48 | 1.75 ± 0.27 |
| 2 | 23.25 | 193.62 ± 56.93 | 2.23 ± 0.34 |
b) Finite Element shear wave model
A three-dimension FE model with the size of 100 × 20 × 20 mm (represented by x, y, and z) was constructed using Abaqus/CAE 6.01-EF1 (Dassault Systemes S.A.; Velizy-Villacoublay, France). The model was meshed with 5 million 8-node linear elements with the size of 0.2 × 0.2 × 0.2 mm3 each. The material properties where described by Voigt model with μ1 = 9 kPa and μ2 = 0.1 Pa·s, mass density of 1000 kg/m3 and Poisson’s ratio of 0.49. The time sampling rate was 10 kHz. One side of the model (y–z plane at x = 100 mm) was fixed through the simulation.
G. Statistical analysis
Univariate ANOVA was used to evaluate for each experiment if there was a significance difference between the measured mean variable (acoustic pressure and shear wave peak displacement) among the studied push beam frequencies. Because the acoustic pressure field scans were laborious, they were not repeated and the reported values are from a 5 × 5 mm2 region centered at the focus with 200 total samples. On the other hand, the shear wave propagation measurements were repeated 4 times by placing the linear array transducer to different locations on the tissue layers, therefore the total number of samples was 4. Statistical significance for all results was accepted for p ≤ 0.05. Results of measurements from different push beam frequencies are reported as mean with margin error as the 95% confidence interval (95% CI). Other measurements are reported as mean ± standard deviation (SD).
III. RESULTS
The measured arrival time of the two tissue samples are shown in Fig. 4. The measured arrival times were averaged along the z-axis (refer to Fig. 2(a)) and results are shown as a mean over 80 samples.
Fig. 4.
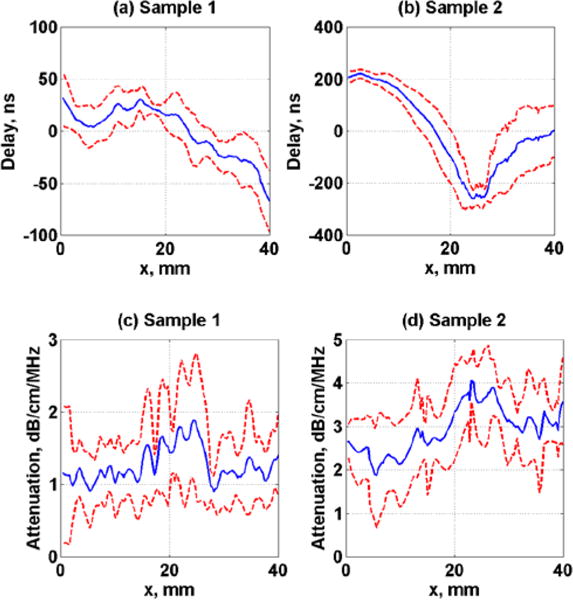
Measured average arrival time and ultrasound attenuation of tissue samples, (a)–(c) Sample 1 and (b)–(d) Sample 2. Dashed lines represent the standard deviation over 80 samples.
The measured speed of sound in saline water at temperature of 33 °C and 35 °C was 1525.2 ± 1.5 m/s (mean ± standard deviation, n = 80) and 1529.1 ± 0.9 m/s (mean ± standard deviation, n = 80) respectively. The speed of sound in the phantom placed in saline temperature bath of 33 °C and 35 °C, according to Eq. (6) was 1521.9 ± 3.4 m/s (mean ± standard deviation, n = 80) and 1525.7 ± 2.8 m/s (mean ± standard deviation, n = 80) respectively.
Table I shows the results of the tissue samples characterization of measured time of arrival and insertion loss values.
The measured acoustic pressure using a 4.09 MHz push frequency for all three study cases (Phase Aberration and Attenuation, Only Phase Aberration, and Only Attenuation) are shown in Fig. 5. The scale is normalized with respect to the saline measurement (control case), from 0 to 1.
Fig. 5.
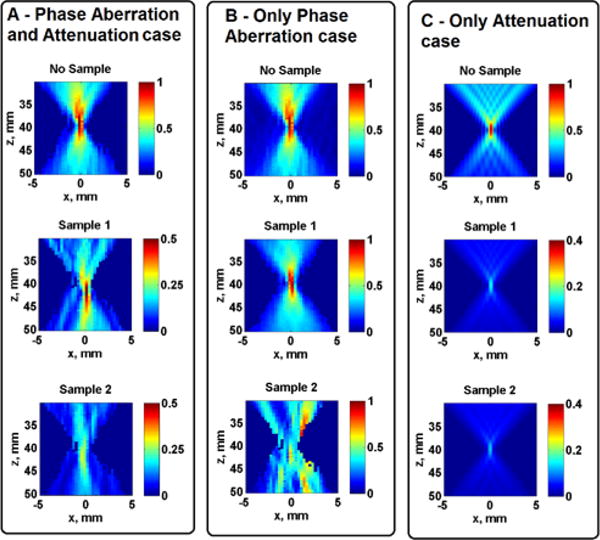
Measured and simulated normalized acoustic pressure. The images in Panel A are from Phase Aberration and Attenuation case, Panel B are from Only Phase Aberration case and Panel C are from Only Attenuation case. Images in the top row figures are measured without tissue samples, images in the middle row are measured on Sample 1 and images in the bottom row are measured on Sample 2. Images in Panels A and B are from measurements and the images in Panel C are from simulations.
The mean normalized acoustic pressure at the focal area for all frequencies and study cases (Phase Aberration and Attenuation, Only Phase Aberration, Only Attenuation) on Samples 1 and 2 are summarized in Fig. 6, the error bars represent the 95% confidence interval (n = 200). Univariate ANOVA tests were performed to evaluate if there was significance difference in normalized acoustic pressure among the studied frequencies in each tissue sample. The univariate ANOVA test null hypothesis was defined as equal means of acoustic pressure at each frequency. The normalized acoustic pressure was significantly different (p < 0.01) among the studied push frequencies for the Phase Aberration and Attenuation case and for the Only Attenuation case for both tissue samples. On the other hand, the normalized acoustic pressure was not significantly different for Sample 1 (p = 0.92) but significantly different for Sample 2 (p = 0.02) among the studied push frequencies for the Only Phase Aberration case.
Fig. 6.
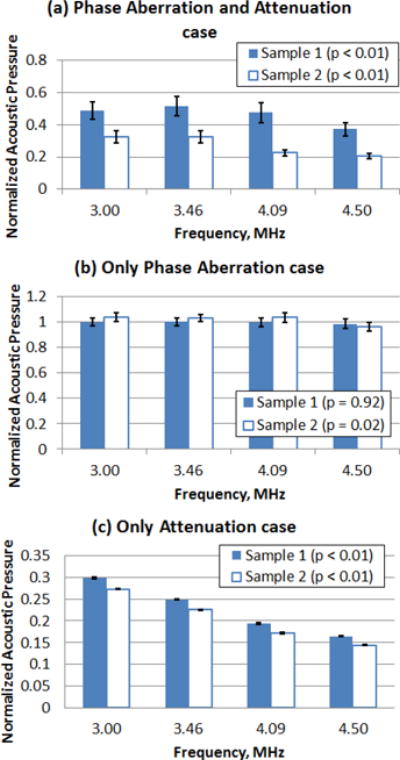
Mean normalized acoustic pressure (n = 200) at the focal region from the acoustic pressure scan for tissue Sample 1 and Sample 2. (a) Phase Aberration and Attenuation case, (b) Only Phase Aberration case and (c) Only Attenuation case. The error bars represent the 95% confidence interval (n = 200).
The effects of varying push beam frequency on the L7-4 transducer are shown in Fig. 7. The shear wave displacements at the specified focal depth of 40 mm are plotted as images with dimensions of lateral distance, x, versus time, t, for Sample 1. The images in the top row represent the shear wave propagation when using a 4.50 MHz push beam frequency. The images in the bottom row represent the shear wave propagation when using a 3.46 MHz push beam frequency. The scale is normalized with respect to the saline measurement (control case), from 0 to 1. It can be seen that lowering the push beam frequency results in shear waves with higher displacement. Certainly to maintain reliable displacement amplitude the push beam frequency must remain within the bandwidth of the transducer used.
Fig. 7.
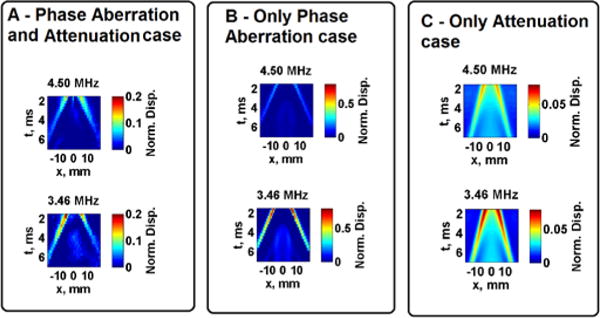
Measured and simulated normalized shear wave peak displacement at focus. Images in Panel A show results from the Phase Aberration and Attenuation case, Panel B shows results from the Only Phase Aberration case and Panel C shows results from the Only Attenuation case. Images in the top row represent the push beam frequency of 4.50 MHz, images in the bottom row represent the push beam frequency of 3.46 MHz. Images in Panels A and B are from measurements and the images in Panel C are from simulations of tissue Sample 1.
The normalized temporal peak displacement from pushing with all push beam frequencies through four locations of Sample 1 and Sample 2 are shown in Fig. 8. Results are shown as the mean and the error bars represent the 95% confidence interval (n = 4).
Fig. 8.
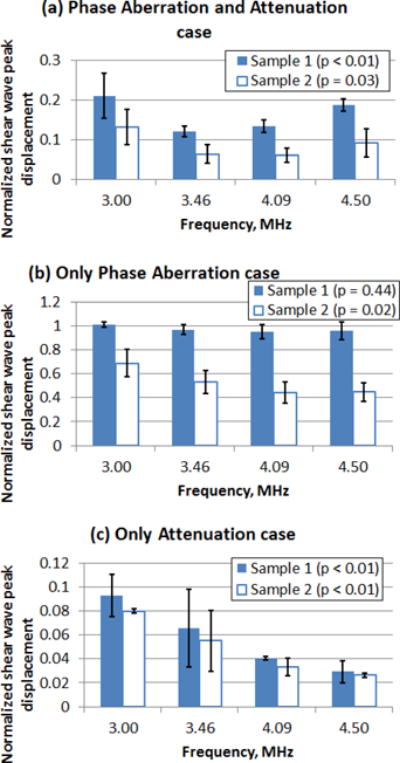
Mean normalized temporal shear wave peak displacement from pushing through four locations of tissue Sample 1 and Sample 2. (a) Phase Aberration and Attenuation case, (b) Only Phase Aberration case and (c) Only Attenuation case. The error bars represent the 95% confidence interval (n = 4).
Normalized peak displacements are useful to identify the optimal push beam frequency for the transducer depending on the amount of phase screen or tissue sample. Univariate ANOVA tests were performed to evaluate if there was significance difference in normalized shear wave peak displacement among the studied frequencies in each tissue sample. The univariate ANOVA test null hypothesis was defined as equal means of normalized shear wave peak displacement at each frequency. By inspection, in the case of Only Phase Aberration there was a slight increase in normalized shear wave displacement as the push beam frequency decreased from 4.50 MHz to 3.00 MHz for Sample 1, however there was not a statistically significant difference in normalized shear wave peak displacement with different push frequencies for Sample 1 (p = 0.44). On the other hand, there was a visible increase and a statistically significant difference in the mean normalized shear wave displacement as the push beam frequency decreased from 4.50 MHz to 3.00 MHz for Sample 2 (p = 0.02). For the case of Phase Aberration and Attenuation and the case of Only Attenuation, there was a statistically significant increase in the normalized shear wave displacement as the push beam frequency decreased from 4.50 MHz to 3.00 MHz for Sample 1 (p < 0.01 and p < 0.01) and Sample 2 (p = 0.03 and p < 0.01).
Fig. 9 illustrates representative shear wave propagation motion and k-space analysis of the right-side propagating wave from a 4.09 MHz push beam frequency on Sample 1 for the Phase Aberration and Attenuation case and Only Attenuation case.
Fig. 9.
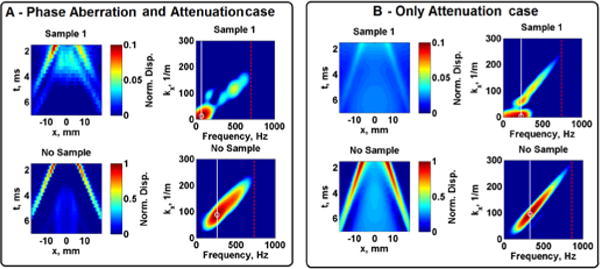
Measured and simulated normalized shear wave peak displacement at focus and k-space of the right-side propagating wave from a push beam frequency of 4.50 MHz in Sample 1. Images in Panel A show results from the Phase Aberration and Attenuation case, Panel B shows results from the Only Attenuation case. The shear wave center frequency is represented with a white circle and white line, the shear wave bandwidth is represented with a red dashed line in the k-space images.
The shear wave group velocities for all cases and Mean Absolute Percentage Error (MAPE) are shown in Table II. Eq. (7) describes the MAPE, where the True Value is the shear wave group velocities when no tissue sample or phase screens were used.
| (7) |
Table II.
Shear wave group velocity and Mean Absolute Percentage Error (MAPE).
| Mean shear wave group velocity [95%CI, n = 4], m/s
|
Mean Absolute Percentage Error (mean ±SD, n = 4)
|
|||||||
|---|---|---|---|---|---|---|---|---|
| Sample 1
|
Frequency, MHz
|
Frequency, MHz
|
||||||
| Case | 3.00 | 3.46 | 4.09 | 4.50 | 3.00 | 3.46 | 4.09 | 4.50 |
|
|
|
|
||||||
| Attenuation and Aberration* | 2.74 [2.61, 2.87] | 2.85 [2.76, 2.94] | 2.89 [2.84, 2.94] | 2.63 [2.28, 2.98] | 7.35 ± 4.26 | 2.90 ± 2.79 | 2.28 ± 1.82 | 10.54 ± 12.33 |
| Only Phase Aberration* | 2.96 [2.95, 2.97] | 2.96 [2.96, 2.96] | 2.98 [2.96, 3.00] | 2.98 [2.96, 3.00] | 0.17 ± 0.34 | 1.02 ± 0.00 | 0.51 ± 0.59 | 1.19 ± 0.59 |
| Only Attenuation* | 3.11 [3.11, 3.11] | 3.11 [3.11, 3.11] | 3.15 [3.11, 3.19] | 3.19 [3.15, 3.23] | 0.00 ± 0.00 | 0.00 ± 0.00 | 1.37 ± 1.19 | 2.41 ± 1.40 |
| Reference experimental* | 2.96 | 2.93 | 2.96 | 2.94 | ||||
| Reference simulationsˆ | 3.11 | 3.11 | 3.11 | 3.11 | ||||
|
Sample 2
|
|
|
||||||
|
Case
|
||||||||
| Attenuation and Aberration** | 3.70 [3.34, 4.06] | 3.84 [3.51, 4.17] | 3.46 [3.00, 3.92] | 3.41 [2.59, 4.23] | 24.92 ± 12.42 | 31.06 ± 11.60 | 16.81 ± 15.81 | 27.89 ± 10.94 |
| Only Phase Aberration** | 2.99 [2.94, 3.04] | 2.99 [2.93, 3.05] | 2.96 [2.87, 3.05] | 2.97 [2.88, 3.06] | 1.35 ± 1.20 | 2.05 ± 1.70 | 2.11 ± 1.98 | 2.72 ± 1.18 |
| Only Attenuationˆˆ | 3.11 [3.11, 3.11] | 3.14 [3.10, 3.18] | 3.23 [3.16, 3.30] | 3.51 [3.09, 3.93] | 0.00 ± 0.00 | 1.05 ± 1.37 | 3.78 ± 2.31 | 12.70 ± 13.71 |
| Reference experimental** | 2.96 | 2.93 | 2.96 | 2.94 | ||||
| Reference simulationsˆˆ | 3.11 | 3.11 | 3.11 | 3.11 | ||||
*, **: Experiments;
ˆ, ˆˆ: Simulations
Tables III and IV summarize the shear wave center frequency (fc) and shear wave bandwidth, respectively, for all cases as well as the MAPE.
Table III.
Shear wave center frequency and Mean Absolute Percentage Error (MAPE).
| Mean shear wave center frequency [95%CI, n = 4], Hz
|
Mean Absolute Percentage Error (mean ±SD, n = 4)
|
|||||||
|---|---|---|---|---|---|---|---|---|
| Sample 1
|
Frequency, MHz
|
Frequency, MHz
|
||||||
| Case | 3.00 | 3.46 | 4.09 | 4.50 | 3.00 | 3.46 | 4.09 | 4.50 |
|
|
|
|
||||||
| Attenuation and Aberration* | 217.07 [123.49, 310.65] | 127.64 [58.27, 197.01] | 130.08 [54.92, 205.24] | 142.33 [27.41, 257.25] | 30.93 ± 22.18 | 52.57 ± 26.31 | 51.07 ± 28.85 | 48.31 ± 40.40 |
| Only Phase Aberration* | 269.92 [266.61, 273.23] | 267.89 [264.87, 270.91] | 263.41 [260.65, 266.17] | 264.63 [260.05, 269.21] | 0.90 ± 0.78 | 1.06 ± 0.30 | 1.38 ± 0.59 | 1.40 ± 0.77 |
| Only Attenuationˆ | 363.41 [362.99, 363.83] | 359.76 [357.37, 362.15] | 351.22 [297.63, 404.81] | 380.49 [358.93, 402.05] | 1.36 ± 0.07 | 2.07 ± 0.80 | 11.03 ± 8.80 | 12.23 ± 6.49 |
| Reference experimental* | 270.73 | 269.11 | 265.85 | 267.48 | ||||
| Reference simulationsˆ | 358.44 | 343.90 | 353.66 | 339.02 | ||||
|
Sample 2
|
|
|
||||||
|
Case
|
||||||||
| Attenuation and Aberration** | 113.01 [81.65, 144.37] | 116.76 [101.98, 131.54] | 81.12 [65.48, 96.76] | 92.33 [54.69, 129.97] | 58.26 ± 11.82 | 56.61 ± 5.60 | 69.49 ± 6.00 | 65.48 ± 14.33 |
| Only Phase Aberration** | 265.85 [250.29, 281.41] | 261.38 [246.36, 276.50] | 246.34 [228.84, 263.84] | 241.46 [224.25, 258.67] | 3.90 ± 4.29 | 4.08 ± 4.61 | 7.34 ± 6.72 | 8.61 ± 6.65 |
| Only Attenuationˆˆ | 370.73 [364.26, 376.90] | 367.07 [364.78, 369.36] | 331.71 [259.91, 403.51] | 308.54 [262.79, 354.29] | 3.40 ± 1.76 | 3.79 ± 0.69 | 6.21 ± 7.21 | 8.99 ± 5.92 |
| Reference experimental** | 270.73 | 269.11 | 265.85 | 267.48 | ||||
| Reference simulationsˆˆ | 358.44 | 343.90 | 353.66 | 339.02 | ||||
*, **: Experiments;
ˆ, ˆˆ: Simulations
Table IV.
Shear wave bandwidth and Mean Absolute Percentage Error (MAPE).
| Mean shear wave bandwidth [95%CI, n = 4], Hz
|
Mean Absolute Percentage Error (mean ±SD, n = 4)
|
|||||||
|---|---|---|---|---|---|---|---|---|
| Sample 1
|
Frequency, MHz
|
Frequency, MHz
|
||||||
| Case | 3.00 | 3.46 | 4.09 | 4.50 | 3.00 | 3.46 | 4.09 | 4.50 |
|
|
|
|
||||||
| Attenuation and Aberration* | 513.01 [505.09, 520.93] | 571.14 [488.09, 654.19] | 548.37 [499.62, 597.12] | 706.91 [537.76, 876.06] | 27.55 ± 1.14 | 22.20 ± 11.54 | 24.47 ± 6.85 | 17.44 ± 14.16 |
| Only Phase Aberration* | 707.72 [704.70, 710.74] | 732.93 [728.94, 736.92] | 723.98 [719.40, 728.56] | 699.59 [692.53, 706.65] | 0.29 ± 0.29 | 0.39 ± 0.38 | 0.72 ± 0.64 | 1.21 ± 1.02 |
| Only Attenuationˆ | 979.27 [977.90, 980.64] | 957.32 [952.54, 961.90] | 917.07 [852.64, 981.50] | 787.80 [652.53, 923.07] | 0.63 ± 0.25 | 1.42 ± 0.49 | 4.63 ± 5.86 | 15.12 ± 13.93 |
| Reference experimental* | 708.13 | 734.15 | 726.02 | 701.63 | ||||
| Reference simulationsˆ | 973.17 | 943.90 | 948.78 | 919.51 | ||||
|
Sample 2
|
|
|
||||||
|
Case
|
||||||||
| Attenuation and Aberration** | 504.27 [336.91, 671.63] | 478.86 [335.70, 622.02] | 379.67 [211.18, 548.16] | 583.33 [379.03, 787.63] | 29.71 ± 22.58 | 34.77 ± 19.90 | 47.70 ± 23.68 | 29.70 ± 9.75 |
| Only Phase Aberration** | 646.75 [597.36, 696.14] | 637.40 [591.17, 683.63] | 594.72 [545.75, 643.69] | 552.44 [508.59, 596.29] | 8.67 ± 7.12 | 13.17 ± 6.43 | 18.45 ± 6.85 | 21.98 ± 6.32 |
| Only Attenuationˆˆ | 984.15 [981.76, 986.54] | 937.80 [890.74, 984.86] | 636.59 [443.71, 829.47] | 482.93 [362.34, 603.52] | 1.13 ± 0.25 | 3.49 ± 3.20 | 32.90 ± 20.74 | 47.48 ± 13.38 |
| Reference experimental** | 708.13 | 734.15 | 726.02 | 701.63 | ||||
| Reference simulationsˆˆ | 973.17 | 943.90 | 948.78 | 919.51 | ||||
*, **: Experiments;
ˆ, ˆˆ: Simulations
IV. DISCUSSION
The measured tissue sample phase screen resembles the real tissue samples and adds insight regarding the characteristics and causes of push beam focusing distortion through in vivo tissue samples. The tissue samples used in this study were similar to what have been used in previous studies that used human tissues. For instance, Hinkelman, et al. [10], have reported arrival time fluctuations of muscle layer of 7 to 10 mm thickness with rms of 28.5 and 61.9 ns and fat layers of 9.5 and 17.8 mm with rms of 21.9 and 21.5 ns. In contrast, the measured rms of our samples were 27.73 ns and 193.62 ns for a 23.75 mm and 23.25 mm tissue samples thickness. The tissue samples studied in this investigation were composites of skin, fat, and muscle which may explain the large differences between the two samples that have similar thicknesses.
As shown in Figs. 5 and 6, focusing an ultrasound beam through tissue samples (Phase Aberration and Attenuation case) hampered the ability of the acoustic radiation force necessary to generate shear waves providing less energy to be deposited in the focal area producing a weak shear wave. When analyzing these results it is important to distinguish between the two mechanisms that can reduce the shear wave displacement amplitude, ultrasound attenuation and phase aberration. If pure attenuation was the only mechanism then there would be no defocusing and only a reduction in the beam intensity, which would reduce the radiation force (Eq. (1)) and induced motion as illustrated in the results when Only Attenuation was used to alter the push beam, acoustic pressure (Figs. 5 and 6) and shear wave displacement (Fig. 8) were as reduced as in the case of focusing through the tissue samples (Phase Aberration and Attenuation case). The second mechanism that can reduce the shear wave displacement amplitude is phase aberration, which serves to defocus the beam and effectively attenuate the beam and reduce the shear wave motion amplitude. The results from the case where Only Phase Aberration was used to alter the push beam, it can be seen that acoustic pressure (Figs. 5 and 6) and shear wave displacement (Fig. 8) were minimally affected. This provides an insight that phase aberration is not the only mechanism that affects the push beam, and most importantly the result implies that the attenuation reduces the displacement amplitude more significantly than aberration. The latter statement is reinforced by the results from the Phase Aberration and Attenuation case, where the ultrasound acoustic pressure (Figs. 5 and 6) and shear wave displacement (Fig. 8) are reduced to similar levels as in the Only Attenuation case. The reduction in ultrasound acoustic pressure when focusing through tissue due to ultrasound attenuation could be minimized by lowering the push frequencies, therefore less reduction in peak motion amplitude could be encountered, as shown in Fig 7.
A linear correlation (with zero intercept) comparing normalized acoustic intensity (square of acoustic pressure) with normalized shear wave displacement for each case and tissue sample is shown in Fig. 10. Each data point represents a separate case (Phase Aberration and Attenuation case, Only Phase Aberration case and Only Attenuation case) from the acoustic pressure squared (intensity) and shear wave peak displacement over the four push frequencies. The intercept was forced to 0 to account for the condition that zero force should yield zero displacement. The Pearson’s correlation coefficients were 0.99 for Sample 1 and 0.97 for Sample 2. The correlation coefficients were similar and large for the studied tissue samples, which confirm the linear relationship that exists between acoustic intensity and shear wave displacement. Moreover, the shear wave peak displacement could be used to assess the strength of the generated shear wave through tissue in clinical applications with the use of a control phantom.
Fig. 10.
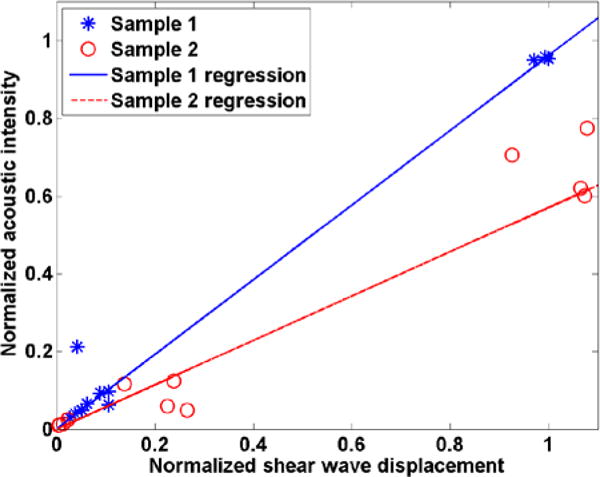
Linear correlation comparing normalized acoustic intensity with normalized shear wave displacement for tissue (*) Sample 1 and (o) Sample 2.
We studied the shear wave group velocity and frequency characteristics of the resulting shear waves as a function of the phase aberration and attenuation associated with the phase screens and tissue samples. The group velocity estimates for all cases were successfully estimated. There are several effects that can be appreciated in Table II that summarized the Mean Absolute Percentage Error (MAPE) of shear wave group velocity. First, in all cases (Phase Aberration and Attenuation, Only Phase Aberration and Only Attenuation), the MAPE was lower in Sample 1 compared to Sample 2, which agrees with the fact that Sample 1 has less phase aberration and attenuation (Table I). Secondly, at high push frequencies the MAPE of the Only Attenuation case was higher than the Only Phase Aberration case, contrary to the lower push frequencies where the MAPE of the Only Attenuation case was lower than the Only Phase Aberration Case, which suggests that ultrasound attenuation dominates the MAPE at high frequencies and phase aberration dominates the MAPE at low frequencies. Overall, the Radon transform method was able to estimate the shear wave group velocity with a MAPE less than 11% for Sample 1 and 31% for Sample 2, the latter being a stronger aberrator and attenuator.
The shear wave frequency content was studied by estimating the shear wave center frequency (fc) and shear wave bandwidth. A higher fc value will correspond to a shear wave with a sharper wave front. The fc value is also important to note when calculating the group velocity in a viscoelastic medium because dispersion causes the shear wave speed to depend on frequency. It was shown that the fc and bandwidth values were most affected when both phase aberration and attenuation are present and changed depending on the level of phase aberration and attenuation (higher MAPE of Sample 2 compared to Sample 1 in most cases). As shown in Tables III and IV, in the Phase Aberration and Attenuation case and Only Attenuation case the 95% confidence interval (95%CI) and MAPE of the measurements were larger than the Only Phase Aberration case at higher frequencies in both samples. Moreover, the mean shear wave center frequency and bandwidth were lower in Sample 2 with respect to Sample 1 for all push frequencies for the Phase Aberration and Attenuation case and Only Phase Aberration case, but only at higher frequencies for the Only Attenuation case. These results indicate that center frequency and bandwidth of shear waves produced through an aberrator would not be as affected as if they were produced through an attenuator layer, the latter having more uncertainty in center frequency and bandwidth estimation due to lower motion signal as depicted in Fig. 9. Although the agar phantom is a very elastic material, the implications of these measurements are more important when this transducer is used for measurements in viscoelastic soft tissues.
There are a few limitations of this study. First, the acoustic pressure measurements are limited to the size of the hydrophone. For instance, although the scans were measured with 0.3 mm spatial resolution, the hydrophone active element size was approximately 1 mm, therefore there were smoothing effects. Moreover because a F/1.0 focal configuration was used and with higher ultrasound frequencies the focus would be considerably small compared to the hydrophone, which would cause discrepancies when comparing the measured acoustic pressures from the Phase Aberration and Attenuation case to the simulation from the Only Attenuation case, as well as not being able to detect much difference in the measured acoustic pressure fields for each push beam frequency. Second, when comparing shear wave displacement measurements to acoustic pressure measurements the ultrasound field of view (FOV) was different, which implies the phase screen and attenuation was also different, but within the tissue sample variation, because it is difficult to position the transducer in the same pathway two consecutively times. Third, in the experimental set-up where two transducers are facing each other, the push from one transducer could create ultrasound reflections that alter the measured displacement. Most likely these ultrasonic reflections would depend highly in the distance between the transducer, the angle of the reflective face and the fact the transducer could not be perfectly aligned, consequently producing lower shear wave motion. We did not observe any obvious reflections in the data with this configuration. Although the limitation of the studies show high variability in the measurements, the study served to demonstrate how phase aberration and attenuation can diminish shear wave motion amplitude and cause considerable variations in shear wave speed measurements, center frequency and bandwidth. This approach provides a reasonable estimate of the effects of attenuation as compared to phase aberration.
There are a few notable contributions of this study for the field of elasticity imaging. It was proposed that phase aberration can affect shear wave speed estimation [15], but this problem has only been addressed by a single small study [13]. We sought to explore the individual effects that phase aberration and attenuation have on the generation of shear waves in a laboratory setting. Phase screen and excised tissue samples were used to explore these effects. It was empirically shown that lower frequency could be used to improve shear wave generation in the face of phase aberration and attenuation, which was alluded to by Palmeri, et al. [15], but not systematically addressed with a formal study. We studied the effects of phase aberration and attenuation in shear wave generation with an F/1.0 focal configuration push beam, which produced a fairly tight focus that was mostly affected by attenuation. This framework may be used with other focal configurations.
Optimal settings for a specific transducer were found, but this study provides a general methodology for assessing the optimal settings for a given transducer and ultrasound system either with an artificial phase screen or ex vivo tissue samples. These results can be extended to tests in humans for particular applications.
V. CONCLUSIONS
This study systematically studied the effects of phase aberration and ultrasound attenuation on shear wave generation using acoustic radiation force. Two tissue samples were used and the time delays through the tissue samples and attenuation of the tissue samples were characterized with ultrasonic measurements. This study showed experimentally that decreasing the push beam frequency when generating shear waves with acoustic radiation force can decrease the effects of overlying tissue phase aberration and attenuation. We evaluate the shear wave displacement, group velocity, center frequency, and bandwidth. The shear wave displacement can be used as a feedback to optimize the push beam frequency. Experiments with phase screens and swine tissue samples showed that shear wave displacement is decreased mostly by attenuation but can be optimized by varying push beam frequencies.
Acknowledgments
The authors are grateful to Dr. Shigao Chen and Dr. Pengfei Song for insightful conversations. This study was supported in part by grants DK092255 and DK082408 from the National Institute of Diabetes and Digestive and Kidney Diseases. The content is solely the responsibility of the authors and does not necessarily represent the official views of the National Institute of Diabetes and Digestive and Kidney Diseases or the National Institutes of Health.
References
- 1.Nightingale KR, Palmeri ML, Nightingale RW, Trahey GE. On the feasibility of remote palpation using acoustic radiation force. Journal of the Acoustical Society of America. 2001 Jul;110:625–634. doi: 10.1121/1.1378344. [DOI] [PubMed] [Google Scholar]
- 2.Sarvazyan AP, Rudenko OV, Swanson SD, Fowlkes JB, Emelianov SY. Shear wave elasticity imaging: A new ultrasonic technology of medical diagnostics. Ultrasound Med Biol. 1998;24:1419–1435. doi: 10.1016/s0301-5629(98)00110-0. [DOI] [PubMed] [Google Scholar]
- 3.Bercoff J, Tanter M, Fink M. Supersonic shear imaging: a new technique for soft tissue elasticity mapping. IEEE Transactions on Ultrasonics Ferroelectrics and Frequency Control. 2004;51:396–409. doi: 10.1109/tuffc.2004.1295425. [DOI] [PubMed] [Google Scholar]
- 4.Chen S, Urban M, Pislaru C, Kinnick R, Yi Z, Aiping Y, Greenleaf J. Shearwave dispersion ultrasound vibrometry (SDUV) for measuring tissue elasticity and viscosity. IEEE Transactions on Ultrasonics Ferroelectrics and Frequency Control. 2009;56:55–62. doi: 10.1109/TUFFC.2009.1005. [DOI] [PMC free article] [PubMed] [Google Scholar]
- 5.O’Donnell M, Flax SW. Phase aberration measurements in medical ultrasound – human studies. Ultrasonic Imaging. 1988 Jan;10:1–11. doi: 10.1177/016173468801000101. [DOI] [PubMed] [Google Scholar]
- 6.Goss SA, Johnston RL, Dunn F. Comprehensive compilation of empirical ultrasonic properties of mammalian-tissues. Journal of the Acoustical Society of America. 1978;64:423–457. doi: 10.1121/1.382016. [DOI] [PubMed] [Google Scholar]
- 7.Hassler P, Krammer D. Measurement of spatial time-of-flight fluctuations of ultrasound pulses passing through inhomogeneous layers. IEEE ultrasonic symposium. 1987 [Google Scholar]
- 8.Sumino Y, Waag RC. Measurements of ultrasonic pulse arrival time differences produced by abdominal-wall specimens. Journal of the Acoustical Society of America. 1991 Dec;90:2924–2930. doi: 10.1121/1.401766. [DOI] [PubMed] [Google Scholar]
- 9.Hinkelman LM, Liu DL, Metlay LA, Waag RC. Measurements of ultrasonic pulse arrival time and energy-level variations produced by propagation through abdominal-wall. Journal of the Acoustical Society of America. 1994 Jan;95:530–541. doi: 10.1121/1.408347. [DOI] [PubMed] [Google Scholar]
- 10.Hinkelman LM, Mast TD, Metlay LA, Waag RC. The effect of abdominal wall morphology on ultrasonic pulse distortion. Part I. Measurements. Journal of the Acoustical Society of America. 1998 Dec;104:3635–3649. doi: 10.1121/1.423946. [DOI] [PubMed] [Google Scholar]
- 11.Pinton GF, Trahey GE, Dahl JJ. Sources of image degradation in fundamental and harmonic ultrasound imaging using nonlinear, full-wave simulations. Ultrasonics, Ferroelectrics, and Frequency Control, IEEE Transactions on. 2011;58:754–765. doi: 10.1109/TUFFC.2011.1868. [DOI] [PMC free article] [PubMed] [Google Scholar]
- 12.Varghese T, Bilgen M, Ophir J. Phase aberration effects in elastography. Ultrasound in Medicine and Biology. 2001 Jun;27:819–827. doi: 10.1016/s0301-5629(01)00379-9. [DOI] [PubMed] [Google Scholar]
- 13.Shi Y, Xie H, Shamdasani V, Fraser J, Robert J-L, Zhou S, Urban MW, Chen S, Greenleaf JF. Phase aberration in Shear Wave Dispersion Ultrasound Vibrometry. 2011 International Ultrasonic Symposium IEEE UFFC. 2011 Oct 18–21;:2408–2411. 2011. [Google Scholar]
- 14.Urban MW, Chen SG, Greenleaf JF. Error in Estimates of Tissue Material Properties from Shear Wave Dispersion Ultrasound Vibrometry. IEEE Transactions on Ultrasonics Ferroelectrics and Frequency Control. 2009 Apr;56:748–758. doi: 10.1109/TUFFC.2009.1097. [DOI] [PMC free article] [PubMed] [Google Scholar]
- 15.Palmeri ML, Wang MH, Dahl JJ, Frinkley KD, Nightingale KR. Quantifying hepatic shear modulus in vivo using acoustic radiation force. Ultrasound in Medicine and Biology. 2008 Apr;34:546–558. doi: 10.1016/j.ultrasmedbio.2007.10.009. [DOI] [PMC free article] [PubMed] [Google Scholar]
- 16.Ogden CL, Carroll MD, Kit BK, Flegal KM. NCHS data brief. Vol. 82. Hyattsville, MD: National Center for Health Statistics; 2012. Prevalence of obesity in the United States, 2009–2010. [PubMed] [Google Scholar]
- 17.Shung KK. Diagnostic Ultrasound: Imaging and Blood Flow Measurements. Taylor & Francis; 2005. [Google Scholar]
- 18.Montaldo G, Tanter M, Bercoff J, Benech N, Fink M. Coherent Plane-Wave Compounding for Very High Frame Rate Ultrasonography and Transient Elastography. IEEE Transactions on Ultrasonics Ferroelectrics and Frequency Control. 2009 Mar;56:489–506. doi: 10.1109/TUFFC.2009.1067. [DOI] [PubMed] [Google Scholar]
- 19.Pinton GF, Dahl JJ, Trahey GE. Rapid tracking of small displacements with ultrasound. Ieee Transactions on Ultrasonics Ferroelectrics and Frequency Control. 2006 Jun;53:1103–1117. doi: 10.1109/tuffc.2006.1642509. [DOI] [PubMed] [Google Scholar]
- 20.Song P, Zhao H, Urban MW, Manduca A, Pislaru S, Kinnick R, Pislaru C, Greenleaf J, Chen S. Improved Shear Wave Motion Detection Using Pulse-Inversion Harmonic Imaging with a Phased Array Transducer. Medical Imaging, IEEE Transactions on. 2013;32:2299–2310. doi: 10.1109/TMI.2013.2280903. [DOI] [PMC free article] [PubMed] [Google Scholar]
- 21.Urban MW, Greenleaf JF. Use of the radon transform for estimation of shear wave speed. The Journal of the Acoustical Society of America. 2012;132:1982–1982. [Google Scholar]
- 22.Hah Z, Hazard C, Mills B, Barry C, Rubens D, Parker K. Integration of Crawling Waves in an Ultrasound Imaging System. Part 2: Signal Processing and Applications. Ultrasound in Medicine & Biology. 2012;38:312–323. doi: 10.1016/j.ultrasmedbio.2011.10.014. [DOI] [PMC free article] [PubMed] [Google Scholar]
- 23.Palmeri ML, Deng Y, Rouze NC, Nightingale KR. Dependence of shear wave spectral content on acoustic radiation force excitation duration and spatial bandwidth. UFFC Ultrasonics Simposyum. 2014 [Google Scholar]
- 24.Duck FA. Physical properties of tissue: a comprehensive reference book: Academic Press. 1990 [Google Scholar]
- 25.McGough RJ. Rapid calculations of time-harmonic nearfield pressures produced by rectangular pistons. Journal of the Acoustical Society of America. 2004 May;115:1934–1941. doi: 10.1121/1.1694991. [DOI] [PMC free article] [PubMed] [Google Scholar]
- 26.Chen D, McGough RJ. A 2D fast near-field method for calculating near-field pressures generated by apodized rectangular pistons. Journal of the Acoustical Society of America. 2008 Sep;124:1526–1537. doi: 10.1121/1.2950081. [DOI] [PMC free article] [PubMed] [Google Scholar]
- 27.Zeng XZ, McGough R. Evaluation of the angular spectrum approach for simulations of near-field pressures. Journal of the Acoustical Society of America. 2008 Jan;123:68–76. doi: 10.1121/1.2812579. [DOI] [PMC free article] [PubMed] [Google Scholar]


