

Abstract
Aims
β-Secretase 1 (BACE1) is a key enzyme in Alzheimer’s disease pathogenesis that catalyses the amyloidogenic cleavage of amyloid precursor protein (APP). Recently, global Bace1 deletion was shown to protect against diet-induced obesity and diabetes, suggesting that BACE1 is a potential regulator of glucose homeostasis. Here, we investigated whether increased neuronal BACE1 is sufficient to alter systemic glucose metabolism, using a neuron-specific human BACE1 knockin mouse model (PLB4).
Methods
Glucose homeostasis and adiposity were determined by glucose tolerance tests and EchoMRI, lipid species were measured by quantitative lipidomics, and biochemical and molecular alterations were assessed by western blotting, quantitative PCR and ELISAs. Glucose uptake in the brain and upper body was measured via 18FDG-PET imaging.
Results
Physiological and molecular analyses demonstrated that centrally expressed human BACE1 induced systemic glucose intolerance in mice from 4 months of age onward, alongside a fatty liver phenotype and impaired hepatic glycogen storage. This diabetic phenotype was associated with hypothalamic pathology, i.e. deregulation of the melanocortin system, and advanced endoplasmic reticulum (ER) stress indicated by elevated central C/EBP homologous protein (CHOP) signalling and hyperphosphorylation of its regulator eukaryotic translation initiation factor 2α (eIF2α). In vivo 18FDG-PET imaging further confirmed brain glucose hypometabolism in these mice; this corresponded with altered neuronal insulin-related signalling, enhanced protein tyrosine phosphatase 1B (PTP1B) and retinol-binding protein 4 (RBP4) levels, along with upregulation of the ribosomal protein and lipid translation machinery. Increased forebrain and plasma lipid accumulation (i.e. ceramides, triacylglycerols, phospholipids) was identified via lipidomics analysis.
Conclusions/interpretation
Our data reveal that neuronal BACE1 is a key regulator of metabolic homeostasis and provide a potential mechanism for the high prevalence of metabolic disturbance in Alzheimer’s disease.
Electronic supplementary material
The online version of this article (doi:10.1007/s00125-016-3960-1) contains peer-reviewed but unedited supplementary material, which is available to authorised users.
Keywords: 18FDG-PET, Ceramide, ER stress, Glucose homeostasis, Insulin signalling, Neuronal BACE1
Introduction
The incidence of type 2 diabetes and Alzheimer’s disease is rising at an alarming rate. Type 2 diabetes increases the risk of Alzheimer’s disease [1]; however, systemic glucose intolerance and insulin resistance are also reported in dementia patients without a history of diabetes [2]. Alzheimer’s disease brains exhibit defective neuronal insulin signalling [3] and glucose hypometabolism in 2-[18F]fluoro-2-deoxy-d-glucose positron emission tomography (18FDG-PET) studies [4]. Further, mouse models of both diseases share similar cognitive phenotypes [5], and increased susceptibility to high-fat diet (HFD)-induced diabetes is observed in Alzheimer mouse models compared with controls [6]. Collectively, the overlapping pathology indicate common pathogenic factors, although their molecular foundations remain unclear.
β-Secretase 1 (BACE1) is implicated in Alzheimer’s disease as the enzyme responsible for the rate-limiting step in β-amyloid (Aβ) production [7]. Brain BACE1 levels increase with age [8], particularly in Alzheimer’s disease [9], and following pathological events [10, 11]. Bace1 deletion abolishes Aβ deposition and rescues cognitive deficits in APP mutant mice [12]. We recently confirmed that neuron-specific knockin of human (h)BACE1 induces Aβ accumulation, promotes brain inflammation and recapitulates Alzheimer’s disease-like phenotypes in mice in the absence of mutant APP expression [13], suggesting that BACE1 represents a molecular risk factor for sporadic Alzheimer’s disease.
Although studied principally for its role in amyloidosis, BACE1 has multiple substrates other than APP [14], comprising transmembrane proteins involved in intercellular signalling. BACE1 expression is predominantly neuronal, although BACE1 mRNA is also found in the liver, skeletal muscle and pancreas [15], with pancreatic mRNA encoding an inactive isoform [7, 16]. A potential role for BACE1 in metabolic regulation has only recently emerged, as Bace1 knockout improved glucose metabolism and protected mice from HFD-induced obesity and diabetes [17]. Conversely, the induction of insulin deficiency via systemic streptozotocin (STZ) injection raised central BACE1 levels [18], and this was associated with endoplasmic reticulum (ER) stress [19]. Thus, BACE1 may contribute to metabolic regulation; however, it remains to be established whether BACE1 mediates the association between type 2 diabetes and Alzheimer’s disease.
To elucidate the contribution of neuronal BACE1 to systemic glucose regulation and lipid metabolism, we characterised central and peripheral metabolic changes in brain-specific hBACE1 (PLB4) knockin mice [13]. Because global deletion of Bace1 protected mice from diet-induced diabetes [17], we hypothesised that neuronal BACE1 may regulate system metabolism in addition to inducing brain pathologies relevant to Alzheimer’s disease [13]. We provide evidence that BACE1-induced hypothalamic dysregulation causes systemic diabetes, which may explain the high comorbidity of diabetes and Alzheimer’s disease in ageing populations.
Methods
Animals
All animals were housed and tested in accordance with European (Directive on the Protection of Animals used for Scientific Purposes, 2010/63/EU) and UK Home Office regulations, experiments were approved by the University of Aberdeen Ethics Board and performed in accordance with the Animal (Scientific Procedures) Act 1986 and following Animal Research: Reporting of In Vivo Experiments (ARRIVE) guidelines. The transgenic PLB4 and WT lines were generated and bred as previously described [13], experimenters were not blinded to genotype. All mice were housed in single sex groups, unless food and water consumption was being measured. Physiological assessments were performed in male mice at 3, 4, 5 and 8 months of age. All mice were killed by neck dislocation. Five-hour-fasted mice aged 3 and 8 months were used for liver assays, and all postmortem molecular analyses of signalling pathways (western blotting and quantitative real-time PCR [qPCR]) were performed using samples from 8-month-old mice. Glucose-stimulated insulin secretion (GSIS) was determined in 4-month-old mice at 0, 15 and 30 min time points during glucose tolerance tests (GTTs). Blood leptin content was determined from baseline reading at 3, 4 and 8 months in a 5 h fasted state. EchoMRI scans (EchoMRI, Houston, TX, USA) were performed on mice at ages 4, 5 and 8 months. Additional 6-month-old mice were used for lipidomic analysis and 18FDG-PET imaging. Body weights were recorded and food and water consumption (in g) were measured for 2 weeks in 5- and 8-month-old male mice.
Metabolic measurements
Tail blood glucose was determined using an AlphaTRAK glucometer (Berkshire, UK). GTTs were performed (as described in [6, 20]) in 5-h fasted male mice at age 3 (WT, n = 4; PLB4 n = 7), 4 (WT, n = 8; PLB4, n = 7), 5 (WT, n = 9; PLB4, n = 15) and 8 (WT, n = 4; PLB4 n = 4) months. Fasting blood glucose was determined at baseline (time 0) before i.p. injection of bolus glucose (20%; 2 g/kg body weight). Blood glucose clearance was assessed at 15, 30, 60 and 90 min post injection in 3-, 5- and 8-month-old mice; and at 0, 15 and 30 min post injection in 4-month-old mice.
Serum immunoassays
Tail- or trunk-derived blood was collected from 5-h fasted mice aged 3 (WT, n = 6; PLB4, n = 8), 4 (WT, n = 7; PLB4, n = 8), 5 (WT, n = 9; PLB4, n = 12) and 8 (WT, n = 8; PLB4, n = 10) months into serum separator microtubes; serum was used for insulin and leptin determination (Insulin ELISA, Millipore, Darmstadt, Germany; leptin ELISA, CrystalChem, Zaandam, the Netherlands). A multiplex assay (customer-designed mouse metabolic hormone Magnetic Multiplex Assay; Merck Millipore, Darmstadt, Germany) was used for the simultaneous quantification of leptin, amylin (active form), C-peptide 2, glucose-dependent insulinotropic peptide (GIP; total), pancreatic polypeptide, peptide tyrosine tyrosine (PYY), IL-6 and resistin following the manufacturer’s instructions. Triacylglycerol and glycogen assays were used as previously described [20].
Comparative lipidomics plasma and brain analyses
Frozen plasma and forebrain samples from 6-month-old male mice (WT, n = 8; PLB4, n = 8) were used for global lipid analysis using liquid chromatography–mass spectroscopy (LC–MS). Plasma lipids were extracted from samples according to the Folch method. Lipids were solvent extracted in methanol/chloroform (2:1 vol./vol.). The lipid extracts were subsequently analysed by LC–MS in positive and negative ion modes with a C18 column and a water/acetonitrile/isopropanol gradient using an Exactive Orbitrap system (Thermo Scientific, Hemel Hempstead, UK) . Lipidomic datasets were processed using Progenesis QI software (version 2.0, Non-Linear Dynamics, Newcastle upon Tyne, UK) and searched against LIPID MAPS (www.lipidmaps.org/) and the Human Metabolome Database (www.hmdb.ca/).
Brain and upper body PET/CT imaging
Six-month-old female mice (WT, n = 10; PLB4, n = 9) were imaged using an Argus GE dual ring PET/CT scanner (Sedecal, Madrid, Spain) using our published protocol [21].
Immunoblotting
All tissues were lysed in RIPA buffer [as described in [6]. Tissue from 5-h fasted mice was immunoblotted using rabbit polyclonal antibodies diluted 1:1000 in TRIS-buffered saline containing Tween-20, 5% BSA and 0.05% sodium azide. Antibodies raised against human BACE1 (C-terminal 485–501; no. 195111, Calbiochem, UK); phospho-protein kinase B (p-AktSer473; no. 4060), total Akt (Akt; no. 9272), phospho-glycogen synthase kinase-3β (p-GSK-3βSer21/9; no. 9331), phospho-ribosomal protein S6 (p-rpS6Ser235–236; no. 4858), total rpS6 (rpS6; no. 2217), phospho-S6 kinase (p-S6KThr389; no. 9234), total S6 kinase (S6K; no. 2708), phospho-mammalian target of rapamycin (p-mTORSer2448; no. 5536), mTOR (no. 2983), phospho-glycogen synthase (p-GSSer641; no. 3891), phospho-eukaryotic translation initiation factor 2α (p-eIF2αSer51; no. 3398), total eIF2α (no. 5324), protein kinase RNA-like ER kinase (PERK; no. 5683; all obtained from Cell Signaling Technology, Leiden, the Netherlands); insulin receptor β (IRβ; C-19, no. Sc-711; 1:500 dilution), apolipoprotein (ApoE; no. Sc-6384), mouse monoclonal protein tyrosine phosphatase 1B (PTP1B; no. Sc-14021), C/EBP homologous protein (CHOP; also known as GAD153, no. Sc-7351; Santa Cruz, Heidelberg, Germany); and retinol-binding protein 4 (RBP4; no. A0040, Dako, Glastrup, Denmark) were used following manufacturer’s instructions and as described before [6, 13]. Coomassie Blue (PhastGel Blue R; GE Healthcare, Watford, UK) was used as a loading control [13, 22].
Gene expression
RNA was extracted from frozen hypothalamic and cortical samples using TRI Reagent, as previously described [23]. Target genes (hBACE1 and mouse Pomc, Mc4R, Npy, LepR, Ptp1b, Chop, Cd11 and Cd68) were amplified by qPCR using GoTaq Master Mix (Promega, Madison, WI, USA). The geometric mean of three commonly used reference mRNAs (Ywhaz, Nono and Actb) was used to normalise data.
Statistical analysis
Prism 5 (GraphPad, La Jolla, CA, USA) was used for statistical analyses, and data are expressed as the means ± SEM. All molecular and genetic data were adjusted to loading controls or housekeeping genes and calculated relative to WT. Two-tailed t tests with Welch’s correction were used for unbiased comparisons between transgenic mice and controls. Group analyses used two-way ANOVA (with repeated measures where appropriate), followed by Bonferroni post hoc tests.
Results
Systemic glucose homeostasis is impaired in PLB4 mice
We first confirmed that human BACE1 expression was brain specific (Fig. 1a,b) and then established that body weights were normal in PLB4 mice aged up to 4 months (Fig. 1c) but decreased compared with wild-type (WT) controls at 5 and 8 months. Food and water intake adjusted to body weight were not affected (Fig. 1d,e). Despite the lean phenotype, adipose tissue mass was mildly increased in PLB4 mice vs WT at 4 and 8 months of age (Fig. 1f), while lean mass was unaffected (Fig. 1g), as demonstrated by EchoMRI. Furthermore, 5-h fasted PLB4 mice exhibited elevated blood glucose levels, progressive severe glucose intolerance (Fig. 1h–k) and impaired GSIS from 4 months of age (Fig. 1m,n). Serum insulin levels were also raised (hyperinsulinaemia) at 5 months but were similar to WT levels at 8 months (Fig. 1l), despite continued hyperglycaemia. Serum NEFA were increased in 3-month-old PLB4 mice, although this was not statistically significant (p = 0.06), and were comparable between groups at 8 months of age (Fig. 1o).
Fig. 1.
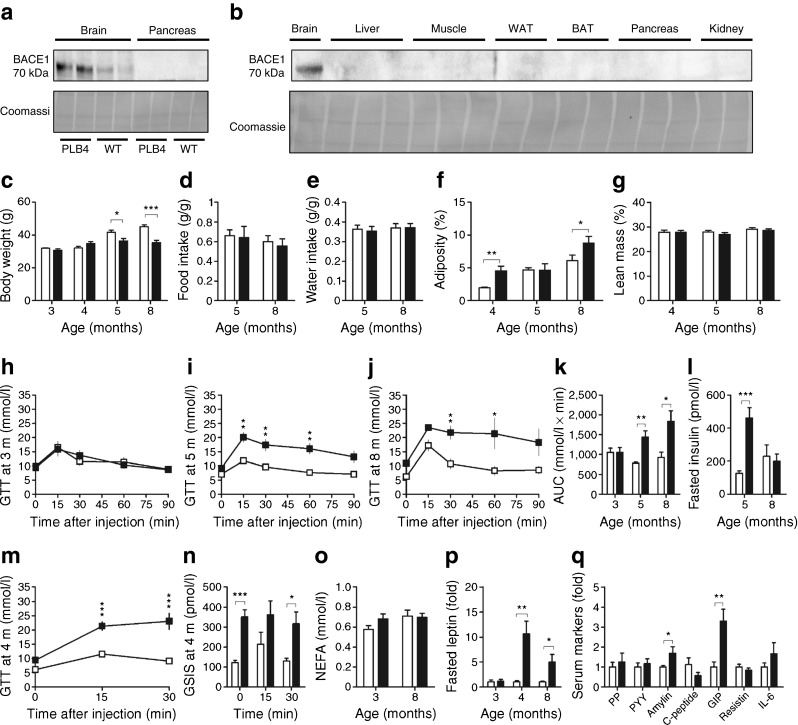
Systemic diabetes in neuronal hBACE1 knockin mice. (a) BACE1 protein content in soluble lysates from neuronal and pancreatic tissues from PLB4 and WT mice. (b) BACE1 protein screening in other tissue types from PLB4 mice only. (c) Body weight of WT and PLB4 mice at 3, 4, 5 and 8 months (m) of age. (d, e) Normalised food (d) and water (e) intake in 5- and 8-month-old mice. (f, g) Body composition data obtain from EchoMRI scans showing adipose (f) and lean mass (g) in mice aged 4, 5 and 8 months. (h–j) GTTs at age 3 (p > 0.05), 5 (p < 0.01) and 8 (p < 0.05) months (m). (k) Total glucose excursions during GTTs. (l) Fasted serum insulin concentrations in 5- and 8-month-old PLB4 and WT mice. (m) GTTs in 4-month-old mice (p < 0.001; onset of defective glucose disposal). (n) GSIS in 4-month-old mice during GTTs. (o) Serum NEFA at 3 and 8 months of age. (p) Fasted serum leptin levels in PLB4 vs WT mice at 3, 4 and 8 months of age. (q) Serum markers detected in 8-month-old PLB4 mice using an enzymatic multiplex assay. White bars, WT mice; black bars, PLB4 mice. Data represent means + SEM or (p, q) means + SEM normalised to WT values. *p < 0.05, **p < 0.01, ***p < 0.001
Altered plasma metabolic homeostasis and hyperleptinaemia
Levels of the adipocyte-derived hormone, leptin, which strongly correlate with obesity and diabetes, were initially normal in PLB4 mice, but were drastically elevated at 4 and 8 months (Fig. 1p) when adiposity was increased.
Since body mass and long-term energy expenditure are tightly regulated by complex signalling networks between the CNS and peripheral systems, we screened serum samples from 8-month-old PLB4 mice for markers of homeostatic control using a multiplex assay (Fig. 1q). Concentrations of fasting C-peptide were low, indicative of defective proinsulin synthesis, while amylin levels (co-secreted with insulin) were enhanced. GIP was also upregulated in PLB4 mice compared with controls.
Impaired hepatic glycogen synthesis, insulin resistance and fatty liver phenotype
Evidence of failing glucose storage in mice expressing hBACE1 was indicated by their reduced hepatic glycogen levels (Fig. 2a), increased hepatic triacylglycerol content (Fig. 2b) and inability to activate (i.e. dephosphorylate) GS in response to hyperglycaemic conditions (Fig. 2c,d). Heightened translational demand was also identified in PLB4 hepatocytes, suggested by increased phosphorylation of the rpS6 component of 40S ribosomes (Fig. 2c,d). Additionally, the ApoE, PTP1B and RBP4 lipometabolic regulators linked with obesity and insulin resistance [6, 24, 25] were upregulated in PLB4 mouse liver (Fig. 2c,d), suggesting decreased hepatic insulin sensitivity. Levels of these regulators were unchanged in white adipose tissue (WAT) and muscle (Fig. 2e–h).
Fig. 2.

Hepatic pathology induced by brain-specific hBACE1 knockin. (a) Hepatic glycogen content of 3- and 8-month-old PLB4 and control mice. (b) Triacylglycerol concentrations of liver tissue from 3- and 8-month-old PLB4 and WT mice. (c) Representative immunoblots showing insulin signalling related markers in liver tissue from 8-month-old WT and PLB4 mice, and (d) quantification of the relative protein content. (e) Representative IRβ, RBP4 and ApoE immunoblots of WAT, and (f) quantification of relative protein content. (g) Hindlimb skeletal muscle immunoblots and (h) quantification of relative protein content. (d, f, h) PLB4 values are normalised to WT values. White bars, WT mice; black bars, PLB4 mice. Data show means + SEM. *p < 0.05, **p < 0.01
Dysregulated central and plasma lipid composition
The non-alcoholic fatty liver phenotype of PLB4 mice corresponded to that observed in human type 2 diabetes [26], and called for further investigation of putative changes in lipid metabolism. Altered lipid composition was recently proposed to predict ‘phenoconversion’ from mild cognitive impairment to Alzheimer’s disease, potentially offering a novel biomarker [27]. Hence, we applied a comparative global lipidomics approach and identified 321 altered species in PLB4 mice vs controls (see Table 1 for a summary and electronic supplementary material Tables 1–4 for details) comprising phospholipids, sphingomyelins and sphingolipids such as ceramides. Phospholipids such as phosphatidylethanolamine, lysophosphatidylethanolamine and phosphatidylserine were predominantly increased in both the brain and plasma; however only 11% of the altered lipid species were identical in both sample types. Fewer changes in lipid composition were detected in plasma samples than in brain samples.
Table 1.
Summary of the brain and plasma lipid species altered in PLB4 mice
| Lipid species | ↑ Increased vs WT | ↓ Decreased vs WT | ||||
|---|---|---|---|---|---|---|
| Brain | Plasma | BvsP match, n (%) | Brain | Plasma | BvsP match, n (%) | |
| Phospholipids | 116 | 77 | 24 (12) | 17 | 11 | 0 |
| PC and lysoPC | 40 | 31 | 14 (20) | 7 | 6 | 0 |
| PE and lysoPE | 36 | 20 | 5 (9) | 7 | 4 | 0 |
| PG | 6 | 1 | 0 | 0 | 0 | 0 |
| PS | 23 | 19 | 3 (7) | 3 | 1 | 0 |
| PI | 10 | 5 | 2 (13) | 0 | 0 | NA |
| Other | 1 | 1 | 0 | 0 | 0 | NA |
| Sphingomyelin | 10 | 10 | 7 (35) | 1 | 0 | 0 |
| Sphingolipids | 29 | 8 | 0 | 3 | 6 | 0 |
| Ceramides | 20 | 7 | 0 | 3 | 3 | 0 |
| Other | 9 | 1 | 0 | 0 | 3 | 0 |
| Diacylglycerols | 10 | 3 | 2 (15) | 1 | 1 | 0 |
| Triacylglycerols | 31 | 12 | 0 | 2 | 3 | 0 |
| Total determined | 196 | 110 | 33 (11) | 24 | 21 | 0 |
Data show the numbers of lipids significantly (p < 0.05) up- or downregulated in 6-month-old PLB4 mice relative to age-matched WT controls
Brain vs plasma comparison (BvsP): overlap of altered lipid species between brain and plasma tissue in PLB4 mice; PC, phosphatidylcholine; PE, phosphatidylethanolamine; PG, phosphatidylglycerol; PI, phosphatidylinositol; PS, phosphatidylserine
Reduced brain glucose metabolism
To further investigate whether the diabetic and metabolic phenotype of PLB4 mice was similar to that of human type 2 diabetes and dementia, we conducted an in vivo 18FDG-PET study (Fig. 3). and confirmed global cerebral hypometabolism in PLB4 mice vs WT controls at the symptomatic age of 6 months. In contrast to that of the brain, the metabolic activity of brown adipose tissue (BAT) was drastically enhanced, while cardiac metabolism did not differ between groups. As BAT activation is inversely related to body weight and obesity, the hypermetabolic readouts in PLB4 mice are consistent with their leaner phenotype [28] and indicative of a compensatory metabolic adjustment. Collectively, these data confirm that PLB4 mice have a diabetes-like phenotype.
Fig. 3.

Abnormal glucose metabolism in PLB4 mice, as measured by 18FDG-PET imaging. (a) Representative scan illustrating glucose uptake based on 18FDG-PET imaging in brain and BAT. (b) Quantification of upper body glucose uptake for the brain, heart and BAT. (c) Statistical parametric mapping shows reduced regional T scores (0–6) for brain metabolism in PLB4 vs WT animals. (d) Quantification of regional brain glucose uptake in WT and PLB4 mice. cBS, caudal brainstem; Cort, cortex; Cere, cerebellum; HC, hippocampus; Hypo, hypothalamus; STR, striatum; SUV, standardised uptake value. White bars, WT mice; black bars, PLB4 mice. Data show means + SEM. *p < 0.5, **p < 0.01, ***p < 0.001
Abnormal neuronal insulin signalling
Since hBACE1 was expression was forebrain specific, we next investigated whether neuronal insulin signalling was affected in symptomatic PLB4 mice by probing for markers of the insulin IR–Akt–GSK-3β transduction pathway (Fig. 4) in forebrain lysates of 8-month-old fasted mice. Total IR was upregulated in PLB4 vs WT mice, together with RBP4, thus corroborating links with insulin resistance [29]. PTP1B levels were also increased, indicating downregulation of central insulin and leptin signalling [6, 24]. There were no differences in brain levels of Akt between PLB4 and WT mice, but trends for decreased baseline GSK-3β phosphorylation in PLB4 mice indicated early neuronal disinhibition of this pro-apoptotic kinase. Targets downstream of mTOR were also altered: although levels of mTOR did not differ in PLB4 forebrain vs controls, we detected increased levels of rpS6 and its kinase S6K, implying an overall increase in translational demand consistent with elevated brain lipid synthesis in PLB4 mice.
Fig. 4.
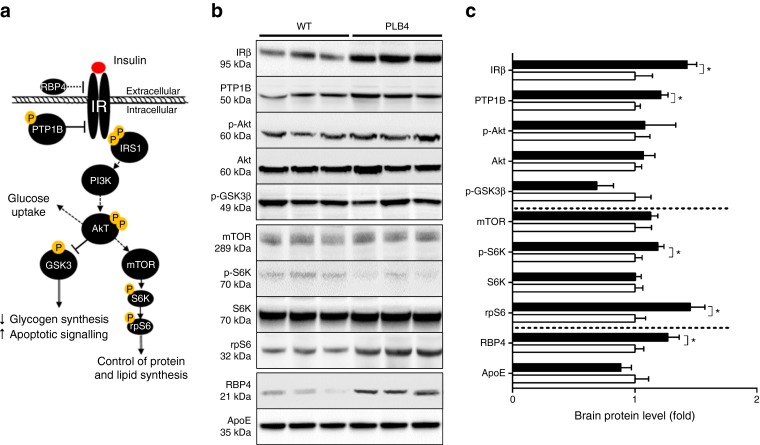
Defective neuronal insulin sensitivity in PLB4 mice. (a) Simplified schematic showing insulin signalling. (b) Representative immunoblots of insulin-related markers in brain lysates from 8-month-old PLB4 and WT mice and (c) quantification of their relative expression. White bars, WT mice; black bars, PLB4 mice. Data are means + SEM normalised to WT values. *p < 0.05
Altered hypothalamic melanocortin transcription and ER stress
As the hypothalamus is the regulatory brain centre for metabolic control, we reasoned that its malfunction was a possible cause of the failing insulin signalling and diabetic phenotype of PLB4 mice. Hypothalamic function was assessed via gene expression analysis of neuro- and polypeptides that regulate the hypothalamic–pituitary–adrenal axis (Fig. 5a–c). Transcription of the appetite-suppressing pro-opiomelanocortin (Pomc) gene was drastically increased in PLB4 mice compared with controls. POMC-positive neurons respond to leptin or insulin to reduce food intake and maintain energy homeostasis via secretion of alpha melanocyte-stimulating hormone (αMSH) and melanocortin receptor 4 (MC4R). A consistent increase in Mc4r gene expression was detected in the PLB4 vs WT hypothalamus, suggesting a shift toward anorectic signalling in mouse brains expressing hBACE1. Importantly, hypothalamic ER stress (see Fig. 5d) was confirmed by a drastic rise in Chop transcription in PLB4 tissue compared with controls. Corresponding protein levels were also increased (Fig. 5e,f), as was phosphorylated (i.e. activated) eIF2α, a major CHOP regulator. These changes were not associated with transcriptional alterations in inflammatory markers (microglial Cd11 and Cd68).
Fig. 5.
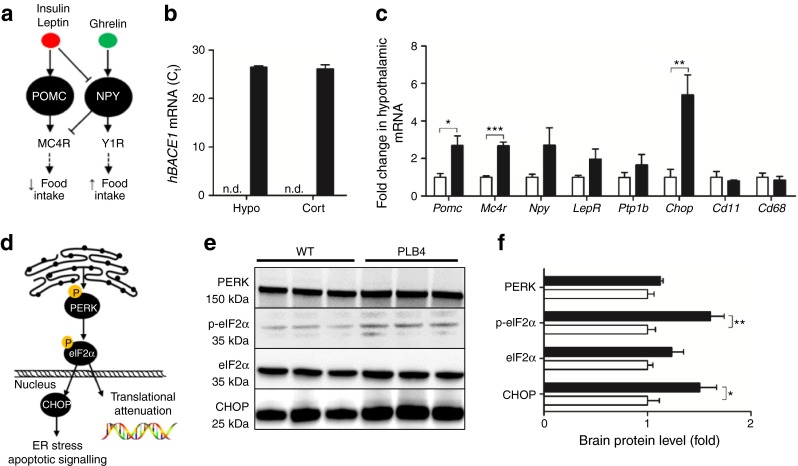
Hypothalamic pathology and neuronal ER stress induced by hBACE1 knockin. (a) Simplified schematic showing anabolic and catabolic signalling in the hypothalamus. MC4R, melanocortin 4 receptor; NPY, neuropeptide Y; POMC, pro-opiomelanocortin; Y1R, neuropeptide Y1 receptor. (b) BACE1 mRNA levels (raw Ct values) in PLB4 hypothalamic (Hypo) and cortical (Cort) brain fractions. Signal was not detected (n.d.) in WT mice. (c) Fold changes in the hypothalamic mRNA expression of genes related to appetite suppression (Pomc, Mc4r), appetite stimulation (Npy), leptin and insulin sensitivity (LepR, Ptp1b), ER stress (Chop), and microglial inflammation (Cd11 and Cd68) in 8-month-old PLB4 mice. (d) Simplified schematic of the ER stress pathway. (e) Representative immunoblots of ER stress markers in brain lysates from 8-month-old mice and (f) quantification of their relative expression. White bars, WT mice; black bars, PLB4 mice. Data represent the means + SEM normalised to WT values. *p < 0.05, **p < 0.01, ***p < 0.001
Discussion
Diabetic complications can lead to cognitive dysfunction and are acknowledged risk factors of Alzheimer’s disease, but little is known about the reverse scenario. Here, we demonstrate that the major amyloidogenic enzyme, BACE1, is sufficient to increase the risk of diabetes development when expressed in neurons only. Severe impairment in systemic glucose homeostasis and insulin sensitivity was evident in PLB4 mice from the age of 4 months onwards and progressively deteriorated with age. We previously reported that PLB4 mice develop mild cognitive deficits between 4 and 6 months. Our current findings therefore indicate that neuronal BACE1 induces global metabolic dysregulation along with brain inflammation and amyloidosis-related cognitive decline. Overall, the diabetic profile of PLB4 mice agrees with the improved glucose clearance and insulin sensitivity in mice lacking murine Bace1 globally [17, 30], but pinpoints neuronal BACE1 as the major driver of this alteration.
Although both Bace1 knockout and our hBACE1 knockin mice were leaner compared with WT controls, there were differential effects on adiposity and leptin signalling. Deletion of Bace1 decreased adiposity and improved sensitivity to leptin, while neuronal hBACE1 expression promoted adipogenesis and induced hyperleptinaemia. Hence, it seems plausible that manipulation of (neuronal) BACE1 affects body weight via changing metabolic efficiency, adipose composition and signalling. Importantly, leptin production and signalling are regulated by neuronal PTP1B [24]. We propose that the elevated central PTP1B expression in PLB4 forebrains may explain the hyperleptinaemic profile and compensatory BAT hyperactivity in these mice, which confirms that leptin has opposing effects on WAT and BAT [31].
Further, while proinsulin synthesis appeared unchanged in PLB4 mice compared with controls, heightened levels of amylin indicate an attempt to downregulate hyperglycaemia in the insulin-deficient state, and suggests that pancreatic function was at least partially preserved in 8-month-old PLB4 mice. Glucose intolerance and the fatty liver phenotype in PLB4 mice were further associated with drastically elevated levels of serum GIP. Although GIP exhibits insulinotropic properties under physiological conditions, its incretin effects are thought to be blunted in the diabetic state, and elevated levels may promote fatty acid accumulation and induction of proinflammatory cytokines [32].
The fatty liver phenotype of PLB4 mice corresponded with high plasma triacylglycerol and elevated levels of phospholipids such as phosphatidylcholine and lysophosphatidylcholine, which are typically observed in type 2 diabetic patients [26]. Altered plasma lipid composition was also recently proposed to predict early memory impairments, thus potentially offering a novel approach to identify Alzheimer’s disease [27, 33, 34].
Although lipid accumulation was also affected in neuronal tissue from symptomatic PLB4 mice, there was a poor species match for plasma, suggesting that (1) plasma markers may not be indicative of changes in brain lipid composition and (2) that the increase in neuronal lipids probably originated from the CNS. PLB4 mice had pronounced elevation of several classes of phospholipids such as phosphatidylethanolamine, lysophosphatidylethanolamine and phosphatidylserine, which are major components of neuronal membrane bilayers. Such alterations are reported in human Alzheimer’s disease brains [35] and are proposed to affect mitochondrial function, signal transduction and receptor activation, hence interfering with neurotransmission and neuronal integrity [36, 37].
Importantly, brain ceramide levels were substantially increased in PLB4 mice compared with controls. This sphingomyelin precursor is of particular interest because it increases naturally with age [38] and at an early stage of human Alzheimer’s disease [39]. Furthermore, ceramides were previously shown to regulate BACE1 protein expression and promote APP β-site cleavage [40]. Although the mechanisms through which BACE1 may upregulate ceramide accumulation are largely unknown, initial evidence suggests that Aβ peptides may activate sphingomyelinase [41]. It therefore seems plausible that the introduction of BACE1 promotes ceramide biogenesis, and vice versa. In support of this, a recent study demonstrated that intracerebroventricular ceramide infusions induce lipotoxicity and hypothalamic ER stress associated with increased eIF2α and PERK phosphorylation, sympathetic inhibition, reduced weight gain and altered energy balance in rats [42].
Cerebral hypometabolism revealed via 18FDG-PET imaging is common in early dementia patients as well as diabetic patients with or without mild cognitive impairment [43], and may ultimately contribute to cognitive pathology. We found that reduced glucose utilisation in PLB4 mice was associated with poor neuronal insulin sensitivity. Altered IR and PTP1B expression occurred in PLB4 mice at an advanced stage of systemic insulin resistance, hepatic dysfunction and Aβ-associated cognitive impairment [13]. Similar elevations in neuronal PTP1B were observed in response to HFD feeding in other Alzheimer’s disease models [6], while deletion of neuronal PTP1B improved IR signalling and protected against HFD-induced obesity and insulin resistance [24].
Increased S6K phosphorylation in PLB4 vs WT brains and elevated expression of its substrate, rpS6, suggest an increased demand for protein and lipid synthesis. Additionally, the ribosomal element is regulated by eIF2, offering an alternative route for its modification [44]. Elevated rpS6 phosphorylation along with increased brain RBP4 levels were previously found in Alzheimer’s disease mice on a HFD [6]. Neuronal pathways that mediate RBP4’s action and toxicity are yet to be investigated, but have been linked to proinflammatory cytokines in macrophages and to activation of JNK, a major ER stress kinase [29].
Recent studies revealed reduced hypothalamic volume and accelerated atrophy of orexin neurons in early Alzheimer’s disease [45, 46]. In contrast to diet-induced obese and diabetic models, PLB4 mice displayed increased Pomc and Mc4r mRNA levels, suggesting a hypothalamic shift toward appetite suppression and increased energy expenditure. The increase in hypothalamic Mc4r and Pomc transcription in PLB4 mice further contrasts with the recently demonstrated Aβ-oligomer-induced elevation in Npy mRNA (but not in Pomc mRNA), which was not associated with changes in circulating leptin levels [47]. Here, elevated melanocortin transcription in the hypothalamus of PLB4 mice may be a downstream effect of persistently increased circulating levels of leptin and systemic hyperglycaemia.
An advanced state of ER stress was confirmed in the hypothalamus of PLB4 mice, resembling that induced by HFD feeding [48]. Pharmacologically induced hypothalamic ER stress resulted in systemic diabetes in mice [49]; this was also recently illustrated for Aβ oligomer infusions [47]. The pathology of PLB4 mice therefore agrees with a scenario of BACE1-driven elevations of the ER stress marker CHOP and the protein translation regulator eIF2α, which suggest induction of an integrated stress response. Mechanistically, neuronal expression of human BACE1 may promote hypothalamic ER stress via ceramide lipotoxicity, activation of eIF2α and an integrated stress response [42], in addition to driving Aβ production [13].
In conclusion, we demonstrate that neuronal expression of human BACE1 causes systemic diabetic complications. We propose that increased levels of central BACE1 promotes metabolic disturbance via inducing hypothalamic impairment, ER stress, and Aβ and lipid accumulation, leading to neuronal damage, insulin resistance, hepatic deficits and global glucose dyshomeostasis. The comorbid phenotype of the PLB4 mouse provides insight into the complex mechanistic interactions between diabetes and Alzheimer’s disease. As an extension to the hypothesis that diabetic complications promote the onset and progression of Alzheimer’s disease, we suggest that the reverse scenario may also apply.
Electronic supplementary material
Below is the link to the electronic supplementary material.
(PDF 363 kb)
(PDF 126 kb)
(PDF 274 kb)
(PDF 124 kb)
Acknowledgements
The authors thank S. Tammireddy (Diabetes and Cardiovascular Science, University of the Highlands and Islands, Inverness, UK) for technical support with the lipidomics component.
Abbreviations
- Akt
Protein kinase B
- ApoE
Apolipoprotein ε
- APP
Amyloid precursor protein
- BACE1
β-Secretase 1
- BAT
Brown adipose tissue
- CHOP
C/EBP homologous protein
- CNS
Central nervous system
- CT
Computed tomography
- eIF2α
Eukaryotic initiation factor 2α
- ER
Endoplasmic reticulum
- 18FDG-PET
2-[18F]Fluoro-2-deoxy-d-glucose positron emission tomography
- GIP
Glucose-dependent insulinotropic peptide
- GSIS
Glucose-stimulated insulin secretion
- GTT
Glucose tolerance test
- hBACE1
Human BACE1 gene
- HFD
High-fat diet
- IRβ
Insulin receptor β
- mTOR
Mammalian target of rapamycin
- GS
Glycogen synthase
- GSK3β
Glycogen synthase kinase-3 β
- rpS6
Ribosomal protein S6
- S6K
p70-S6 kinase
- PERK
Protein kinase RNA-like ER kinase
- PTP1B
Protein tyrosine phosphatase 1B
- RBP4
Retinol-binding protein 4
- STZ
Streptozotocin
- WAT
White adipose tissue
- WT
Wild-type
Funding
We would like to thank R. Simcox, Romex Oilfield Chemicals, for financial support for KP, and acknowledge additional contributions from the Scottish Alzheimer’s Research UK network for the lipidomics work. The College of Life Science and Medicine, University of Aberdeen, sponsored the imaging study. MD was funded by British Heart Foundation and Diabetes UK; NM was funded by a British Heart Foundation Intermediate Fellowship; KS was funded by a European Foundation for the Study of Diabetes/Lilly programme grant; and RD was funded by an Institute of Medical Sciences PhD studentship.
Duality of interest statement
The authors declare that there is no duality of interest associated with this manuscript.
Contribution statement
BP and MD conceived the study; NM, DK and GR participated in the study design; KP and RD carried out the main experimental work, including western blotting brain and liver samples, physiological glucose experiments and plasma measurements; RD acquired and analysed EchoMRI and liver assay data; KS carried out and analysed the qPCR experiments; PW and MKD conducted the lipidomics study, and analysed brain and plasma lipid composition; MM and AW performed 18FDG-PET imaging and analysed the glucose uptake data; KP, BP and MD performed the final data analysis and interpretation, with significant input from NM, DK and GR; KP, BP and MD co-wrote the paper; and all authors critically revised and approved the final version of the manuscript. BP and MD are responsible for the integrity of this work as a whole.
Contributor Information
Mirela Delibegovic, Email: m.delibegovic@abdn.ac.uk.
Bettina Platt, Email: b.platt@abdn.ac.uk.
References
- 1.Xu W, Von Strauss E, Cx Q, Winblad B, Fratiglioni L. Uncontrolled diabetes increases the risk of Alzheimer’s disease: a population-based cohort study. Diabetologia. 2009;52:1031–1039. doi: 10.1007/s00125-009-1323-x. [DOI] [PubMed] [Google Scholar]
- 2.Janson J, Laedtke T, Parisi JE, O’Brien P, Petersen RC, Butler PC. Increased risk of type 2 diabetes in Alzheimer disease. Diabetes. 2004;53:474–481. doi: 10.2337/diabetes.53.2.474. [DOI] [PubMed] [Google Scholar]
- 3.Talbot K, Wang HY, Kazi H, et al. Demonstrated brain insulin resistance in Alzheimer’s disease patients is associated with IGF-1 resistance, IRS-1 dysregulation, and cognitive decline. J Clin Invest. 2012;122:1316–1338. doi: 10.1172/JCI59903. [DOI] [PMC free article] [PubMed] [Google Scholar]
- 4.Prestia A, Caroli A, Wade SK, et al. Prediction of AD dementia by biomarkers following the NIA-AA and IWG diagnostic criteria in MCI patients from three European memory clinics. Alzheimer’s Dement. 2015;11:1191–1201. doi: 10.1016/j.jalz.2014.12.001. [DOI] [PubMed] [Google Scholar]
- 5.Carvalho C, Machado N, Mota PC, et al. Type 2 diabetic and Alzheimer’s disease mice present similar behavioral, cognitive, and vascular anomalies. J Alzheimer’s Dis. 2013;35:623–635. doi: 10.3233/JAD-130005. [DOI] [PubMed] [Google Scholar]
- 6.Mody N, Agouni A, McIlroy GD, Platt B, Delibegovic M. Susceptibility to diet-induced obesity and glucose intolerance in the APP (SWE)/PSEN1 (A246E) mouse model of Alzheimer’s disease is associated with increased brain levels of protein tyrosine phosphatase 1B (PTP1B) and retinol-binding protein 4 (RBP4), and basal phosphorylation of S6 ribosomal protein. Diabetologia. 2011;54:2143–2151. doi: 10.1007/s00125-011-2160-2. [DOI] [PubMed] [Google Scholar]
- 7.Vassar R, Bennett BD, Babu-Khan S, et al. β-Secretase cleavage of Alzheimer’s amyloid precursor protein by the transmembrane aspartic protease BACE. Science. 1999;286:735–741. doi: 10.1126/science.286.5440.735. [DOI] [PubMed] [Google Scholar]
- 8.Fukumoto H, Cheung BS, Hyman BT, Irizarry MC. β-Secretase protein and activity are increased in the neocortex in Alzheimer disease. Arch Neurol. 2002;59:1381–1389. doi: 10.1001/archneur.59.9.1381. [DOI] [PubMed] [Google Scholar]
- 9.Holsinger RMD, McLean CA, Beyreuther K, Masters CL, Evin G. Increased expression of the amyloid precursor β-secretase in Alzheimer’s disease. Ann Neurol. 2002;51:783–786. doi: 10.1002/ana.10208. [DOI] [PubMed] [Google Scholar]
- 10.Zhang X, Zhou K, Wang R, et al. Hypoxia-inducible factor 1α (HIF-1α)-mediated hypoxia increases BACE1 Expression and β-amyloid generation. J Biol Chem. 2007;282:10873–10880. doi: 10.1074/jbc.M608856200. [DOI] [PubMed] [Google Scholar]
- 11.Walker KR, Kang EL, Whalen MJ, Shen Y, Tesco G. Depletion of GGA1 and GGA3 mediates postinjury elevation of BACE1. J Neurosci. 2012;32:10423–10437. doi: 10.1523/JNEUROSCI.5491-11.2012. [DOI] [PMC free article] [PubMed] [Google Scholar]
- 12.Laird FM, Cai H, Savonenko AV, et al. BACE1, a major determinant of selective vulnerability of the brain to amyloid-β amyloidogenesis, is essential for cognitive, emotional, and synaptic functions. J Neurosci. 2005;25:11693–11709. doi: 10.1523/JNEUROSCI.2766-05.2005. [DOI] [PMC free article] [PubMed] [Google Scholar]
- 13.Plucinska K, Crouch B, Koss D, et al. Knock-in of human BACE1 cleaves murine APP and reiterates Alzheimer-like phenotypes. J Neurosci. 2014;34:10710–10728. doi: 10.1523/JNEUROSCI.0433-14.2014. [DOI] [PMC free article] [PubMed] [Google Scholar]
- 14.Hemming ML, Elias JE, Gygi SP, Selkoe DJ. Identification of beta-secretase (BACE1) substrates using quantitative proteomics. PLoS One. 2009;4(12) doi: 10.1371/journal.pone.0008477. [DOI] [PMC free article] [PubMed] [Google Scholar]
- 15.Huse JT, Byant D, Yang Y, et al. Endoproteolysis of β-secretase (β-site amyloid precursor protein-cleaving enzyme) within its catalytic domain: a potential mechanism for regulation. J Biol Chem. 2003;278:17141–17149. doi: 10.1074/jbc.M213303200. [DOI] [PubMed] [Google Scholar]
- 16.Sinha S, Anderson JP, Barbour R, et al. Purification and cloning of amyloid precursor protein β-secretase from human brain. Nature. 1999;402:537–540. doi: 10.1038/990114. [DOI] [PubMed] [Google Scholar]
- 17.Meakin PJ, Harper AJ, Hamilton DL, et al. Reduction in BACE1 decreases body weight, protects against diet-induced obesity and enhances insulin sensitivity in mice. Biochem J. 2012;441:285–295. doi: 10.1042/BJ20110512. [DOI] [PMC free article] [PubMed] [Google Scholar]
- 18.Guglielmotto M, Aragno M, Tamagno E, et al. AGEs/RAGE complex upregulates BACE1 via Nf-κB pathway activation. Neurobiol Aging. 2012;33:196.e13–196.e27. doi: 10.1016/j.neurobiolaging.2010.05.026. [DOI] [PubMed] [Google Scholar]
- 19.Devi L, Alldred MJ, Ginsberg SD, Ohno M. Mechanisms underlying insulin deficiency-induced acceleration of β-amyloidosis in a mouse model of Alzheimer’s disease. PLoS One. 2012;7 doi: 10.1371/journal.pone.0032792. [DOI] [PMC free article] [PubMed] [Google Scholar]
- 20.Owen C, Lees EK, Grant L, et al. Inducible liver-specific knockdown of protein tyrosine phosphatase 1B improves glucose and lipid homeostasis in adult mice. Diabetologia. 2013;56:2286–2296. doi: 10.1007/s00125-013-2992-z. [DOI] [PubMed] [Google Scholar]
- 21.Platt B, Drever B, Koss D, et al. Abnormal cognition, sleep, EEG and brain metabolism in a novel knock-in Alzheimer mouse, PLB1. PLoS One. 2011;6 doi: 10.1371/journal.pone.0027068. [DOI] [PMC free article] [PubMed] [Google Scholar]
- 22.Welinder C, Ekblad L. Coomassie staining as loading control in western blot analysis. J Proteome Res. 2011;10:1416–1419. doi: 10.1021/pr1011476. [DOI] [PubMed] [Google Scholar]
- 23.McIlroy GD, Delibegovic M, Owen C, et al. Fenretinide treatment prevents diet-induced obesity in association with major alterations in retinoid homeostatic gene expression in adipose, liver, and hypothalamus. Diabetes. 2013;62:825–836. doi: 10.2337/db12-0458. [DOI] [PMC free article] [PubMed] [Google Scholar]
- 24.Bence KK, Delibegovic M, Xue B, et al. Neuronal PTP1B regulates body weight, adiposity and leptin action. Nat Med. 2006;12:917–924. doi: 10.1038/nm1435. [DOI] [PubMed] [Google Scholar]
- 25.Schwartz MW, Woods SC, Porte D, Jr, Seeley RJ, Baskin DG. Central nervous system control of food intake. Nature. 2000;404:661–671. doi: 10.1038/35007534. [DOI] [PubMed] [Google Scholar]
- 26.Taskinen MR, Borén J. New insights into the pathophysiology of dyslipidemia in type 2 diabetes. Atherosclerosis. 2015;239:483–495. doi: 10.1016/j.atherosclerosis.2015.01.039. [DOI] [PubMed] [Google Scholar]
- 27.Mapstone M, Cheema AK, Fiandaca MS, et al. Plasma phospholipids identify antecedent memory impairment in older adults. Nat Med. 2014;20:415–418. doi: 10.1038/nm.3466. [DOI] [PMC free article] [PubMed] [Google Scholar]
- 28.Wang GX, Zhao XY, Lin JD. The Brown fat secretome: metabolic functions beyond thermogenesis. Trends Endocrinol Metab. 2015;26:231–237. doi: 10.1016/j.tem.2015.03.002. [DOI] [PMC free article] [PubMed] [Google Scholar]
- 29.Norseen J, Hosooka T, Hammarstedt A, et al. Retinol-binding protein 4 inhibits insulin signaling in adipocytes by inducing proinflammatory cytokines in macrophages through a c-Jun N-terminal kinase- and Toll-like receptor 4-dependent and retinol-independent mechanism. Mol Cell Biol. 2012;32:2010–2019. doi: 10.1128/MCB.06193-11. [DOI] [PMC free article] [PubMed] [Google Scholar]
- 30.Hoffmeister A, Tuennemann J, Sommerer I, et al. Genetic and biochemical evidence for a functional role of BACE1 in the regulation of insulin mRNA expression. Obesity. 2013;21:E626–E633. doi: 10.1002/oby.20482. [DOI] [PubMed] [Google Scholar]
- 31.Denroche HC, Huynh FK, Kieffer TJ. The role of leptin in glucose homeostasis. J Diabetes Investig. 2012;3:115–129. doi: 10.1111/j.2040-1124.2012.00203.x. [DOI] [PMC free article] [PubMed] [Google Scholar]
- 32.Mells JE, Anannia FA. The role of gastrointestinal hormones in hepatic liver metabolism. Semin Liver Dis. 2013;33:343–357. doi: 10.1055/s-0033-1358527. [DOI] [PMC free article] [PubMed] [Google Scholar]
- 33.González-Domínguez R, García-Barrera T, Gómez-Ariza JL. Metabolomic study of lipids in serum for biomarker discovery in Alzheimer’s disease using direct infusion mass spectrometry. J Pharm Biomed Anal. 2014;98:321–326. doi: 10.1016/j.jpba.2014.05.023. [DOI] [PubMed] [Google Scholar]
- 34.Proitsi P, Kim M, Whiley L, et al. Plasma lipidomics analysis finds long chain cholesteryl esters to be associated with Alzheimer’s disease. Transl Psychiatry. 2015;5 doi: 10.1038/tp.2014.127. [DOI] [PMC free article] [PubMed] [Google Scholar]
- 35.Wood PL, Barnette BL, Kaye JA, Quinn JF, Woltjer RL. Non-targeted lipidomics of CSF and frontal cortex grey and white matter in control, mild cognitive impairment, and Alzheimer’s disease subjects. Acta Neuropsychiatr. 2015;27:270–278. doi: 10.1017/neu.2015.18. [DOI] [PubMed] [Google Scholar]
- 36.Bennett SAL, Valenzuela N, Xu H, Franko B, Fai S, Figeys D. Using neurolipidomics to identify phospholipid mediators of synaptic (dys)function in Alzheimer’s disease. Front Physiol. 2013;4:168. doi: 10.3389/fphys.2013.00168. [DOI] [PMC free article] [PubMed] [Google Scholar]
- 37.Yadav RS, Tiwari NK. Lipid integration in neurodegeneration: an overview of Alzheimer’s disease. Mol Neurobiol. 2014;50:168–176. doi: 10.1007/s12035-014-8661-5. [DOI] [PubMed] [Google Scholar]
- 38.Cutler RG, Kelly J, Storie K, et al. Involvement of oxidative stress-induced abnormalities in ceramide and cholesterol metabolism in brain aging and Alzheimer’s disease. Proc Natl Acad Sci U S A. 2004;101:2070–2075. doi: 10.1073/pnas.0305799101. [DOI] [PMC free article] [PubMed] [Google Scholar]
- 39.Han X, Holtzman DM, McKeel DW, Jr, Kelley J, Morris JC. Substantial sulfatide deficiency and ceramide elevation in very early Alzheimer’s disease: potential role in disease pathogenesis. J Neurochem. 2002;82:809–818. doi: 10.1046/j.1471-4159.2002.00997.x. [DOI] [PubMed] [Google Scholar]
- 40.Puglielli L, Ellis BC, Saunders AJ, Kovacs DM. Ceramide stabilizes β-site amyloid precursor protein-cleaving enzyme 1 and promotes amyloid β-peptide biogenesis. J Biol Chem. 2003;278:19777–19783. doi: 10.1074/jbc.M300466200. [DOI] [PubMed] [Google Scholar]
- 41.Jana A, Pahan K. Fibrillar amyloid-β peptides kill human primary neurons via NADPH oxidase-mediated activation of neutral sphingomyelinase: implications for Alzheimer’s disease. J Biol Chem. 2004;279:51451–51459. doi: 10.1074/jbc.M404635200. [DOI] [PMC free article] [PubMed] [Google Scholar]
- 42.Contreras C, González-García I, Martínez-Sánchez N, et al. Central ceramide-induced hypothalamic lipotoxicity and ER stress regulate energy balance. Cell Rep. 2014;9:366–377. doi: 10.1016/j.celrep.2014.08.057. [DOI] [PMC free article] [PubMed] [Google Scholar]
- 43.Roberts RO, Knopman DS, Cha RH, et al. Diabetes and elevated hemoglobin a1c levels are associated with brain hypometabolism but not amyloid accumulation. J Nucl Med. 2014;55:759–764. doi: 10.2967/jnumed.113.132647. [DOI] [PMC free article] [PubMed] [Google Scholar]
- 44.Kazemi S, Mounir Z, Baltzis D, et al. A novel function of EIF2α kinases as inducers of the phosphoinositide-3 kinase signaling pathway. Mol Biol Cell. 2007;18:3635–3644. doi: 10.1091/mbc.E07-01-0053. [DOI] [PMC free article] [PubMed] [Google Scholar]
- 45.Loskutova N, Honea RA, Brooks WM, Burns JM. Reduced limbic and hypothalamic volumes correlate with bone density in early Alzheimer’s disease. J Alzheimer’s Dis. 2010;20:313–322. doi: 10.3233/JAD-2010-1364. [DOI] [PMC free article] [PubMed] [Google Scholar]
- 46.Fronczek R, Van Geest S, Frölich M, Overeem S, Roelandse FWC, Lammers GJ, et al. Hypocretin (orexin) loss in Alzheimer’s disease. Neurobiol Aging. 2012;33:1642–1650. doi: 10.1016/j.neurobiolaging.2011.03.014. [DOI] [PubMed] [Google Scholar]
- 47.Clarke JR, Lyra E, Silva NM, Figueiredo CP, et al. Alzheimer-associated αβ oligomers impact the central nervous system to induce peripheral metabolic deregulation. EMBO Mol Med. 2015;7:190–210. doi: 10.15252/emmm.201404183. [DOI] [PMC free article] [PubMed] [Google Scholar]
- 48.Çakir I, Cyr NE, Perello M, Litvinov BP, Romero A, Stuart RC, et al. Obesity induces hypothalamic endoplasmic reticulum stress and impairs proopiomelanocortin (POMC) post-translational processing. J Biol Chem. 2013;288:17675–17688. doi: 10.1074/jbc.M113.475343. [DOI] [PMC free article] [PubMed] [Google Scholar]
- 49.Purkayastha S, Zhang H, Zhang G, Ahmed Z, Wang Y, Cai D. Neural dysregulation of peripheral insulin action and blood pressure by brain endoplasmic reticulum stress. Proc Natl Acad Sci U S A. 2011;108:2939–2944. doi: 10.1073/pnas.1006875108. [DOI] [PMC free article] [PubMed] [Google Scholar]
Associated Data
This section collects any data citations, data availability statements, or supplementary materials included in this article.
Supplementary Materials
(PDF 363 kb)
(PDF 126 kb)
(PDF 274 kb)
(PDF 124 kb)