

Abstract
Binocular disparity is detected in the primary visual cortex by a process similar to calculation of local cross-correlation between left and right retinal images. As a consequence, correlation-based neural signals convey information about false disparities as well as the true disparity. The false responses in the initial disparity detectors are eliminated at later stages in order to encode only disparities of the features correctly matched between the two eyes. For a simple stimulus configuration, a feed-forward nonlinear process can transform the correlation signal into the match signal. For human observers, depth judgement is determined by a weighted sum of the correlation and match signals rather than depending solely on the latter. The relative weight changes with spatial and temporal parameters of the stimuli, allowing adaptive recruitment of the two computations under different visual circumstances. A full transformation from correlation-based to match-based representation occurs at the neuronal population level in cortical area V4 and manifests in single-neuron responses of inferior temporal and posterior parietal cortices. Neurons in area V5/MT represent disparity in a manner intermediate between the correlation and match signals. We propose that the correlation and match signals in these areas contribute to depth perception in a weighted, parallel manner.
This article is part of the themed issue ‘Vision in our three-dimensional world’.
Keywords: stereopsis, three-dimensional perception, binocular disparity, correspondence problem, reversed depth perception, random-dot stereogram
1. Introduction
The world we see with two eyes working together is vividly three dimensional. We feel, in addition to understanding, that every object has a particular shape and thickness, occupies a volume and is separated in depth from others in space. This sensation of three-dimensionality originates from the fact that the left and right eyes view the world from laterally separated positions. The geometry creates a tiny horizontal shift between the projections of each visual feature onto the respective retinae, i.e. binocular disparity. A feature at the fixation distance yields zero disparity; otherwise, the sign of the disparity signifies whether a feature is in front of or behind the fixation depth and the magnitude of disparity is approximately proportional to the distance in depth of the feature from the fixation depth. The visual system uses this cue to achieve a reliable and accurate sense of depth, and support manipulation of three-dimensional objects and navigation in three-dimensional environments [1–3].
In this process of binocular depth perception, or stereopsis, the visual system should match corresponding features in the two retinal images (stereo correspondence problem [4,5]). This is by no means a simple task because natural scenes (and their projections onto the two retinae) contain similar visual features. For example, when we view a tree with heavy foliage, an image of a leaf projected onto one eye may be matched with an image in the other eye of any one of many leaves. Among the numerous possible matches between features in the two retinal images, only one set of matches is consistent across the visual field (global match, figure 1a). The visual system must find the global match and ignore the other potential matches (false matches) in order to obtain a correct disparity map and create the perception of a coherent three-dimensional scene. Shape and colour are not essential for the matching process because we (and monkeys) can discriminate depth and recognize disparity-defined shape in random-dot stereograms (RDSs), which lack these monocular cues [6–8].
Figure 1.
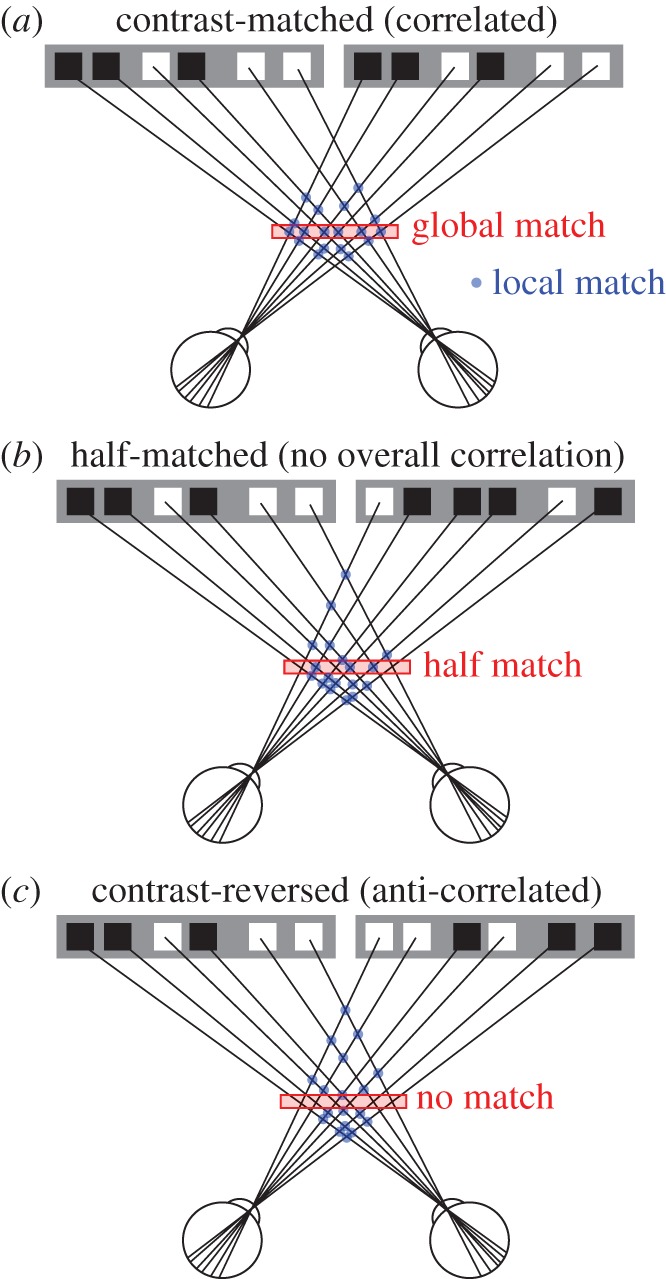
The stereo correspondence problem, and three types of RDSs. To infer the three-dimensional structure of the environment, the visual system needs to match correctly the features in the images received by the left and right retinae. The process of solving this correspondence problem can be defined as finding the match globally consistent across the visual field (global match) while rejecting false matches (blue dots) that do not belong to the global solution. Contrast-matched or correlated RDSs (cRDSs) have one global match, whereas contrast-reversed or anti-correlated RDSs (aRDSs) have none. hmRDSs, in which half of the dots are contrast-reversed, provide a half-match condition. hmRDSs are as a whole uncorrelated between the two eye images, because the positive correlation of contrast-matched dots and negative correlation of contrast-reversed dots cancel each other out.
The initial stage of stereoscopic processing begins in the primary visual cortex (V1). A group of V1 neurons compute the disparity-energy, or the square of the sum of the left- and right-eye images filtered through a neuron's receptive field [9–11]. This computation produces a cross-term of the left- and right-eye inputs and is thus similar to the cross-correlation of the binocular images within the receptive field [12]. With this correlation computation, these V1 neurons become sensitive to local binocular disparity. When one of the paired images of a normal, correlated RDS (cRDS) is contrast-reversed from the other to generate an anti-correlated RDS (aRDS), the neurons exhibit an inverted disparity tuning curve in response to this stimulus, a defining property of a cross-correlator [13]. aRDSs lack the global match (figure 1c) and abolish the sensation of three-dimensional structure in human subjects [6,14] (see later sections for detailed discussion). Therefore, it was proposed and accepted by many that the transformation of the binocular correlation signal into the disparity signal of the matched features is necessary for binocular depth perception [13]. Another group of V1 neurons attenuate the disparity selectivity for aRDSs, suggesting that the signal transformation begins in V1 [11]. Hereafter, we refer to the disparity signal of the matched features as binocular match signal, the neuronal disparity selectivity consistent with the match signal as match-based disparity representation, and the computational process that produces such representation as matching computation.
In this review, we discuss our recent psychophysical findings demonstrating that, contrary to the previous view, the correlation signal can directly contribute to depth perception without being fully transformed into a match signal, and that the relative contribution of the correlation and match signals varies with changes in stimulus parameters. We then show that a nonlinear process after local-correlation detection plays an important role in transforming the correlation signal into the match signal. Finally, we discuss the neural substrate that transforms the correlation signal into the match signal. We propose a hypothesis that a neural representation of the solution of the stereo correspondence problem resides in an extrastriate area, V4, and another area, V5/MT, contains a correlation-based representation of disparity. The two types of representations may be combined in an appropriate way to give rise to binocular depth perception under different visual conditions.
2. Reversed depth in anti-correlated random-dot stereograms
The rationale underlying the aforementioned study [13] and some studies that followed [15–20] is that aRDSs do not evoke any depth sensation and therefore should cause no disparity-dependent response modulation in cortical areas directly giving rise to binocular depth perception. By itself, a patch of aRDS with a disparity evokes no sensation of a coherent depth structure and simply looks like a cloud of lustrous dots distributed at uneven depths [6]. Psychophysical experiments have verified the inability of human observers to distinguish the disparities in the aRDSs similar to the one that evokes clear disparity modulation in V1 neurons [21]. The neuronal sensitivity to disparity in aRDSs to which human observers are insensitive suggests that V1 is not directly responsible for binocular depth perception (for a review see [22]).
This logic is straightforward and makes sense, but is incompatible with some neurophysiological findings in extrastriate cortex. Specifically, many neurons in the middle temporal area (V5/MT) modulate their responses by binocular disparity in aRDSs as V1 neurons do [17], yet micro-stimulation and unit recording studies have provided strong evidence for a causal link of their responses to certain aspects of binocular depth perception such as coarse disparity discrimination [23–25] and three-dimensional structure-from-motion perception [26–28]. If the sensitivity to disparity in aRDSs disqualifies a cortical area as part of the system directly responsible for stereo perception, V5/MT should be outside the system. Why, then, do micro-stimulation and unit recording results all point to the perceptual relevance of V5/MT responses? Behind this discrepancy lies a deeper question regarding the mechanism of stereopsis: can the correlation signal contribute directly to depth perception (as opposed to indirectly, via transformation to the match signal)? To put it another way, can the visual system support depth perception without solving the correspondence problem?
To address this question, we re-examined human observers' ability to discriminate binocular disparity in aRDSs under previously untested conditions. We found that humans can in fact exploit the correlation signal and discriminate stereoscopic depth in aRDSs [29]. A crucial condition is that an aRDS should accompany an immediately adjacent plane that is defined by a cRDS. For example, we used bipartite, centre-surround RDSs in which only the centre disc was anti-correlated and the surrounding annulus was correlated (figure 2a, bottom). In the experiments, we used dynamic RDSs in which dot patterns were refreshed at a given rate (electronic supplementary material, Video Clip 1). With this condition observers judge that an aRDS with a crossed (near) disparity is farther away, and one with an uncrossed (far) disparity is nearer, than the cRDS plane with zero disparity, a phenomenon known as reversed depth perception [31,32]. The judgement was based on consciously perceived, albeit weak, depth of a cloud of dots in aRDSs. Moreover, aRDSs can produce correct (non-reversed) depth perception when a time offset of approximately 100 ms is introduced between the left- and right-eye images. A model of the disparity energy units coupled with biphasic/transient filters quantitatively accounts for the effects of binocular anti-correlation and inter-ocular delay, suggesting that a transient/biphasic temporal filter intervenes in the correlation-based depth perception from aRDSs [29].
Figure 2.

Graded anti-correlation as a tool to dissociate binocular correlation-based and match-based computations. (a) Examples of contrast-matched, half-matched and contrast-reversed RDSs (cRDS, hmRDS, aRDS, respectively). The RDSs consist of a centre disc and a surrounding annulus. The annulus is always a cRDS. (b) We reverse the luminance contrast of a varying proportion of dots in one eye. This manipulation changes the binocular match from 100% (cRDS) through 50% (hmRDS) to 0% (aRDS), while binocular correlation changes from 100% (cRDS) through 0% (hmRDS) to −100% (aRDS). (c) Predicted psychophysical performance dissociates match-based computation from correlation-based computation. (Adapted from Doi et al. [30].)
When a reference cRDS is changed to either an aRDS or an uncorrelated RDS (i.e. when dots in one half-image are randomly placed relative to dots in the other half-image), providing no crisp reference plane, or is separated by a small gap from the centre aRDS, observers no longer report reversed depth [29,33,34]). The findings most likely explain why the subjects in some previous studies failed to discriminate disparity in aRDSs [21,35]. We also note that observers cannot perceive a clear surface even in the presence of an adjacent cRDS, indicating that perception of a surface-in-depth and perception of depth sign can be dissociated [29].
Depth discrimination thus relies on the disparity-energy signal, or the neural signal of the correlation-based representation, when the stimulus accompanies a correlated reference plane in its immediate vicinity. The disparity-selective responses to aRDSs in a cortical area do not necessarily mean that neuronal activity in the area is not the neural correlate of consciousness for depth perception.
3. Differential contribution of correlation and matching computations to stereopsis
(a). Graded anti-correlation of random-dot stereograms dissociates correlation and matching computations
Given that both correlation and match signals directly contribute to depth perception, what are their relative roles? To address this question, we devised a set of RDSs in which a varying proportion of dots were contrast-reversed between the two eyes [30]. With a gradual increase of the proportion of contrast-reversed dots from zero (cRDSs) through 50% (half-matched RDSs, hmRDSs, with half the dots contrast-reversed; figure 1b) to 100% (aRDSs), the stimulus strength for the correlation computation changes proportionally from positive values through zero toward negative values (figure 2a,b; electronic supplementary material, Video Clip 1). According to the same manipulation, the stimulus strength for the matching computation gradually decreases from a positive value for cRDSs toward zero for aRDSs. In other words, both correlation and match levels are positive for cRDSs. The correlation level is zero and the match level is positive for hmRDSs. The correlation level is negative, and the match level is zero for aRDSs. In this manner, the stimulus set of graded anti-correlation dissociates the correlation level from the match level.
Graded anti-correlation allows us to make contrasting predictions for the psychophysical performance based on the correlation and matching computations (figure 2c). Consider a near/far discrimination task in which subjects are presented with a concentric bipartite RDS, and discriminate depth of the centre disc relative to the surrounding annulus. The chance-level performance is 50%, and a correct performance rate below 50% indicates reversed depth. We assumed a readout mechanism suitable for near/far discrimination; the sensory outputs of the matching or correlation computations are compared between their near and far detectors, and whichever detector has the larger response determines the choice [23–25,36]. Through this readout mechanism, the correlation computation predicts that a negative correlation between the paired images leads to reversed depth perception because the response balance is reversed between near and far detectors. We also predict that performance falls to chance level for hmRDSs, because the correlation signal, by definition, loses disparity-dependent modulation for stimuli with zero overall correlation. The per cent correct for the correlation computation should therefore follow an odd function (figure 2c, blue curve), but the prediction based on the match signal will differ. A subject's performance will stay better than chance as long as a certain proportion of dots are contrast-matched between the two eyes. The per cent correct should decrease to chance level for aRDSs, which have no binocularly matched dots (figure 2c, red curve). These predictions are specific to the near-versus-far opponency readout mechanism. The correlation computation could predict no depth perception (chance-level performance) for aRDSs through the winner-take-all readout mechanism [32,35].
(b). Weighted average of correlation and match signals accounts for psychophysical performance
In one series of experiments, we examined how the magnitude of binocular disparity affected the performance of disparity discrimination for graded anti-correlation [30]. When the disparity of the centre relative to the surround was ±0.03° (a disparity within a range of fine stereopsis), the psychometric functions agreed with the prediction of the matching computation (figure 3b, leftmost). The subjects performed perfectly for match levels from 100% (cRDS) to 50% (hmRDS), and then their performance gradually declined towards chance level at 0% match (aRDS). With a larger disparity within a range of coarse stereopsis (±0.48°), the performance fell between the predictions for the correlation and matching computations (figure 3b, rightmost). The subjects reported reversed depth in RDSs below 50% match levels where reversed-contrast dots dominated. By changing disparity magnitude gradually from 0.03° to 0.48°, psychometric curves systematically changed their shape from the prediction of matching computation towards the prediction of correlation computation (figure 3b, middle three panels).
Figure 3.

Correlation and matching computations change their contribution depending on disparity magnitude and stimulus refresh rate. (a) Schematic diagram of weighted average of correlation and match signals that transforms bivariate signal (disparity sign and binocular match level) into a binary choice (near versus far). The process consists of four stages (encoding, subtraction, weighted average, binary decision). The relative contribution of the correlation computation for depth judgement is controlled by the parameter w. (b,c). Per cent correct data of human observers (open circles) and the functions (coloured curves) predicted from the model shown in (a) with only the parameter w fitted independently across five disparity magnitudes (b) and four refresh rates (c). Each data point is based on 60 choices, and error bars indicate s.e.m. across two blocks of trials. The two dashed curves above and below the solid curves are the hypothetical psychometric functions for pure matching computation (w = 0) and pure correlation computation (w = 1), respectively. (d) The impact of four free parameters in the model on the weighted-average psychometric functions. Only manipulation of the relative weight reproduces the psychophysical results. By contrast, the amplitude of the detectors does not shift the point of intersections with chance performance, and the upper and lower limits of the sigmoidal response function of the matching units do not shift the y-intercept (arrows). (Adapted from Doi et al. [30,37].)
In another series of experiments, we fixed the disparity magnitude at an intermediate value (0.24°), and examined the effect of the dot pattern refresh rates on the disparity discrimination [37]. As mentioned earlier, when the correlation signal directly contributes to depth perception, a biphasic temporal filter (transient/band-pass channel) best characterizes the underlying temporal processing [29]. However, both the transient/band-pass channel with biphasic filter and sustained/low-pass channel with monophasic filter contribute to stereopsis [38,39]. We manipulated the relative activation of the transient/band-pass and sustained/low-pass channels by changing the pattern refresh rate of RDSs. At the slower refresh rates (5.3 and 10.6 Hz), the psychometric function resembled the one predicted from the matching computation (figure 3c, left two panels). With an increase in refresh rate, the shape of psychometric functions gradually shifted towards the function predicted from the correlation signal (figure 3c, right two panels).
The subjects' performance in the two experiments can be captured with a computational model in which correlation and matching computations operate in parallel and their signals are combined with variable relative weights (figure 3a) [30]. The model transforms a bivariate input (disparity sign, binocular match level) into a binary choice (near versus far). The model is thus an abstract one and does not take the raw images as inputs. The transformation proceeds in four steps: encoding of disparity sign and match level into a sensory response in each of the correlation and matching computations, subtraction of responses between near and far detectors in each computation, weighted average of the signals of the two computations, and binary decision based on a threshold mechanism. At the encoding stage, the responses of correlation units linearly depended on the match level as energy-model units do. We modelled the responses of matching units as a sigmoidal function against the match level: the disparity tuning at 0% match was flat and nonlinearly grew as the match level increased. Gaussian noise was assumed to corrupt these responses. We mathematically derived the formula of the psychometric function from the model [30], and then calculated the model outputs by changing four free parameters (relative weight between the two computations, the response amplitude of encoding units, and the upper and lower limits of the sigmoidal response function of the matching units). The observers' performance in the different disparity magnitudes or refresh rates was precisely reproduced by manipulation of the relative weight (figure 3b,c; compare the coloured functions predicted from the formula with the data points obtained in the psychophysical experiments). Changes in the other parameters do not reproduce the changes of the psychophysical performance (cf. figure 3b,c with 3d, right three panels).
(c). Readout of match-based disparity information from random-dot stereograms with no overall binocular correlation
The correlation signal has flat disparity tuning for hmRDSs. This poses a paradox: how is the depth perception for hmRDSs, a hallmark of match-based depth perception, possible at all when the initial stage of cortical disparity processing yields only flat disparity tuning? The resolution of the paradox lies in a finer detail of the RDSs. If the stereoscopic system can ‘see’ only the correlated dot patterns in the presence of equally numbered anti-correlated dots, then the disparity information can be easily encoded. A way to achieve this is to encode the disparity signals locally, then pass the signal from correlated dots onto the next stage while filtering out the signal from anti-correlated dots [40]. A simple threshold operation can serve as the filter for locally computed binocular correlation (i.e. not passing the signal if the local correlation is negative). Other types of nonlinearity, such as squaring, also work.
This scheme predicts that if the local correlation is enhanced, the depth perception should improve even when the overall correlation is zero. We confirmed this prediction by using variants of hmRDSs, in which local correlation was either strengthened or weakened without affecting overall correlation [37]. To strengthen local correlation, we vertically paired correlated dots to correlated dots and anti-correlated dots to anti-correlated dots (figure 4aii, denoted as positively paired). To weaken local correlation, we paired correlated dots to anti-correlated dots (figure 4ai, negatively paired). To gradually manipulate the strength of the local correlation, we varied the percentage of dots made into vertical pairs (figure 4b; electronic supplementary material, Video Clip 2). More formally, the strength of the local correlation refers to its degree of variability. With negative pairing, local-correlation fluctuates only weakly across space and time; with positive pairing, the fluctuation becomes larger (figure 4c). The near/far discrimination performance of human subjects increased with the percentage of paired dots (figure 4d). The sign of per cent paired dots is indistinguishable in monocular vision. Therefore, the variation in monocular-image features cannot explain the observed results. The improved performance suggests that the detection of local correlation, followed by nonlinearity, serves as an essential step of match-based depth perception. Similar mechanisms were proposed before to explain the attenuated disparity selectivity for aRDSs in the primate V1 and owl visual forebrain [15,41,42].
Figure 4.

Match-based depth perception depends on local correlation. (a) RDSs to manipulate local correlation while maintaining global correlation at zero. (i) An example RDS with negative dot pairing, in which a contrast-matched dot is paired with a contrast-reversed dot. (ii) An example RDS with positive dot pairing, in which a contrast-matched dot is vertically paired with one of the other contrast-matched dots. Pairs are made likewise between contrast-reversed dots. (b) Schematic diagrams of the dot pairing. Orange dots indicate contrast-matched dots; blue dots indicate contrast-reversed dots (in a pair or quadruplet of dots, the left-side and right-side dots indicate the luminance contrast for the left and right eyes, respectively). All RDSs contain the same number of contrast-matched and contrast-reversed dots, but the percentage and sign of dot pairing vary. (c) Statistics of binocular correlation within a small area of simulated RDSs across time (different patterns). (d) The per cent correct of near/far discrimination as a function of the percentage of paired dots. Error bars indicate the standard error across three subjects. (Adapted from Doi et al. [37].)
In the weighted-average model shown in figure 3a, the encoding units are defined to meet the ideal behaviour of correlation or matching computations. Based on the series of experiments described above, we now discuss mechanistic details of the encoding units (figure 5). For the correlation computation, the temporal filtering on the monocular contrast signal should be transient. Spatially, a coarse receptive field is sufficient and fine processing is not necessary. The left and right monocular signals are locally combined according to the disparity-energy mechanism and then pooled to represent a stimulus more globally. For the matching computation, the temporal filtering should be more sustained so that its contribution to depth perception becomes stronger for slower stimuli. The spatial receptive-field size should be small so that the variability of local correlation can represent disparity information. The disparity-energy mechanism should be followed by nonlinearity before the pooling process averages out locally represented disparity information (figure 5, bottom).
Figure 5.

Possible mechanism of the encoding units in the weighted average model. For the correlation-based representation, local (spatially localized) disparity-energy units receive inputs from transient temporal channel and coarse spatial receptive field (RF). The outputs of the energy units are spatio-temporally pooled without additional nonlinearity. For the match-based representation, the sustained channel and fine RF are used instead of the transient channel and coarse RF. Additional nonlinearity transforms the local disparity-energy signals into match-based representation of disparity. Nonlinear process precedes pooling of responses across visual field.
Adding nonlinearity is just a simple extension of the energy model, but can qualitatively transform the disparity signal. On the one hand, before the nonlinearity, the mean response of local-correlation units encode the disparity of aRDSs with inverted tuning shape, but after the appropriate nonlinearity, the selectivity for aRDS disparity can be reduced [11,15,41,42]. On the other hand, the nonlinearity can create disparity selectivity for hmRDSs by extracting the disparity information represented in the response variability of the local-correlation units [37]. If the tuning shape is the tuned-excitatory type, the disparity selectivity newly created for hmRDSs is consistent with the selectivity already existing for cRDSs. For the tuned-excitatory type, the models with the nonlinearity inserted after or before binocular combination have similar mathematical expressions [40,42]. Similar nonlinear mechanisms have been suggested for transparent-motion detection [43], contrast-invariant orientation tuning [44] and the construction of linearly separable representations of target versus distractor objects [45].
These mechanistic details of encoding units, at least qualitatively, explain why the relative weights for the two computations vary with disparity magnitude and pattern refresh rate. However, our model may be too simplistic in that one stream of computation does not involve any nonlinearity after local-correlation detection. A more realistic scenario might be to incorporate nonlinearity in both streams but with differential strengths (weak versus strong nonlinearity). Even in V1, many neurons attenuate their disparity tuning amplitudes to aRDSs (see below) [11,13]. It is not clear if our model can explain why depth perception improves when an RDS consists of a mixture of bright and dark dots, compared with when an RDS consists of only bright dots or only dark dots [46,47]. Also, the model does not explain the complex centre-surround interaction underlying depth perception. A next important step is to extend our model to explain why reversed depth perception for aRDSs is perceived only with a binocularly correlated surround, in a manner consistent with how fine depth perception for correlated stimuli is improved with a correlated surround.
(d). Functional advantage of multiple disparity computations
When a stereo algorithm is evaluated for accuracy of depth estimation, the evaluation is often performed uniformly across the entire map (i.e. entire input image) [48]. This is a natural choice for the evaluation of artificial algorithms. However, our own stereoscopic system may have evolved to achieve a different goal: solving the correspondence problem not uniformly but preferentially for a location closer to the fovea or the centre of attention. In order to achieve timely behaviour, the limited capacity of the visual system does not permit detailed analyses of all inputs [49,50]. For a peripheral visual field, a simpler mechanism may be preferentially used to detect disparity without solving the correspondence problem, at the cost of falsely detecting disparity from illusory binocular inputs such as anti-correlated stimuli. This strategy seems reasonable given that the task of creating an accurate depth map is complex, presumably requiring a sophisticated mechanism, computational cost and processing time. The parallel processing of the correlation and match signals may be useful for implementing the strategy. Matching computation exerts a greater influence on depth judgement for finer disparities and slower inputs. The preference for spatially fine and temporally slow features is a characteristic of foveal vision (e.g. [51,52]). On the other hand, correlation computation increases its contribution for coarser disparities and more dynamic inputs. It will be interesting to directly test the effects of eccentricity on the relative contributions of the two computations to depth judgement.
4. Neural mechanism of the correlation and matching representations
(a). Neurophysiological evidence in monkeys
Monkeys are a useful model animal to study stereoscopic depth perception because they perceive depth in a similar way to humans [7,8,36,53]. Classically, the neural processing of binocular disparity was ascribed to the dorsal (occipito-parietal) pathways [54,55]. However, later studies discovered disparity-selective neurons in areas along the ventral (occipito-temporal) pathway [56–61]. Since then, the relative roles of these areas in stereopsis have been the subject of intensive research over the past decade. Previous studies examined neuronal sensitivity to absolute versus relative disparity [62–65], and disparity-defined shape, three-dimensional surfaces, curvatures and objects [66–71], and also explored the roles in fine versus coarse stereopsis [23–25,36,63,72] and interaction between binocular disparity and monocular visual cues [17,73–76]. Several reviews have covered these topics [77–84]. Here we focus our discussion on the question of how well neuronal responses to disparity in these areas follow the prediction of the correlation computation or that of the matching computation. This property has been characterized by comparing the disparity modulation by aRDSs with that by cRDSs [13]. The ratio of the tuning function amplitude obtained by cRDSs to that obtained by aRDSs is one of the metrics used for this analysis. An ideal correlation signal will have an amplitude ratio of one because anti-correlation inverts the tuning curve without changing the modulation amplitude. A perfect match signal will have an amplitude ratio of zero because the tuning curve for aRDSs is flat.
Although many V1 neurons respond to disparity in aRDSs and exhibit inverted tuning curves, the response modulation is often smaller for aRDSs than for cRDSs. The mean amplitude ratio is 0.52 [13]. A later study suggested that nearly 50% of disparity-selective neurons in V1 act not in accordance with a pure disparity-energy model, but instead according to a nonlinearly modified model, discussed above [11]. This agrees with the manifestation of the correlation signal in vergence eye movement and psychophysical depth discrimination. aRDSs evoke only modestly inverted vergence response or depth judgement compared with cRDSs [18,30,37,85]. Compared with V1, a smaller fraction (approx. 10%) of neurons are sensitive to disparity in aRDSs in V4, and the mean amplitude ratio is lower (0.38) [18,86]. By contrast, 50% of neurons in V5/MT, a counterpart of V4 in the dorsal pathway, are disparity-selective for aRDSs and the mean amplitude ratio across the entire population of tested cells is 0.48 [17,86]. Medial superior temporal (MST) neurons also exhibit inverted disparity tuning to aRDSs, but the amplitude ratio has not been measured [87]. Anti-correlation completely abolishes the sensitivity to three-dimensional curvatures defined by the disparity gradient of neurons in the inferior temporal cortex (IT) and anterior intraparietal cortex (AIP) [16,88]. These results indicate that transformation from correlation-based to match-based signals is advanced in V4. The solution for the correspondence problem is explicit in single-neuron responses higher up in the hierarchy along both ventral and dorsal pathways.
We took an additional step searching for the mechanism of the correlation-to-matching transformation by examining V4 neuron responses to gradually anti-correlated RDSs. The results in human psychophysics (figure 3b, leftmost) predict that neurons in the match-based representation should gradually decrease their disparity modulation over a large range of graded anti-correlation. In contrast with this prediction, the tuning amplitude of individual V4 neurons quickly decreased to a positive baseline level with small anti-correlation and stayed constant with further anti-correlation [86] (figure 6a,b). The individual tuning curves of many neurons also shifted their peak with graded anti-correlation. This peak shift in the tuning function occurred more slowly with the degree of anti-correlation and in various directions across neurons. The tuning curve pooled across V4 neurons gradually decreased in amplitude over the entire range of graded anti-correlation and became completely flat for aRDSs (figure 6c). At neuronal population level in area V4, the correlation signal is fully transformed to the match signal. The gradual change in the tuning amplitude mimics the change in the psychophysical performance at least qualitatively.
Figure 6.

Responses of V4 neurons to graded anti-correlation of RDSs. (a,b) Disparity tuning curves of two V4 neurons obtained with a set of gradually anti-correlated RDSs. Error bars indicate ±s.e.m., and dashed lines indicate ongoing discharge rate. L, R and U denote response levels to monocular left, right and uncorrelated RDSs, respectively. Negative sign on x-axis denotes crossed disparity. (c) Population readout of V4 neurons. Disparity tuning curves of 92 neurons were pooled for different correlation levels. The disparity tuning of far-preferring neurons were flipped around 0° disparity prior to pooling. Negative sign of binocular disparity indicates preferred disparity, not crossed disparity. Lower panels show heat-map plots of the single-neuron (a,b) or population (c) responses in a plane defined by binocular disparity and correlation level. (Adapted from Abdolrahmani et al. [86].)
Preliminary results indicate that the population response of V5/MT neurons to the gradually anti-correlated RDSs differs from that of V4 neurons [89]. The amplitude of the pooled disparity-tuning curve in area V5/MT decreased as the level of binocular correlation decreased from 100% (cRDSs) to 0% (hmRDSs). At 0% correlation, the tuning curve became flat. With further decrease in binocular correlation from 0% to −100% (aRDSs), the response modulation by disparity reappeared, gradually grew and exhibited an inverted tuning-curve shape. The population tuning amplitude at −100% correlation was approximately 40% of the amplitude at 100% correlation. The population tuning functions assume an intermediate shape between correlation-based and match-based representations.
The difference in the responses to graded anti-correlation is consistent with the proposed roles of V5/MT and V4-IT in stereopsis. Electrical micro-stimulation in V5/MT biases behavioural judgement of coarse but not fine depth with centre-surround RDSs [63], whereas micro-stimulation in V4 biases fine depth discrimination [36] (but note that micro-stimulation in V5/MT biases the judgement of motion/fine-depth conjunction with rotating-cylinder stimuli [28]). Trial-by-trial response variation of single neurons correlates with an animal's coarse depth judgement in V5/MT [25] and with fine depth judgement in V4 [36] and IT [72]. Thus, the correlation signal available in V5/MT is used for coarse depth judgement, and the match signal in V4 and IT is used for fine depth judgement.
(b). Brain imaging studies in human
Several functional magnetic resonance imaging (fMRI) studies examined responses of human visual cortex to aRDSs. Bridge & Parker [19] presented subjects with a circular disc of RDS. Three quadrants of the disc were cRDSs with zero disparity. The remaining quadrant (wedge) had non-zero disparity, and changed its sign (near versus far) over time, i.e. it flipped back and forth across the fixation plane. The wedge rotated around the centre of the disc to evoke retinotopy-dependent responses in visual cortex. They compared responses with a wedge consisting of cRDS and one consisting of aRDS. V3, hV4 and V5/MT in early and intermediate visual areas, and LO-1 and LO-2 [90] in the lateral occipital cortex showed stronger responses to the cRDS wedge than the aRDS wedge. There was no difference in the responses in V1, V2, V3A or V7.
Preston et al. [20] applied multivariate pattern analysis to fMRI responses to decode whether subjects viewed crossed disparities or uncrossed disparities in cRDSs and aRDSs. Better decoding accuracy reflects a larger difference in the responses between crossed and uncrossed disparities. Responses in dorsal visual areas V3d, V3A, V3B/KO, V5/hMT+, a higher ventral area LO and parietal cortical areas VIPS, POIPS and DIPS allowed better prediction for cRDSs than for aRDSs, suggesting that the match signal exists in these areas. By contrast, decoding accuracy based on responses in V1, V2, V3v and V4 was similar for cRDSs and aRDSs.
It is difficult to assess whether these human fMRI results are consistent with the monkey neurophysiology results due to several technical factors, including the differences in the stimulus paradigms and the spatial/temporal resolution of the acquired data (single neuron activity versus BOLD (blood-oxygen-level-dependent) responses), and the identification of cortical areas. Loosely speaking, the results in V1 in the two fMRI studies are consistent with monkey neurophysiology in that V1 modulates its response to disparity in aRDSs. Remember, however, that the mean amplitude ratio of monkey V1 neurons is 0.52 [13], indicating that cRDS modulation is twice stronger than aRDS modulation. The reduced sensitivity to aRDSs in human V4 reported by Bridge & Parker [19] is also consistent with monkey neurophysiology [18,86,91], but not with the other fMRI study [20]. Furthermore, the better decoding accuracy for cRDSs than aRDSs in higher areas in both ventral and dorsal visual pathways [20] is consistent with the insensitivity of monkey IT and AIP neurons to aRDSs [16,88].
The results in V4 and V5/MT+ in human by Preston et al. [20] are not consistent with the reduced sensitivity of monkey V4 to aRDSs [18,86,91] or the retained sensitivity of monkey V5/MT and MST [17,87]. The discrepancy for area V4 may be partially explained by the controversial existence and location of the dorsal part of V4 in human cortex. Area V3B/KO in Preston et al. [20] is a part of the V4d-topo region of Tsao et al. [92] and dorsal V4 of Hansen et al. [93], which topographically corresponds to the dorsal part of V4 examined in the monkey studies. LO-1 also partially overlaps with V4d-topo or dorsal V4.
5. Conclusion
We show that both correlation and match signals can be used for disparity discrimination of a simple three-dimensional configuration, although only the match signal underlies perception of three-dimensional surfaces. The two computations determine the psychophysical performance of the disparity discrimination through weighted average of their outputs. The relative weight changes with spatial and temporal parameters of the stimuli, enabling the visual system to recruit the two computations according to the nature of the visual inputs. Some V1 neurons begin to transform the correlation signal into the match signal. An essential step in creating the match signal occurs in or after V4, where pooling of responses across neurons eliminates sensitivity to false-match disparities. V5/MT represents disparity in a more correlation-based manner than V4 both at the single-neuron and population levels (in monkeys).
It is tempting to speculate that the neural substrate for matching computation in figure 3a corresponds at least partially to V4, and that V5/MT contains a component of the neural substrate for correlation computation. This is a plausible scenario supported by the currently available evidence, and certainly worthy of further experimental tests. The population response of V4 neurons to gradually anti-correlated RDSs qualitatively parallels the performance of fine disparity discrimination in human subjects [86]. Whether this relation holds up quantitatively remains to be determined.
A series of our studies, reviewed here, started with the puzzling discrepancy between the sensitivity of V5/MT neurons to aRDSs [17] and their causal role in stereopsis [23–28,63]. Although the finding that the correlation signal can directly mediate conscious depth perception [29,30,37] appears to resolve the puzzle, the idea that the correlation signal in V5/MT mediates reversed depth requires further experimental tests. To examine this issue and also to establish the quantitative link between V4 population responses and depth discrimination, it is desirable to simultaneously obtain psychophysical and neurophysiological data in response to gradually anti-correlated RDSs in the same species. We first have to revisit the question of whether monkeys perceive reversed depth in aRDSs as humans do. Previous studies reported a negative answer on this issue [13,16–18]. However, in the studies using RDSs similar to those used in our human psychophysical experiments, aRDSs did not accompany an adjacent reference plane [13] or were presented at a low refresh rate (12 Hz) [18]. The tests were performed under the conditions where human subjects do not perceive reversed depth either.
Another important question is why reversed depth perception is possible only when an adjacent reference plane with correlated dots is available. Our weighted average model does not explain this spatial interaction between the test region and the adjacent reference region. The requirement for an adjacent plane raises the question of what exactly is reversed in reversed depth perception; it may be relative depth between the test region and the reference region, rather than the absolute disparity of the test region [94]. However, this contradicts the idea of the possible involvement of V5/MT in reversed depth perception, because when tested with a centre-surround stimulus these neurons respond to absolute disparity of the centre and are not sensitive to the relative disparity between the centre and the surround [63].
Finally, we point out that the problem set discussed in this article is limited compared with the correspondence problem in its original sense: determining correct matching points between the left-eye and right-eye images and creating a detailed three-dimensional representation of the scene [4,5,14]. Following the influential work by Cumming & Parker [13], much of the physiological and psychological investigation of the correspondence problem has focused on neuronal tuning or psychophysical performance for aRDSs. We expanded these attempts by introducing graded anti-correlation and dot pairing. In this limited problem set, the stereo system can take advantage of several factors for rejecting false matches and accurately estimating disparity. For example, independent dot patterns presented successively (dynamic RDS) are useful to derive pure disparity information by averaging out the contributions of monocular-image features to the model responses. A fixed, stereotyped three-dimensional structure is embedded in stimuli, and often the embedded structure has only a uniform depth plane (but see [16]). However, in a natural situation, the stereo system confronts much more challenging problems in which objects and the background can generate a complex combination of disparity edge, disparity gradient and occluded regions. Moreover, the statistics for these features may vary from one environment to another (e.g. indoor versus outdoor). Disparity selectivity for hmRDSs and the lack of selectivity for aRDSs (our matching computation) is a necessary property of a system that can derive a general solution of the correspondence problem, but may be far from sufficient to create a precise depth map from a complex natural scene. Although theoretical investigation of this issue has begun [48], further experimental work is required to understand how the stereoscopic system solves the correspondence problem in a more general sense. Also, all the psychophysical tasks we used to probe depth perception were near versus far discrimination. Accordingly, an appropriate readout mechanism should be comparing the responses between near- and far-preferring neurons. It is an open question how the correlation and match signals relate to other aspects of depth perception, e.g. depth detection or identification, through a different readout mechanism such as the winner-take-all rule.
Acknowledgments
We thank Hiroshi Ban, Hiroshi M. Shiozaki and Mikio Inagaki for comments on an earlier version of the manuscript.
Ethics
The human psychophysical studies reported here from our laboratory were performed in accordance with the Declaration of Helsinki. A written informed consent was obtained from each subject. All animal care, surgical and experimental procedures conformed to the National Institutes of Health Guide for the Care and Use of Laboratory Animals and were approved by the Animal Experiment Committee of Osaka University. Some animals were provided by National Institute of Natural Sciences (NINS) through the National Bio-resource Project (NBRP) of the Ministry of Education, Culture, Sports, Science and Technology of Japan.
Data accessibility
Data are available on request from the corresponding author.
Authors' contributions
The two authors wrote this paper with an equal contribution, and approved the final version of the manuscript.
Competing interests
We declare we have no competing interests.
Funding
The work reviewed here from the laboratory of the first author (I.F.) was supported by grants from the Ministry of Education, Culture, Sports, Science and Technology in Japan (15H01437, 16H01673, 16H03384, 23240047, 23135522) and the Center for Information and Neural Networks.
References
- 1.Wheatstone C. 1838. Contributions to the physiology of vision—part the first. On some remarkable, and hitherto unobserved, phenomena of binocular vision. Phil. Trans. R. Soc. Lond 128, 371–394. ( 10.1098/rstl.1838.0019) [DOI] [Google Scholar]
- 2.Howard IP. 2002. Seeing in depth: vol. 1. Basic mechanisms. Toronto, Canada: I Porteous. [Google Scholar]
- 3.Howard IP, Rogers BJ. 2002. Seeing in depth: vol. 2. Depth perception. Toronto, Canada: I Porteous. [Google Scholar]
- 4.Marr D, Poggio T. 1976. Cooperative computation of stereo disparity. Science 194, 283–287. ( 10.1126/science.968482) [DOI] [PubMed] [Google Scholar]
- 5.Marr D, Poggio T. 1979. A computational theory of human stereo vision. Proc. R. Soc. Lond. B 204, 301–328. ( 10.1098/rspb.1979.0029) [DOI] [PubMed] [Google Scholar]
- 6.Julesz B. 1960. Binocular depth perception of computer-generated patterns. Bell Syst. Tech. J. 39, 1125–1162. ( 10.1002/j.1538-7305.1960.tb03954.x) [DOI] [Google Scholar]
- 7.Bough E. 1970. Stereoscopic vision in the macaque monkey: a behavioural demonstration. Nature 225, 42–44. ( 10.1038/225042a0) [DOI] [PubMed] [Google Scholar]
- 8.Harwerth RS, Boltz RL. 1979. Behavioral measures of stereopsis in monkeys using random dot stereograms. Physiol. Behav. 22, 229–234. ( 10.1016/0031-9384(79)90080-5) [DOI] [PubMed] [Google Scholar]
- 9.Ohzawa I, DeAngelis GC, Freeman RD. 1990. Stereoscopic depth discrimination in the visual cortex: neurons ideally suited as disparity detectors. Science 249, 1037–1041. ( 10.1126/science.2396096) [DOI] [PubMed] [Google Scholar]
- 10.Ohzawa I. 1998. Mechanisms of stereoscopic vision: the disparity energy model. Curr. Opin. Neurobiol. 8, 509–515. ( 10.1016/S0959-4388(98)80039-1) [DOI] [PubMed] [Google Scholar]
- 11.Haefner RM, Cumming BG. 2008. Adaptation to natural binocular disparities in primate V1 explained by a generalized energy model. Neuron 57, 147–158. ( 10.1016/j.neuron.2007.10.042) [DOI] [PMC free article] [PubMed] [Google Scholar]
- 12.Qian N, Zhu Y. 1997. Physiological computation of binocular disparity. Vis. Res. 37, 1811–1827. ( 10.1016/S0042-6989(96)00331-8) [DOI] [PubMed] [Google Scholar]
- 13.Cumming BG, Parker AJ. 1997. Responses of primary visual cortical neurons to binocular disparity without depth perception. Nature 389, 280–283. ( 10.1038/38487) [DOI] [PubMed] [Google Scholar]
- 14.Julesz B. 1971. Foundation of cyclopean perception. Chicago, IL: University of Chicago Press. [Google Scholar]
- 15.Nieder A, Wagner H. 2001. Hierarchical processing of horizontal disparity information in the visual forebrain of behaving owls. J. Neurosci. 21, 4514–4522. [DOI] [PMC free article] [PubMed] [Google Scholar]
- 16.Janssen P, Vogels R, Liu Y, Orban GA. 2003. At least at the level of inferior temporal cortex, the stereo correspondence problem is solved. Neuron 37, 693–701. ( 10.1016/S0896-6273(03)00023-0) [DOI] [PubMed] [Google Scholar]
- 17.Krug K, Cumming BG, Parker AJ. 2004. Comparing perceptual signals of single V5/MT neurons in two binocular depth tasks. J. Neurophysiol. 92, 1586–1596. ( 10.1152/jn.00851.2003) [DOI] [PubMed] [Google Scholar]
- 18.Tanabe S, Umeda K, Fujita I. 2004. Rejection of false-matches for binocular correspondence in macaque visual cortical area V4. J. Neurosci. 24, 8170–8180. ( 10.1523/JNEUROSCI.5292-03.2004) [DOI] [PMC free article] [PubMed] [Google Scholar]
- 19.Bridge H, Parker AJ. 2007. Topographical representation of binocular depth in the human visual cortex using fMRI. J. Vis. 7, 15 ( 10.1167/7.14.15) [DOI] [PubMed] [Google Scholar]
- 20.Preston TJ, Li S, Kourtzi Z, Welchman AE. 2008. Multivoxel pattern selectivity for perceptually relevant binocular disparities in the human brain. J. Neurosci. 28, 11 315–11 327. ( 10.1523/JNEUROSCI.2728-08.2008) [DOI] [PMC free article] [PubMed] [Google Scholar]
- 21.Cumming BG, Shapiro SE, Parker AJ. 1998. Disparity detection in anticorrelated stereograms. Perception 27, 1367–1377. ( 10.1068/p271367) [DOI] [PubMed] [Google Scholar]
- 22.Read J. 2005. Early computational processing in binocular vision and depth perception. Prog. Biophys. Mol. Biol. 87, 77–108. ( 10.1016/j.pbiomolbio.2004.06.005) [DOI] [PMC free article] [PubMed] [Google Scholar]
- 23.DeAngelis GC, Cumming BG, Newsome WT. 1998. Cortical area MT and the perception of stereoscopic depth. Nature 394, 677–680. ( 10.1038/29299) [DOI] [PubMed] [Google Scholar]
- 24.Uka T, DeAngelis GC. 2003. Contribution of middle temporal area to coarse depth discrimination: comparison of neuronal and psychophysical sensitivity. J. Neurosci. 23, 3515–3530. [DOI] [PMC free article] [PubMed] [Google Scholar]
- 25.Uka T, DeAngelis GC. 2004. Contribution of area MT to stereoscopic depth perception: choice-related response modulations reflect task strategy. Neuron 42, 297–310. ( 10.1016/S0896-6273(04)00186-2) [DOI] [PubMed] [Google Scholar]
- 26.Bradley DC, Chang GC, Andersen RA. 1998. Encoding of three-dimensional structure-from-motion by primate area MT neurons. Nature 392, 714–717. ( 10.1038/33688) [DOI] [PubMed] [Google Scholar]
- 27.Dodd JV, Krug K, Cumming BG, Parker AJ. 2001. Perceptually bistable three-dimensional figures evoke high choice probabilities in cortical area MT. J. Neurosci. 21, 4809–4821. [DOI] [PMC free article] [PubMed] [Google Scholar]
- 28.Krug K, Cicmil N, Parker AJ, Cuming BG. 2013. A causal role for V5/MT neurons coding motion-disparity conjunctions in resolving perceptual ambiguity. Curr. Biol. 23, 1454–1459. (doi:10/1016/j.cub.2013.06.023) [DOI] [PMC free article] [PubMed] [Google Scholar]
- 29.Tanabe S, Yasuoka S, Fujita I. 2008. Disparity-energy signals in perceived stereoscopic depth. J. Vis. 8, 22 ( 10.1167/8.3.22) [DOI] [PubMed] [Google Scholar]
- 30.Doi T, Tanabe S, Fujita I. 2011. Matching and correlation computations in stereoscopic depth perception. J. Vis. 11, 1 ( 10.1167/11.3.1.) [DOI] [PubMed] [Google Scholar]
- 31.Rogers BJ, Anstis SM. 1975. Reversed depth from positive and negative stereograms. Perception 4, 193–201. ( 10.1068/p040193) [DOI] [Google Scholar]
- 32.Read JCA, Eagle RA. 2000. Reversed stereo depth and motion direction with anti-correlated stimuli. Vis. Res. 40, 3345–3358. ( 10.1016/S0042-6989(00)00182-6) [DOI] [PubMed] [Google Scholar]
- 33.Read JCA, Phillipson GP, Serrano-Pedraza I, Milner AD, Parker AJ. 2010. Stereoscopic vision in the absence of the lateral occipital cortex. PLoS ONE 5, e12608 ( 10.1371/journal.pone.0012608) [DOI] [PMC free article] [PubMed] [Google Scholar]
- 34.Cottereau BR, McKee SP, Norcia AM. 2012. Bridging the gap: global disparity processing in the human visual cortex. J. Neurophysiol. 107, 2421–2429. ( 10.1152/jn.01051.2011) [DOI] [PMC free article] [PubMed] [Google Scholar]
- 35.Hibbard PB, Scott-Brown KC, Haigh EC, Adrain M. 2014. Depth perception not found in human observers for static or dynamic anti-correlated random dot stereograms. PLoS ONE 9, e84087 ( 10.1371/journal.pone.0084087) [DOI] [PMC free article] [PubMed] [Google Scholar]
- 36.Shiozaki HM. Tanabe S, Doi T, Fujita I. 2012. Neural activity in cortical area V4 underlies fine disparity discrimination. J. Neurosci. 14, 3830–3841. ( 10.1523/JNEUROSCI.5083-11.2012) [DOI] [PMC free article] [PubMed] [Google Scholar]
- 37.Doi T, Takano M, Fujita I. 2013. Temporal channels and disparity representations in stereoscopic depth perception. J. Vis. 13, 26 ( 10.1167/13.13.26) [DOI] [PubMed] [Google Scholar]
- 38.Kontsevich LL, Tyler CW. 2000. Relative contributions of sustained and transient pathways to human stereoprocessing. Vis. Res. 40, 3245–3255. ( 10.1016/S0042-6989(00)00159-0) [DOI] [PubMed] [Google Scholar]
- 39.Lee S, Shioiri S, Yaguchi H. 2007. Stereo channels with different temporal frequency tunings. Vis. Res. 47, 289–297. ( 10.1016/j.visres.2006.11.009) [DOI] [PubMed] [Google Scholar]
- 40.Doi T, Fujita I. 2014. Cross-matching: a modified cross-correlation underlying threshold energy model and match-based depth perception. Front. Comput. Neurosci. 8, 127 ( 10.3389/fncom.2014.00127) [DOI] [PMC free article] [PubMed] [Google Scholar]
- 41.Lippert J, Wagner H. 2001. A threshold explains modulation of neural responses to opposite-contrast stereograms. NeuroReport 12, 3205–3208. ( 10.1097/00001756-200110290-00013) [DOI] [PubMed] [Google Scholar]
- 42.Read JCA, Parker AJ, Cumming BG. 2002. A simple model accounts for the response of disparity-tuned V1 neurons to anticorrelated images. Vis. Neurosci. 19, 735–753. ( 10.1017/S0952523802196052) [DOI] [PubMed] [Google Scholar]
- 43.Qian N, Andersen RA, Adelson EH. 1994. Transparent motion perception as detection of unbalanced motion signals. I. Psychophysics. J. Neurosci. 14, 7357–7366. [DOI] [PMC free article] [PubMed] [Google Scholar]
- 44.Finn IM, Prieve NJ, Ferster D. 2007. The emergence of contrast-invariant orientation tuning in simple cells of cat visual cortex. Neuron 54, 137–152. ( 10.1016/j.neuron.2007.02.029) [DOI] [PMC free article] [PubMed] [Google Scholar]
- 45.Pagan M, Urban LS, Wohl MP, Rust NC. 2013. Signals in inferotemporal and perirhinal cortex suggest an untangling of visual target information. Nat. Neurosci. 16, 1132–1139. ( 10.1038/nn.3433) [DOI] [PMC free article] [PubMed] [Google Scholar]
- 46.Harris JM, Parker AJ. 1995. Independent neural mechanisms for bright and dark image information in binocular stereopsis. Nature 374, 808–881. ( 10.1038/374808a0) [DOI] [PubMed] [Google Scholar]
- 47.Read JCA, Vaz XA, Serrano-Pedraza I. 2011. Independent mechanisms for bright and dark features in a stereo correspondence task. J. Vis. 11, 4 ( 10.1167/11.12.4) [DOI] [PubMed] [Google Scholar]
- 48.Read JCA, Cumming BG. 2007. Sensors for impossible stimuli may solve the stereo correspondence problem. Nat. Neurosci. 10, 1322–1328. ( 10.1038/nn1951) [DOI] [PMC free article] [PubMed] [Google Scholar]
- 49.Itti L, Koch C. 2001. Computational modelling of visual attention. Nat. Rev. Neurosci. 2, 194–203. ( 10.1038/35058500) [DOI] [PubMed] [Google Scholar]
- 50.Neri P, Heeger DJ. 2002. Spatiotemporal mechanisms for detecting and identifying image features in human vision. Nat. Neurosci. 5, 812–816. ( 10.1113/jphysiol.1970.sp009296) [DOI] [PubMed] [Google Scholar]
- 51.Blakemore C. 1970. The range and scope of binocular depth discrimination in man. J. Physiol. (Lond.) 211, 599–622. ( 10.1073/pnas.96.14.8217) [DOI] [PMC free article] [PubMed] [Google Scholar]
- 52.Snowden RJ, Hess RF. 1992. Temporal frequency filters in the human peripheral visual field. Vis. Res. 32, 61–72. ( 10.1016/0042-6989(92)90113-W) [DOI] [PubMed] [Google Scholar]
- 53.Uka T, Tanaka H, Kato M, Fujita I. 1999. Behavioral evidence for visual perception of 3-dimensional surface structures in monkeys. Vis. Res. 39, 2399–2410. ( 10.1016/S0042-6989(98)00305-8) [DOI] [PubMed] [Google Scholar]
- 54.Hubel DH, Livingstone MS. 1987. Segregation of form, color, and stereopsis in primate area 18. J. Neurosci. 7, 3378–3415. [DOI] [PMC free article] [PubMed] [Google Scholar]
- 55.Gonzalez F, Perez R. 1998. Neural mechanisms underlying stereoscopic vision. Prog. Neurobiol. 55, 191–224. ( 10.1016/S0301-0082(98)00012-4) [DOI] [PubMed] [Google Scholar]
- 56.Janssen P, Vogels R, Orban GA. 1999. Macaque inferior temporal neurons are selective for disparity-defined three-dimensional shapes. Proc. Natl Acad. Sci. USA 96, 8217–8222. ( 10.1073/pnas.96.14.8217) [DOI] [PMC free article] [PubMed] [Google Scholar]
- 57.Uka T, Tanaka H, Yoshiyama K, Kato M, Fujita I. 2000. Disparity selectivity of neurons in monkey inferior temporal cortex. J. Neurophysiol. 84, 120–132. [DOI] [PubMed] [Google Scholar]
- 58.Watanabe M, Tanaka H, Uka T, Fujita I. 2002. Disparity-selective neurons in area V4 of macaque monkeys. J. Neurophysiol. 87, 1960–1973. ( 10.1152/jn.00780.2000) [DOI] [PubMed] [Google Scholar]
- 59.Hegde J, Van Essen DC. 2005. Stimulus dependence of disparity coding in primate visual area V4. J. Neurophysiol. 93, 620–626. ( 10.1152/jn.00039.2004) [DOI] [PubMed] [Google Scholar]
- 60.Tanabe S, Doi T, Umeda K, Fujita I. 2005. Disparity-tuning characteristics of neuronal responses to dynamic random-dot stereograms in macaque visual area V4. J. Neurophysiol. 94, 2683–2699. [DOI] [PubMed] [Google Scholar]
- 61.Hinkle DA, Connor CE. 2005. Quantitative characterization of disparity tuning in ventral pathway area V4. J. Neurophysiol. 94, 2726–2737. ( 10.1152/jn.00341.2005) [DOI] [PubMed] [Google Scholar]
- 62.Cumming BG, Parker AJ. 1999. Binocular neurons in V1 of awake monkeys are selective for absolute, not relative, disparity. J. Neurosci. 19, 5602–5618. [DOI] [PMC free article] [PubMed] [Google Scholar]
- 63.Uka T, DeAngelis GC. 2006. Linking neural representation to function in stereoscopic depth perception: roles of middle temporal area in coarse versus fine disparity discrimination. J. Neurosci. 26, 6791–6802. ( 10.1523/JNEUROSCI.5435-05.2006) [DOI] [PMC free article] [PubMed] [Google Scholar]
- 64.Thomas OM, Cumming BG, Parker AJ. 2002. A specialization for relative disparity in V2. Nat. Neurosci. 5, 472–478. ( 10.1038/nn837) [DOI] [PubMed] [Google Scholar]
- 65.Umeda K, Tanabe S, Fujita I. 2007. Representation of stereoscopic depth based on relative disparity in macaque area V4. J. Neurophysiol. 98, 241–252. ( 10.1152/jn.01336.2006) [DOI] [PubMed] [Google Scholar]
- 66.Taira M, Tsutsui KI, Jiang M, Yara K, Sakata H. 2000. Parietal neurons represent surface orientation from the gradient of binocular disparity. J. Neurophysiol. 83, 3140–3146. [DOI] [PubMed] [Google Scholar]
- 67.Tanaka H, Uka T, Yoshiyama K, Kato M, Fujita I. 2001. Processing of shape defined by disparity in monkey inferior temporal cortex. J. Neurophyiol. 85, 735–744. [DOI] [PubMed] [Google Scholar]
- 68.Hinkle DA, Connor CE. 2002. Three-dimensional orientation tuning in macaque area V4. Nat. Neurosci. 5, 665–670. ( 10.1038/nn875) [DOI] [PubMed] [Google Scholar]
- 69.Nguyenkim JD, DeAngelis GC. 2003. Disparity-based coding of three-dimensional surface orientation by macaque middle temporal neurons. J. Neurosci. 23, 7117–7128. [DOI] [PMC free article] [PubMed] [Google Scholar]
- 70.Hegdé J, Van Essen DC. 2005. Role of primate visual area V4 in the processing of 3-D shape characteristics defined by disparity. J. Neurophysiol. 94, 2856–2866. ( 10.1152/jn.00802.2004) [DOI] [PubMed] [Google Scholar]
- 71.Yamane Y, Carlson ET, Bowman KC, Wang Z, Connor CE. 2008. A neural code for three-dimensional object shape in macaque inferotemporal cortex. Nat. Neurosci. 11, 1352–1360. ( 10.1038/nn2202) [DOI] [PMC free article] [PubMed] [Google Scholar]
- 72.Uka T, Tanabe S, Watanabe M, Fujita I. 2005. Neural correlates of fine depth discrimination in monkey inferior temporal cortex. J. Neurosci. 25, 10 796–10 802. ( 10.1523/JNEUROSCI.1637-05.2005) [DOI] [PMC free article] [PubMed] [Google Scholar]
- 73.Tsutsui K-I, Jiang M, Yara K, Sakata H, Taira M. 2001. Integration of perspective and disparity cues in surface-orientation-selective neurons of area CIP. J. Neurophysiol. 86, 2856–2867. [DOI] [PubMed] [Google Scholar]
- 74.Tsutsui K-I, Sakata H, Naganuma T, Taira M. 2002. Neural correlates for perception of 3D surface orientation from texture gradient. Science 298, 409–412. ( 10.1126/science.1074128) [DOI] [PubMed] [Google Scholar]
- 75.Liu Y, Vogels R, Orban GA. 2004. Convergence of depth from texture and depth from disparity in macaque inferior temporal cortex. J. Neurosci. 24, 3795–3800. ( 10.1523/JNEUROSCI.0150-04.2004) [DOI] [PMC free article] [PubMed] [Google Scholar]
- 76.Tanaka S, Fujita I. 2015. Computation of object size in visual cortical area V4 as a neural basis for size constancy. J. Neurosci. 35, 12 033–12 046. ( 10.1523/JNEUROSCI.2665-14.2015) [DOI] [PMC free article] [PubMed] [Google Scholar]
- 77.Sakata H, Taira M, Kusunoki M, Murata A, Tanaka Y. 1997. The parietal association cortex in depth perception and visual control of hand action. Trends Neurosci. 20, 350–357. ( 10.1016/S0166-2236(97)01067-9) [DOI] [PubMed] [Google Scholar]
- 78.Cumming BD, DeAngelis GC. 2001. The physiology of stereopsis. Annu. Rev. Neurosci. 24, 203–238. ( 10.1146/annurev.neuro.24.1.203) [DOI] [PubMed] [Google Scholar]
- 79.Neri P. 2005. A stereoscopic look at visual cortex. J. Neurophysiol. 93, 1823–1826. ( 10.1152/jn.01068.2004) [DOI] [PubMed] [Google Scholar]
- 80.Tsutsui K-I, Taira M, Sakata H. 2005. Neural mechanisms of three-dimensional vision. Neurosci. Res. 51, 221–229. ( 10.1016/j.neures.2004.11.006) [DOI] [PubMed] [Google Scholar]
- 81.Orban GA, Janssen P, Vogels R. 2006. Extracting 3D structure from disparity. Trends Neurosci. 29, 466–473. ( 10.1016/j.tins.2006.06.012) [DOI] [PubMed] [Google Scholar]
- 82.Parker AJ. 2007. Binocular depth perception and the cerebral cortex. Nat. Rev. Neurosci. 8, 379–391. ( 10.1038/nrn2131) [DOI] [PubMed] [Google Scholar]
- 83.Roe AW, Parker AJ, Born RT, DeAngelis GC. 2007. Disparity channels in early vision. J. Neurosci. 27, 11 820–11 831. ( 10.1523/JNEUROSCI.4164-07.2007) [DOI] [PMC free article] [PubMed] [Google Scholar]
- 84.Roe AW, Chelazzi L, Connor CE, Conway BR, Fujita I, Gallant JL, Lu H, Vanduffel W. 2012. Toward a unified theory of visual area V4. Neuron 74, 12–29. ( 10.1016/j.neuron.2012.03.011) [DOI] [PMC free article] [PubMed] [Google Scholar]
- 85.Masson GS, Busettini C, Miles FA. 1997. Vergence eye movements in response to binocular disparity without depth perception. Nature 389, 283–286. ( 10.1038/38496) [DOI] [PubMed] [Google Scholar]
- 86.Abdolrahmani M, Doi T, Shiozaki HM, Fujita I. 2015. Pooled, but not single-neuron, responses in macaque V4 represent a solution to the stereo correspondence problem. J. Neurophysiol. 115, 1917–1931. ( 10.1152/jn.00487.2015) [DOI] [PMC free article] [PubMed] [Google Scholar]
- 87.Takemura A, Inoue Y, Kawano K, Quaia C, Miles FA. 2001. Single-unit activity in cortical area MST associated with disparity-vergence eye movements: evidence for population coding. J. Neurophysiol. 85, 2245–2266. [DOI] [PubMed] [Google Scholar]
- 88.Theys T, Srivastava S, van Loon J, Goffin J, Janssen P. 2012. Selectivity for three-dimensional contours and surfaces in the anterior intraparietal area. J. Neurophysiol. 107, 995–1008. ( 10.1152/jn.00248.2011) [DOI] [PubMed] [Google Scholar]
- 89.Yoshioka T, Doi T, Abdolrahmani M, Fujita I. 2015. Area MT neurons at the population level represent binocular disparity in a manner between correlation-based and match-based representations. Abstract 8th Federation of the Asian and Oceanian Physiological Societies (FAOPS) Congress J. Physiol. Sci. 65(suppl 2), ABS0341. [Google Scholar]
- 90.Larsson J, Heeger DJ. 2006. Two retinotopic visual areas in human lateral occipital cortex. J. Neurosci. 26, 13 128–13 142. ( 10.1523/JNEURSOCI.1657-06.2006) [DOI] [PMC free article] [PubMed] [Google Scholar]
- 91.Kumano H, Tanabe S, Fujita I. 2008. Spatial frequency integration for binocular correspondence in macaque area V4. J. Neurophysiol. 99, 402–408. ( 10.1152/jn.00096.2007) [DOI] [PubMed] [Google Scholar]
- 92.Tsao DY, et al. 2003. Stereopsis activates V3A and caudal intraparietal areas in macaques and humans. Neuron 39, 555–568. ( 10.1016/S0896-6273(03)00459-8) [DOI] [PubMed] [Google Scholar]
- 93.Hansen KA, Kay KN, Gallant JL. 2007. Topographic organization in and near human visual area V4. J. Neurosci. 27, 11 896–11 911. ( 10.1523/JNEUROSCI.2991-07.2007) [DOI] [PMC free article] [PubMed] [Google Scholar]
- 94.Aoki SC, Shiozaki HM, Fujita I. 2012. Reversed depth perception in binocularly anti-correlated stimuli: does it occur in an absolute or relative frame of reference? Society for Neuroscience Abstracts 264.05. [Google Scholar]
Associated Data
This section collects any data citations, data availability statements, or supplementary materials included in this article.
Data Availability Statement
Data are available on request from the corresponding author.