Abstract
The key problem of stereoscopic vision is traditionally defined as accurately finding the positional shifts of corresponding object features between left and right images. Here, we demonstrate that the problem must be considered in a four-dimensional parameter space; with respect not only to shifts in space (X, Y), but also spatial frequency (SF) and orientation (OR). The proposed model sums outputs of binocular energy units linearly over the multi-dimensional V1 parameter space (X, Y, SF, OR). Theoretical analyses and physiological experiments show that many binocular neurons achieve sharp binocular tuning properties by pooling the output of multiple neurons with relatively broad tuning. Pooling in the space domain sharpens disparity-selective responses in the SF domain so that the responses to combinations of unmatched left–right SFs are attenuated. Conversely, pooling in the SF domain sharpens disparity selectivity in the space domain, reducing the possibility of false matches. Analogous effects are observed for the OR domain in that the spatial pooling sharpens the binocular tuning in the OR domain. Such neurons become selective to relative OR disparity. Therefore, pooling allows the visual system to refine binocular information into a form more desirable for stereopsis.
This article is part of the themed issue ‘Vision in our three-dimensional world’.
Keywords: binocular vision, stereopsis, striate cortex, receptive field, spatial frequency, orientation
1. Introduction
When we see the three-dimensional world with two eyes, slightly different two-dimensional images are projected onto the left and right retinae, due to the horizontal displacement of the eyes. The difference between the two retinal images (binocular disparity) is a sufficient cue for our depth perception [1,2]. Since the discovery that the convergence of the signals from left and right eyes takes place in the early visual cortex [3], responses of neurons under stereoscopic viewing conditions have been investigated extensively [4–7]. Detailed descriptions of underlying neural mechanisms have been refined allowing model-based predictions of binocular responses [8–14].
Although the binocular disparity energy model [10] remains a basic building block of the front-end stereoscopic processing, various extensions have been proposed to describe binocular properties of actual neurons [15–17]. While physiological studies examined various schemes of combining outputs of multiple disparity energy units to explain actual neuronal responses, they were generally limited to a single stimulus parameter such as retinotopic space [18,19], orientation (OR) [17,20] and spatial frequency (SF) [21]. For example, pooling in space may be schematically illustrated in figure 1a. We think this simple schema needs to be revised.
Figure 1.
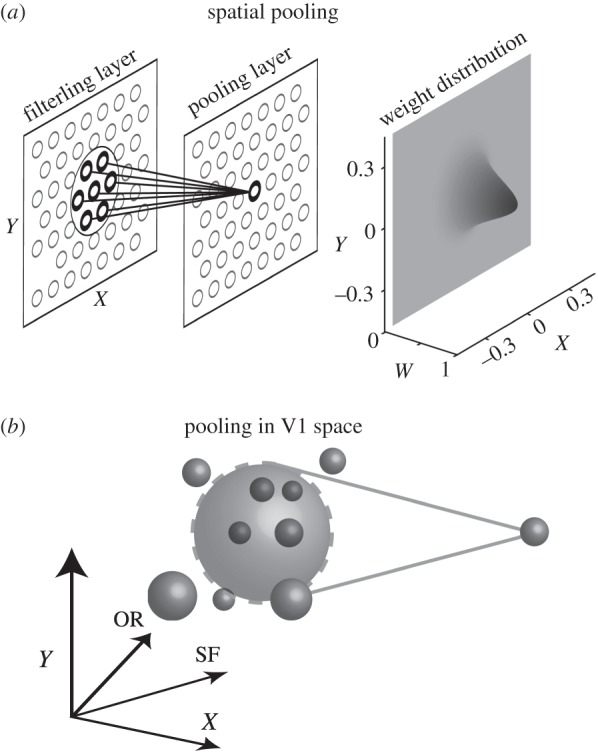
(a) Pooling in the space domain (X, Y) is illustrated schematically. A neuron in a pooling layer receives afferent input from the neurons within the area enclosed by the circle in the preceding filtering layer. Gaussian weight distribution is usually assumed. (b) Since V1 cortical sheet is organized according to not only space (X, Y) but also OR and SF, the notion of pooling must be generalized to include these four dimensions. Intuitively, the degree of pooling is determined by the number of subunits (small spheres) included within the pooling sphere (large sphere).
Our motivation for this study is a realization that it is necessary to generalize the input domain to the multi-dimensional V1 parameter space, i.e. retinotopic space, SF and OR as illustrated in figure 1b, and consider the effects simultaneously. Suggestions have been made by computational investigations that pooling binocular energy responses across OR and scales, as well as space, produces an unambiguous representation of binocular disparity [22,23]. Our recent results [21] also indicate a possibility that there is cross-talk between domains. For example, pooling in the SF domain has an effect of making the spatial (disparity) tuning profile narrower. In this context, none of the previous studies have examined the possible effects of pooling in such a multi-dimensional parameter space in a systematic manner.
In this study, we propose a generalized pooling model where the binocular energy responses are pooled linearly (i.e. summed) over the multi-dimensional V1 parameter space. Theoretical and experimental analyses of the generalized pooling model allow detailed examination of pooling on binocular disparity selectivity of neurons. Responses of neurons in the cat primary visual cortex are compared with those expected from the model. We found neurons that have narrower binocular SF interaction bandwidth than monocular SF bandwidth. In addition, neurons with narrower binocular OR interaction bandwidth than monocular OR bandwidth were also found. The latter neurons effectively achieve a sharp tuning to interocular OR difference within a relatively broad range of monocular ORs. Such neurons, useful for coding OR disparity, were previously thought to be absent in V1 [17]. Our analyses based on the generalized pooling model reveal that such sharp binocular selectivities are likely to be generated by the pooling in the spatial domain, rather than by the direct integration of multiple SF/OR channels, for the majority of cells recorded.
2. Material and methods
Extracellular single-unit recordings were made in area 17 of 17 anaesthetized and paralysed adult cats (nine males and eight females) weighing between 2.0 and 4.5 kg.
(a). Surgical procedure and animal maintenance
After initial pre-anaesthetic doses of hydroxyzine (Atarax; 2.5 mg) and atropine (0.05 mg), anaesthesia was induced and maintained with isoflurane (2–3.5% in O2) for the remainder of the surgical preparation. During surgery, lidocaine was injected subcutaneously or applied topically at all points of pressure and possible sources of pain. A rectal temperature probe was inserted, and body temperature was monitored and maintained near 38°C with a heating pad (Nihon-Koden). Electrocardiographic (ECG) electrodes were secured and the femoral vein was catheterized. Tracheotomy was then performed, and a glass tracheal tube was inserted for artificial respiration. The animal was secured in a stereotaxic apparatus with ear and mouth bars and clamps on the orbital rim. Anaesthesia was switched to sodium thiopental (Ravonal, 1.0 mg kg−1 h−1), and paralysis was induced with a loading dose of gallamine triethiodide (Flaxedil, 20 mg). For the remainder of the experiment, the infusion fluid was delivered, containing sodium thiopental (Ravonal, 1.0 mg kg−1 h−1), gallamine triethiodide (Flaxedil, 10 mg kg−1 h−1) and glucose in Ringer's solution. Artificial ventilation was performed with a gas mixture of 70% N2O and 30% O2. The respiration rate and stroke volume were adjusted to maintain the end tidal CO2 between 3.5 and 4.3% throughout the experiment. A craniotomy was performed over the central representation of the visual field in area 17 approximately at Horsley–Clarke coordinates P4, L2.5 and the dura was reflected. Pupils were dilated with atropine (1% topical), and nictitating membranes were retracted with phenylephrine hydrochloride (Neosynesin, 5%). Contact lenses with 4 mm artificial pupils were placed on each cornea. Vital signs (expiratory CO2, body temperature, heart rate, ECG recordings and intratracheal pressure) were monitored and maintained within a normal range throughout the experiment.
To record the activity of single units, tungsten electrodes (A-M Systems) were lowered into a region of cortex exposed by craniotomy. Agar was applied around the electrodes to prevent desiccation, and melted wax was layered over the agar to create a sealed chamber and reduce cortical pulsation. Electrical signals from the microelectrodes were amplified (10 000×) and bandpass filtered (300–5000 Hz). Spikes were sorted by their waveforms and time stamped with 40 µs resolution [24]. When the electrodes were retracted, electrolytic lesions were made at intervals of 500–1200 µm for each electrode track.
Experiments typically lasted for 4 days. At the end of an experiment, the animal was administered an overdose of pentobarbital sodium (Nembutal), and cortical tissue was prepared for histological examination. Electrode tracks were reconstructed, and cortical laminae were identified.
(b). Visual stimulation and data analysis
Visual stimuli were generated by computer and displayed on a cathode ray tube display (a resolution of 1600 × 1024 pixels, refreshed at 76 Hz; GDM-FW900, Sony) using only the green channel to avoid colour misconvergence across channels. The animal viewed the display through a haploscope, which allowed visual stimuli to be presented separately to each eye. The visual fields subtended 23° × 30° for each eye (800 × 1024 pixels) at a viewing distance of 57 cm. This configuration allowed us to map left and right halves of the display to the two eyes while guaranteeing time-locked dichoptic stimulation. A black opaque separator was placed between the two visual fields to preclude the projection of stimuli to an unintended eye. In each experiment, the luminance nonlinearity of the display was measured using a photometer (Minolta CS-100) and linearized by gamma-corrected lookup tables.
Once a single unit was isolated, preliminary observations were performed to determine its optimal OR, SF, the centre location and the size of its RF. Then we assessed OR and SF tuning for each eye with flashed grating stimuli (typically refreshed at 39 ms; three video frames) [25,26] and/or drifting sinusoidal gratings (drifted at 2 Hz). The Michelson contrast of the grating stimuli was 50%. During the presentation of these stimuli, blank field at the mean luminance of the display was presented in an eye which was not under test. Based on these tests, optimal OR and SF as well as bandwidths for OR and SF tunings were determined for each eye. These values were used later in setting up binocular interaction experiments.
(c). Partitioning stimulus domain
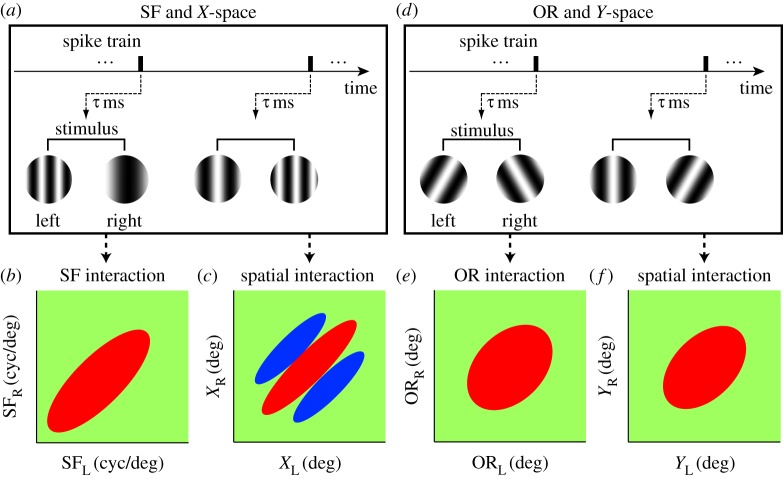
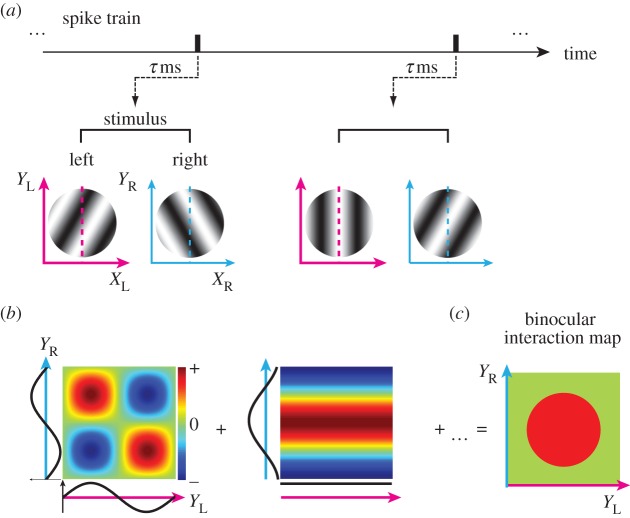
As is explained in §1 (figure 1), we wish to determine the extent of pooling in the four-dimensional (X, Y, SF, OR) domain and to do so in the binocular context, which nominally makes the space to be eight-dimensional. Owing to the sheer number of stimulus conditions, exhaustive exploration of such a space is impractical experimentally. Therefore, we partitioned the four-dimensional space into (X, SF) and (Y, OR) subspaces for actual measurements. Note that X and Y are defined with respect to the preferred OR for each eye of each neuron. X and Y are the dimensions perpendicular and parallel, respectively, to the preferred OR. Figure 2a,d schematically illustrates the reverse correlation measurements of binocular interactions in the (X, SF) and (Y, OR) subspaces, respectively. We defined the binocular stimuli for exploring the (X, SF) subspace as binocular SF stimulus in which various combinations of SF and phases were presented dichoptically. Likewise, for exploring the (Y, OR) subspace, binocular OR stimulus was used in which various combinations of OR and phases were presented dichoptically.
Figure 2.
Outline of experiments and analyses is illustrated. Ideally, pooling should be explored in the four-dimensional space (X, Y, SF, OR) as shown in figure 1. However, simultaneous exploration of this space is impossible due to the prohibitive number of conditions. Thus, we partitioned the experiment into two subspaces: (X, SF) and (Y, OR). (a) Pooling estimation in the (X, SF) subspace, i.e. in SF domain and X space domain. For this purpose, reverse correlation analysis is performed to obtain a binocular SF interaction map (b) and a binocular spatial interaction map (c) simultaneously. Spike data are correlated with dichoptic SF grating stimuli. The elongation along the 45° diagonal in each domain is the key for estimating the degree of pooling. (d) Pooling estimation in the (Y, OR) subspace, i.e. in OR domain and Y space domain. Here, reverse correlation analysis is performed to obtain a binocular OR interaction map (e) and a binocular spatial interaction map (f) simultaneously in an analogous manner to those in the (X, SF) domain.
A binocular SF stimulus consisted of pairs of dichoptic sinewave gratings with various combinations of left–right SFs (SFL, SFR) and phases (phL, phR). The gratings were oriented at the optimal OR for each eye for the target cell. Twelve SFs and 8 phases per eye were used, so the total number of stimuli presented in a single block was 9416, i.e. 9216 binocular (12 × 12 × 8 × 8), 192 monocular (2 eyes × 12 × 8), plus 8 blank conditions. Stimuli were presented in random order within a block. Blocks were repeated (with stimuli rerandomized) 8–20 times as needed to obtain the necessary number of spikes for each neuron. The range of the SF was set to cover the cell's SF band sufficiently and 12 SFs were sampled at even intervals in linear scale. Directly analysing data from this experiment using reverse correlation in the stimulus parameter space produces a four-dimensional dataset (SFL, SFR, phL, phR) from which a binocular SF interaction map (figure 2b) was computed. Analysing the same data using reverse correlation in the stimulus image space produced a binocular spatial interaction map in the (XL, XR) domain (figure 2c). Taking these maps together, pooling in the (X, SF) subspace was determined for each neuron. Similar techniques were used in our previous study [21] and additional details are described in §3.
A binocular OR stimulus consisted of pairs of dichoptic sinewave gratings with various combinations of left–right ORs (ORL, ORR) and phases (phL, phR). The optimal SF (average of left and right optimal SFs) at the optimal OR for the target cell was used for all gratings. For this part of the experiment, 11 ORs and 8 phases per each eye were used, so the total number of stimuli presented in a single block was 7928, i.e. 7744 binocular (11 × 11 × 8 × 8), 176 monocular (2 eyes × 11 × 8), plus 8 blank conditions. The range of the OR was set to cover the cell's OR band sufficiently and 11 ORs were sampled at even intervals in linear scale. Analysis of data from this part of experiment was similar to those for binocular SF stimulus. Directly analysing data in the stimulus parameter space produced a four-dimensional dataset (ORL, ORR, phL, phR), from which a binocular OR interaction map (figure 2e) was computed. Analysing the same data using reverse correlation in the stimulus image space produced a binocular spatial interaction map in the (YL, YR) domain (figure 2f). Together, pooling in the (Y, OR) subspace was determined.
The blank stimuli had the same uniform luminance for both left and right display areas. The stimuli were updated at 38 Hz (every two video frames), and their size was adjusted to be slightly larger (approx. 1.5–3 times) than the size of monocular RFs (the average of left and right RFs).
3. Results
We recorded from 45 complex cells in A17 of adult cats. Each cell was classified into simple or complex based on standard criteria, F1/F0 ratio [27]. Of these, 39 of 45 were tested by binocular SF stimuli and 8 of 45 were tested by binocular OR stimuli. Two of 45 were tested by both types of stimuli. The data overlap partially with those presented in our previous study [21]. However, new analyses in (X, SF) subspace were conducted in this study by allowing simultaneous presence of pooling in both spatial and SF domains. Data for experiments in (Y, OR) subspace were newly obtained. Example data in figures were drawn from these new data where possible.
(a). Partitioning four-dimensional pooling into (X, SF) and (Y, OR) subspaces
As illustrated in figure 1 and §2c, we wish to determine the extent of pooling in the four-dimensional (X, Y, SF, OR) domain. To achieve this, we examined neurons using the binocular SF stimulus (figure 2a) and the binocular OR stimulus (figure 2d).
In the first part, we describe responses of complex cells to the binocular SF stimulus to provide the simultaneous description of its selectivity in the stimulus parameter space (SFL, SFR, phL, phR) (figure 2b) and in the stimulus image space (XL, XR) (figure 2c). The extent of pooling over (X, SF) subspace is estimated by fitting a pooling model. We then examine the neurons' selectivity using the binocular OR stimulus in the same format as in the first part: responses are analysed in the stimulus parameter space (ORL, ORR, phL, phR) (figure 2e) and in the stimulus image space (YL, YR) (figure 2f). In the final part, we discuss the potential interaction between pooling over the (X, SF) and over the (Y, OR) subspaces.
(b). Pooling over the (X, SF) subspace
(i). Binocular spatial frequency interactions
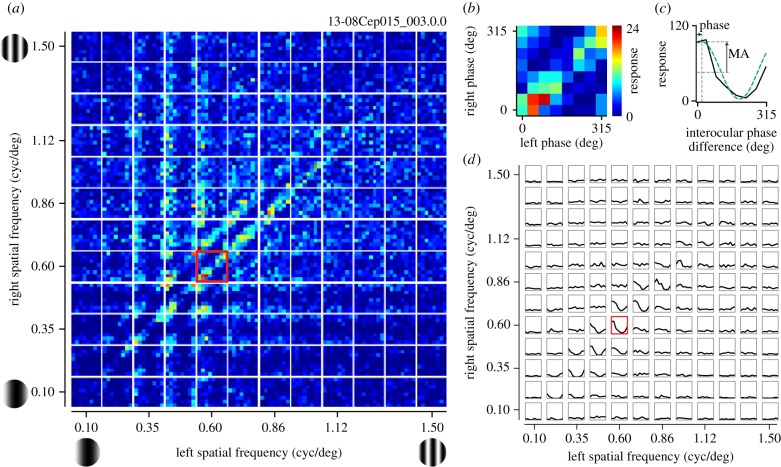
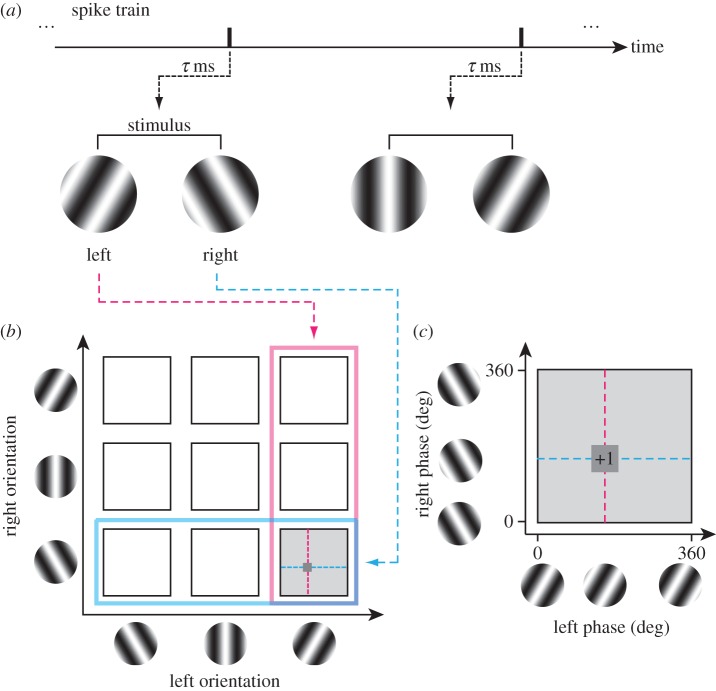
Binocular SF interactions were analysed using reverse correlation in the stimulus parameter space (SFL, SFR, phL, phR) (figure 3) [21]. Using spike data recorded while a binocular SF stimulus was presented, a pair of spike-triggered stimulus gratings were selected at the optimal correlation time delay (figure 3a). A spike-triggered stimulus was first used to select (SFL, SFR) in the joint binocular SF domain and then (phL, phR) in the joint phase subdomain (figure 3b,c). This procedure was repeated for all recorded spikes. Interocular phase difference (IOPD) tuning curves (figure 3e) were then computed by integrating each binocular phase selectivity map along constant interocular phase lines (figure 3d). The binocular SF interaction was quantified with the amplitude and phase of one-cycle sinusoid extracted from each IOPD tuning curve via Fourier analysis.
Figure 3.
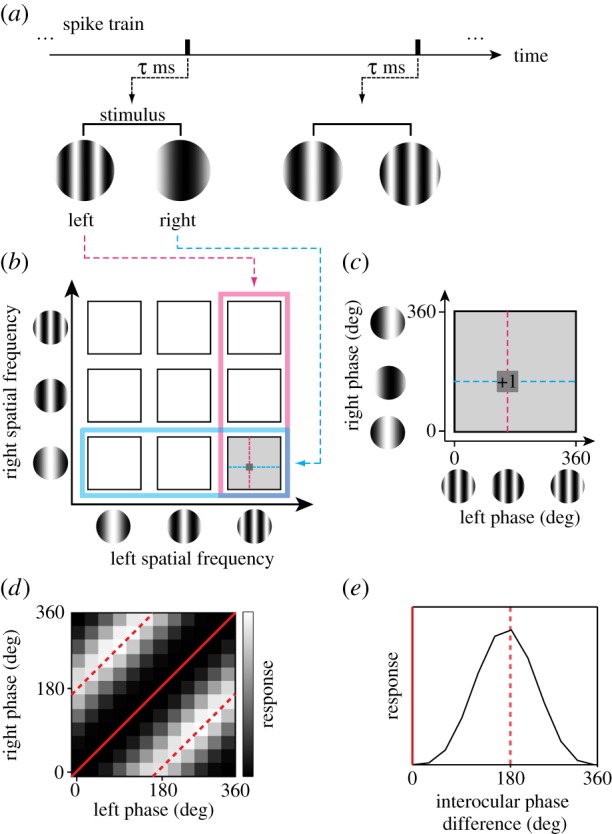
Reverse correlation analysis was performed to obtain a binocular SF interaction map. (a) Using spike data recorded while static sinewave grating stimuli were presented dichoptically in rapid flashes, a pair of spike-triggered stimuli was selected for an optimal correlation time delay. SF and phase parameters in the left and right eyes were extracted for the selected grating pair. (b) Spike-triggered average in a joint left–right SF domain. A spike was voted in a four-dimensional domain (SFL, SFR, phL, phR). The procedure may be understood in the following steps. First, a spike-triggered pair of SFs (SFL, SFR) was determined (left, pink; right, cyan). The selected pair was indicated by a grey square. (c) Then, within the selected joint phase subdomain (phL, phR), the spike was voted into a particular phase combination for the stimulus pair. Repeating this procedure for all recorded spikes, complete binocular phase selectivity maps were obtained for various SF pairs between the two eyes. (d) The model response of a disparity energy unit is illustrated in the joint (phL, phR) subdomain for a given combination of optimal (SFL, SFR). The strength of response is shown with grey scale. Constant interocular phase difference (IOPD) lines are indicated with red (solid line for 0° and broken line for 180°). (e) One-dimensional tuning curve to IOPD was derived from (d) by integrating it along constant disparity lines.
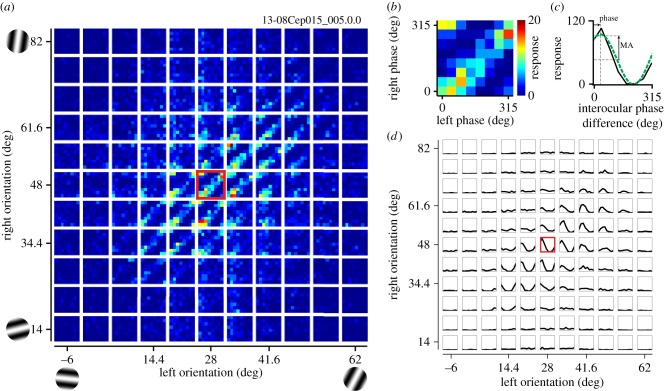
Figure 4a presents the data from a representative complex cell in the format described in figure 3b,c. Each small map depicts responses to combinations of phases for one SF pair, and such maps are arranged as a matrix of 12 × 12 binocular SF pairs. One of the maps marked with a red border is magnified in figure 4b to show a representative response property to phase combinations of the disparity-selective complex cell. The clear band of response along the 45° diagonals indicates that this cell has selectivity to a particular IOPD for this pair of (SFL, SFR). Figure 4c shows the IOPD tuning curve for this pair of (SFL, SFR). In figure 4d, such tuning curves are shown for all (SFL, SFR) combinations as a matrix similar to figure 4a in its arrangement. Note that that tuning curve has a strong modulation only for relatively matched SF pairs between the two eyes, and such modulation cannot be observed if difference of SF between the two eyes is large. Note that figure 4 is similar in format to one of the figures in Baba et al. [21], but it presents new data that are in a paired set with the (Y, OR) domain analyses described in §3d.
Figure 4.
A set of responses is shown for a representative complex cell to stimuli containing various combinations of phases and SFs. (a) The entire data are response strengths in a four-dimensional parameter space (SFL, SFR, phL, phR), and presented here as multiple cross-sections (phL, phR) at each (SFL, SFR) for clarity. Each small map presents selectivity to binocular phases (phL, phR), illustrating responses to various combinations of left and right phases. These small maps are arranged as a 12 × 12 matrix of left and right SFs (SFL, SFR). Colour scale shows the number of spikes collected for each pair of (phL, phR). One of the phase selectivity maps is marked with a red border and is magnified in (b). (b) Selectivity to binocular phase combination for the highlighted SF pair in (a) is shown. Strong responses are observed along a 45° diagonal where IOPD was constant. (c) One-dimensional tuning curve to IOPD was calculated from a binocular phase selectivity map shown in (b) by integrating responses to the same IOPD between the two eyes. A sinusoid was fitted to the tuning curve to determine the modulation amplitude and phase (green dashed line). (d) Tuning curves to IOPD are presented for all binocular combinations of SFs. The highlighted SF pair shown in (c) is indicated with a red border. The optimal SF and OR for the dominant eye of this cell were 0.49 cpd and 28°, respectively. Values for the non-dominant eye were 0.59 cpd and 49°.
(ii). Spatial binocular interactions for the X-dimension
To examine the spatial aspect of binocular interactions, we also performed reverse correlation analysis in the stimulus image space (XL, XR) using methods similar to previous studies (figure 5) [12,13,18,21]. Here, XL and XR are defined as the axes perpendicular to the optimal OR for left and right eye, respectively. Reverse correlation was performed on the same data as in figure 3 except that the actual stimulus image patterns were used rather than parameters, SF and phases (figure 5a). In this process, spike-triggered one-dimensional sinewave gratings along the XL- and XR-axes were multiplied between the two eyes to produce binocular interaction terms (figure 5b). By summing the terms for all spikes, a binocular interaction map was obtained in the joint left–right space domain (XL, XR) (figure 5c). In this joint left–right space domain (XL, XR), binocular disparity is constant along the +45° diagonal, whereas it changes along the −45° diagonal. Therefore, while maintaining a constant disparity, stimulus position changes along the +45° diagonal. On the other hand, disparity changes along the −45° diagonal.
Figure 5.
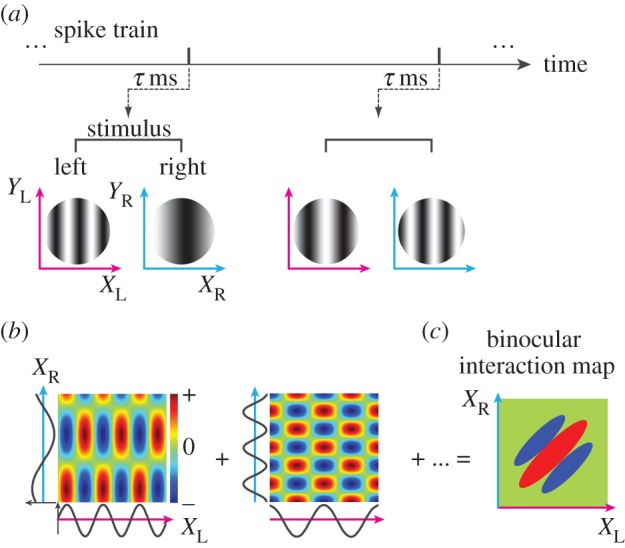
Reverse correlation analysis in the joint left–right X (space) domain was performed using the identical spike train and set of stimuli to obtain a bRF for a given neuron. (a) Using a spike train recorded while binocular sinewave grating stimuli were presented, spike-triggered stimulus pairs were selected for an optimal correlation time delay. (b) Binocular interaction terms were calculated from each pair of spike-triggered gratings as follows. The XL- and XR-axes are defined as the axis orthogonal to preferred OR in the left and right eyes, respectively. The preferred ORs are usually different between the eyes by 10–20° due to cyclorotation of the eyes by paralysis and anaesthesia. These one-dimensional spike-triggered sinusoids in the XL and XR domains were multiplied to produce binocular interaction terms in the joint XL–XR domain. Positive values (red) mean that stimuli with the same contrast polarity were presented between the two eyes, whereas negative values (blue) mean those with the opposite polarity were presented between the two eyes. (c) A binocular interaction map was obtained by summing these interaction terms for all spike-triggered stimulus pairs. Binocular disparity is constant along the +45° diagonal in the map, whereas disparity changes along −45° diagonal.
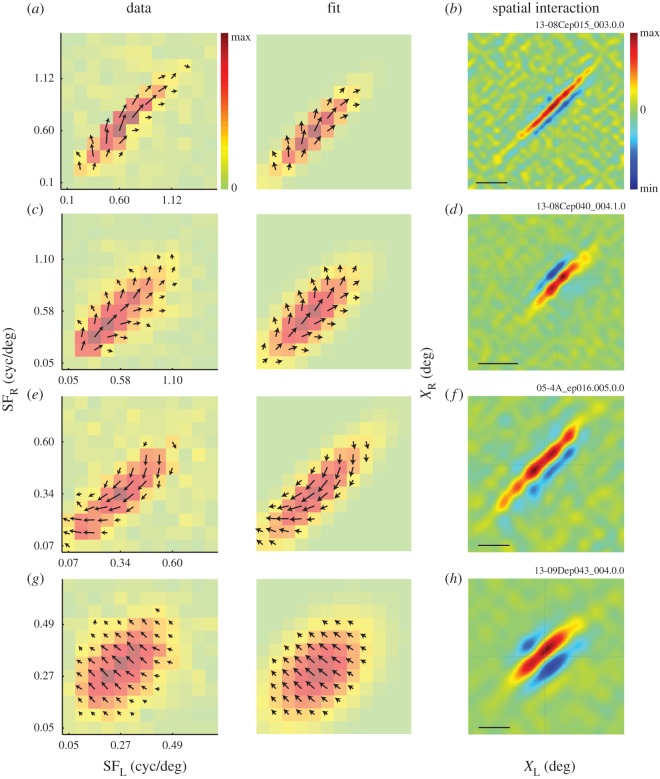
Taking the results from the above analyses together, we are able to observe the binocular interaction data in both joint SF and joint X domains. For the binocular SF domain, modulation amplitudes and phase were extracted from each IOPD tuning curve. These values are presented for four representative complex cells as a combination of a heat map and a vector field for each cell (figure 6, left column). Each pixel in a heat map and arrow length represent the degree of modulation at each (SFL, SFR) combination. An arrow direction represents the phase. Again, this map is clearly elongated along 45° diagonal indicating that this neuron was sensitive to stimulus that has matched SF components. The vector fields for the four neurons appear to have different patterns of vector rotation depending on the position within a map. These rotations occur due to an offset between the centre of the receptive field and the phase origin used to generate stimulus patterns. Since the cell depicted in figure 6g happened to have a zero offset between the two, the vector field is uniform. Note that we present the raw data in these figures, and for estimating the elongation index (EI), we use both the amplitude (heat map) and the phase (vector field) information in the model fitting procedure. Fitted model parameters exhibit exactly the same (but smoother) vector rotations as the raw data (figure 6, middle column). Therefore, the elongated amplitude map and rotating phase map are both captured well by the model, and using the phase information improves the estimation of EI. These phase rotations become relevant later when considering phase maps for each pooled subunit (figure 7), but are of no consequence for interpreting the data presented here.
Figure 6.
The binocular SF interaction maps and the corresponding binocular spatial interaction maps are shown for four complex cells from three animals (a and c are from the same animal). These maps show the results of the analysis outlined in figure 2b and c, respectively. The left column shows binocular SF interaction maps (SFL–SFR) obtained by performing reverse correlation in the stimulus parameter space and extracting modulation amplitudes and phases from IOPD tuning curves for all binocular SF combinations (figure 4d). Colour of each square and arrow length represent the modulation amplitude. An arrow direction represents the phase. The middle column presents the results of model fit to the data. Both the amplitude and the phase information in the raw data are used in the fitting procedure. The right column shows the corresponding binocular spatial interaction maps (XL–XR) obtained by a reverse correlation analysis in the joint left–right space domain. Panel (a) depicts maps for the same neuron shown in figure 4. Scale bars: 2°. Animal-cell identification number (ID) is depicted above the top-right corner of spatial interaction maps for each cell. The first six characters represent the animal ID.
Figure 7.
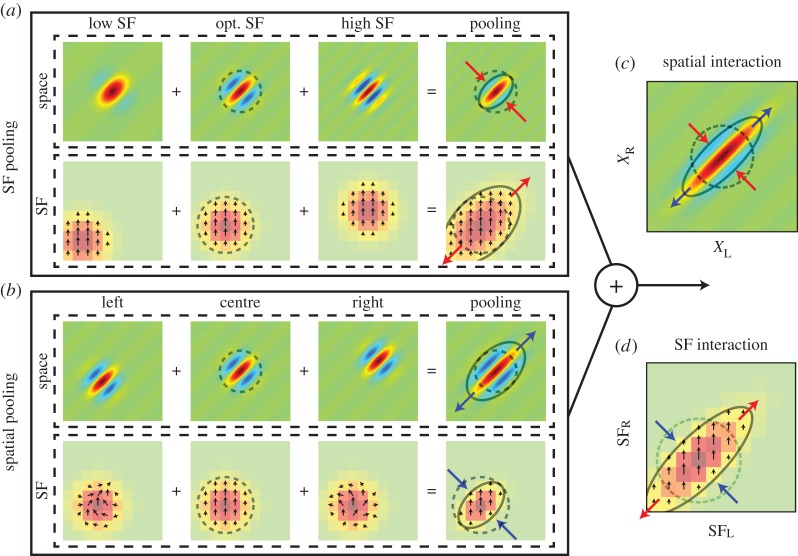
Effects of simultaneous SF pooling and spatial pooling are predicted by a model. (a) SF pooling causes an elongation of a left–right SF interaction map (SFL–SFR) by extending its extent along the 45° axis (outward pair of red arrows). But it also reduces the extent of the spatial (XL–XR) binocular interaction map along the −45° axis (inward pair of red arrows). Each column of low, opt., and high SF shows a binocular interaction map (top row) and its binocular SF interaction map (bottom row) for a binocular energy unit with low, optimal and high SF, respectively. Other parameters for each model are identical across subunits. Arrows in the SF interaction maps indicate the phase of IOPD tuning (figure 6, left). Since subunits are located at the same position, the phase is unchanged. (b) Conversely to (a), spatial pooling extends the spatial binocular interaction map (XL–XR) along the 45° axis (outward pair of blue arrows). But it also reduces the extent of the left–right SF interaction map (SFL–SFR) by canceling responses at upper left and lower right areas of the map (inward pair of blue arrows). The model pools subunits densely at many spatial positions, but for clarity is shown with three subunits: left, centre and right. Note that arrows in SF interaction maps depict the phase of tuning curves like those in figure 4d. They show complex patterns of rotation for left and right. These phase variations are the basis of response cancellation. (c) When SF pooling and spatial pooling are present simultaneously, effects from both on the spatial binocular interaction map (XL–XR) add up, causing further elongation (outward blue arrows and inward red arrows). (d) Binocular SF map (SFL–SFR) is shown. This map is also extended further by the constructive addition of effects from simultaneous SF and space pooling (outward red arrows and inward blue arrows).
Figure 6b,d,f,h shows the spatial binocular interaction maps for the four neurons. In each of these examples, there is a narrow strip of positive interaction along 45° diagonal, indicating that the neuron is sharply tuned for binocular disparity and its preferred disparity is constant for a relatively large range of X-positions.
(c). Predictions of binocular responses in (X, SF) subspaces
As we have seen so far, analyses of binocular disparity selectivity of a representative complex cell in stimulus parameter space (figure 2b) and stimulus image space (figure 2c) exhibit substantial elongation of maps along the 45° diagonal. The complex cell was sensitive to IOPD only for highly matched SF pairs (figure 6a). This neuron also showed a spatial binocular interaction map elongated along the 45° diagonal (figure 6b). It appears that, to achieve the extensive elongations we observe, the neuron may collect inputs from subunits over the (X, SF) subspaces, since a single disparity energy subunit shows circular, non-oriented interaction maps in both domains [19,21]. But, to what extent does a neuron collect inputs over each space and SF domain? To address this question, we must introduce a model as described below.
(i). (X, SF) pooling model
To estimate the contributions from X and SF pooling, we analysed a pooling model that was created by linearly summing the responses of binocular energy subunits distributed over the (X, SF) subspace. Although the organization of the model is explained briefly in the following paragraphs and in figure 7, details of the model are provided in the electronic supplementary material, appendix as well as its assumptions and derivations of equations.
Figure 7 depicts the results of a model prediction that incorporates pooling in both the space and SF domains. Effects of SF and space pooling are computed separately first, as illustrated in figure 7a and b, respectively. Then, these predictions are combined to arrive at the final result. In figure 7a, subunits are distributed over the SF domain. Since each subunit has a different preferred SF, locations of tuning peaks are different in the binocular SF interaction map (figure 7a, bottom row). The variation of the preferred SF is also reflected in the spatial binocular interaction maps (figure 7a top row; progressively finer maps, left to right). The subunit tuned to low SF has a spatial binocular interaction map with low binocular disparity frequency (the frequency of a Gabor function oriented at 45° in (XL–XR) domain), whereas a subunit with high SF has a spatial binocular interaction map with high binocular disparity frequency. When responses of these subunits are combined, the left–right SF interaction map (SFL–SFR) becomes elongated (bottom row; outward pair of red arrows). But, at the same time, it reduces the extent of spatial (XL–XR) binocular interaction map along the −45° diagonal (top row; inward pair of red arrows) by cancelling the side-band responses. Note that, with SF pooling alone, the (XL–XR) map is not extended along the +45° diagonal when compared with its underlying subunits.
Conversely to SF pooling, spatial pooling affects these maps in an opposite manner (figure 7b). Here, subunits are distributed over the space domain as indicated by progressive shift of (XL–XR) profiles (upper row). Although the position shift does not change the strength (modulation amplitudes) of binocular SF interactions or its position in the domain, it shifts the phase of IOPD tuning curve as indicated by opposite rotation of arrows for the unit located at left and right (bottom row). The amount of shift is proportional to both the difference of SF between the two eyes and the amount of offset between stimulus and RF. Note therefore that phase shifts of the IOPD tuning curve are absent if the left and right SF are matched. As a result, by pooling the subunits distributed over the space domain, the spatial binocular interaction map (XL–XR) is extended along the 45° diagonal (top row; outward pair of blue arrows). But the same spatial pooling also reduces the extent of the left–right SF interaction map (SFL–SFR) by cancelling responses at upper left and lower right areas of the map (bottom row; inward pair of blue arrows) due to the phase shift in IOPD tuning curves.
When pooling is present in both space and SF domains simultaneously, effects from the two on the spatial binocular interaction map (XL–XR) constructively add up, causing further elongation (simultaneous outward blue arrows and inward red arrows) as illustrated in figure 7c. Similarly, the joint pooling also causes further elongation of the binocular SF interaction map by the constructive addition of effects from simultaneous SF and space pooling (outward red arrows and inward blue arrows) as illustrated in figure 7d.
(ii). Simultaneous estimation of spatial pooling and spatial frequency pooling
Based on the pooling model illustrated schematically above in §3c(i), we are now able to estimate the extent of pooling in space and SF domain for each complex cell by fitting the data. Several assumptions had to be made as described in detail in the electronic supplementary material, appendix. Of these, one key assumption was the SF bandwidth, because it determines tuning profiles of binocular energy subunits in the (XL–XR) and (SFL–SFR) domains. We used the average monocular SF bandwidth of 1.3 octaves (full width at half height) for simple cells in the cat striate cortex reported by Movshon et al. [28]. The value for SF bandwidth of subunits cannot be obtained directly from our complex cell data since they are likely to reflect various degrees of pooling in X and SF domains.
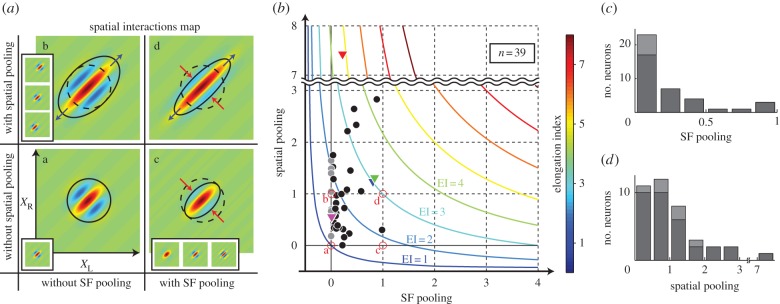
Based on the assumption of constant SF bandwidth, the simultaneous estimation is possible either in the (XL–XR) or (SFL–SFR) domain data, and will result in the same value, as illustrated in figure 7. Here, we arbitrarily use the (XL–XR) domain. Results of the simultaneous estimation of pooling in the space and SF domains are shown in figure 8. The circular (XL–XR) map for a single binocular disparity energy subunit (figure 8a: a) serves as the baseline. The degree of extent increase along 45° diagonal indicates the degree of space pooling (figure 8a: b). Conversely, the degree of shrinkage along the −45° diagonal reflects the degree of SF pooling (figure 8a: c).
Figure 8.
Contributions of SF pooling and spatial pooling are estimated for each neuron. (a) A matrix of predictions of binocular interaction maps is shown for four cases depending on the presence/absence of SF pooling and spatial pooling. Gabor function was fit to each binocular interaction map. Then the degree of shrinkage and elongation was estimated. The extent of spatial pooling was estimated based on the length of the binocular interaction map along the 45° diagonal (compare a and b). The extent of SF pooling was estimated by the width of the binocular interaction map along the −45° diagonal (compare a and c). When a neuron collects inputs over space and SF domains, the binocular interaction becomes elongated along the 45° diagonal and shrunken along the −45° diagonal (d). (b) Spatial pooling and SF pooling were estimated simultaneously for binocular disparity-selective complex cells (n = 39). Red open circles correspond to a–d in (a). Triangles with red, blue, green and magenta indicate the example neurons shown in figure 6a,b,c,d, respectively. Grey circles indicate the neurons which were fitted by narrower SF bandwidth than 1.3 octaves, without which the SF pooling would have been negative. Coloured curves are hyperbolic functions that depict various degrees of spatial and SF pooling estimated as elongation index (EI). (c) and (d) Histograms of SF pooling and spatial pooling, respectively.
The estimated extent of pooling for our sample of cells is shown in figure 8b. In this figure, data points that are away from both horizontal and vertical axes are the cells that pool energy subunits in both the space and the SF domains simultaneously. Roughly about 10 out of 39 units appear to pool in both the space and the SF domains. The majority of neurons, however, appear to be pooling largely in the space domain only (cells on or near the vertical axis in figure 8b).
Coloured curves in figure 8b are hyperbolic functions that depict various degrees of spatial and SF pooling estimated as elongation index (EI), where
Note that values of EI could be measured precisely from (SFL–SFR) or (XL–XR) interaction maps [21] without assuming the octave bandwidth of 1.3. This assumption was necessary to partition the EI into possible two components since there were neurons that seemed to be contributed from both of them. The values plotted in figure 8b, i.e. the SF and spatial pooling values, were defined as the ratio of the variance for the pooling weight function (a Gaussian) to the variance for subunit SF bandwidth or RF envelope, respectively. The octave bandwidth of subunits, of course, is expected to vary from one neuron to another. Therefore, if the assumption were incorrect, each point would move while constrained on the hyperbolic curve for that neuron.
(iii). Comparison of monocular spatial frequency tuning and binocular spatial frequency tuning
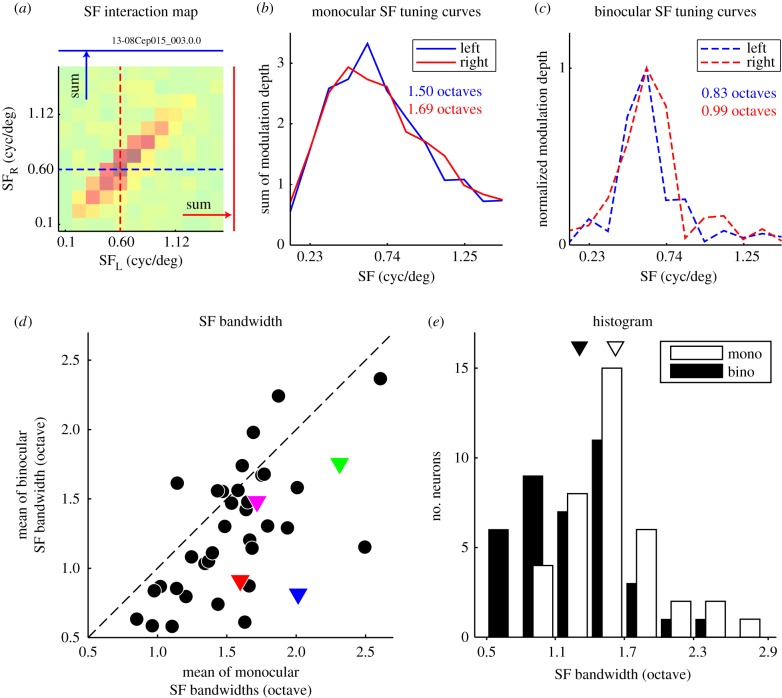
Returning to binocular SF interaction maps (e.g. figure 6, left column), the elongation of a binocular SF interaction map indicates that the neuron is responsive to wider range of SF while their binocular interaction is limited to a relatively narrow range. To reveal the quantitative relationship between the absolute range of monocular responsive SF bandwidth and that of binocular SF bandwidth, we calculated them from the binocular SF interaction map (figure 9a). Left and right monocular SF tuning curves were calculated by summing amplitudes of the map along the vertical and horizontal axes (figure 9b). Binocular SF tuning curves were extracted as the horizontal and vertical cross-sections of the map passing through its peak in 45° diagonal (figure 9c). The bandwidth of these SF tunings was defined as log2(SFhigh/SFlow), where SFhigh and SFlow are the SFs at which the responses fall to the half-maximum on the high and low SF sides of the tuning curve obtained by Gaussian fit to the data. The distributions of monocular and binocular SF tuning width are shown. The averages of bandwidth were 1.57 ± 0.06 octaves for the monocular SF tuning curve and 1.26 ± 0.07 for the binocular SF tuning curve. Binocular SF bandwidths were significantly narrower than monocular SF bandwidths (Wilcoxon's signed-rank test, p < 0.01). Note that these bandwidths already include the effects of accelerating nonlinearity for both monocular and binocular bandwidth estimates, since both are derived from the amplitudes of disparity tuning curves as illustrated in figure 4d (likewise for other cells). The monocular bandwidth measured in this way is also comparable to that measured by drifting sinusoidal grating stimuli (not shown), which also includes the effect of accelerating nonlinearities.
Figure 9.
Comparisons of monocular and binocular SF tuning bandwidths are illustrated. (a) The binocular SF interaction map for the neuron is shown in the format used in figure 6 (left). (b) Left and right monocular SF tuning curves were calculated by summing amplitudes of the map along the vertical and horizontal axes, respectively (blue and red solid curves). The octave bandwidth of SF tuning was defined as log2(SFhigh/SFlow), where SFhigh and SFlow are the spatial frequencies at which the amplitude falls to half of the maximum on the high and low SF sides, respectively. The tuning curves were obtained by Gaussian fit to the data. (c) Binocular SF tuning curves were obtained by extracting the horizontal and vertical cross-sections of the map passing through its peak on the 45° diagonal in (a), indicated by blue and red dashed lines, respectively. (d) Scatter plot of monocular and binocular SF tuning widths are shown. Triangles in red, blue, green and magenta indicate the neurons shown in figure 6a,b,c,d, respectively. (e) The distributions of monocular and binocular SF tuning width are shown. The averages of bandwidth were 1.57 ± 0.06 octaves for the monocular SF tuning curve and 1.26 ± 0.07 for the binocular SF tuning curve. Binocular SF bandwidths were significantly narrower than monocular SF bandwidths (Wilcoxon's signed-rank test, p < 0.01).
We were somewhat surprised at the existence of neurons with the binocular SF bandwidths as low as 0.6 octaves even though their monocular bandwidths were close to the average 1.3 as noted above [28]. These results suggest a possibility that pooling may play an important role in generating a tight requirement for binocular matching of left and right SFs.
(d). Pooling over the (Y, OR) subspace
An approach analogous to the above can be used to estimate the extent of pooling over the (Y, OR) subspace using binocular OR stimulus (figure 2d).
(i). Binocular orientation interaction
Binocular OR interactions were analysed using reverse correlation in the stimulus parameter space (ORL, ORR, phL, phR) (figure 10). Descriptions of experimental methods, data analyses and presentation of the results for binocular OR interactions are analogous to those for binocular SF interactions presented above in §3c.
Figure 10.
Reverse correlation analysis was performed to obtain a binocular OR interaction map and a binocular interaction map. (a) Using spike data recorded while static sinewave grating stimuli were presented dichoptically in rapid flashes, a pair of spike-triggered stimuli was selected for an optimal correlation time delay. OR and phase parameters in the left and right eyes were extracted for the selected grating pair. (b) Spike-triggered average in a joint left–right OR domain. A spike was voted in a four-dimensional domain (ORL, ORR, phL, phR). The procedure may be understood in the following steps. First, a spike-triggered pair of ORs (ORL, ORR) was determined (left, pink; right, cyan). The selected pair is indicated by a grey square. (c) Then, within the selected joint phase subdomain (phL, phR), the spike was voted into a particular phase combination for the stimulus pair. By repeating this procedure for all recorded spikes, complete binocular phase selectivity maps were obtained for various OR pairs between the two eyes.
Figure 11a presents the data from the representative complex cell (the same unit presented in figures 4 and 6a) in the format described in figure 10b,c. Each small map depicts responses to combinations of phases for one OR pair, and maps are arranged as a matrix of 11 × 11 binocular OR pairs. One of the maps marked with a red border (having the maximum amplitude in phase tuning) is magnified in figure 11b and shows a representative response of a complex cell to left–right phase combinations. The clear band of response along the 45° diagonals indicates that this cell has selectivity to a particular IOPD for this pair of (ORL, ORR). Figure 11c shows the IOPD tuning curve for this pair of (ORL, ORR). In figure 11d, such tuning curves are shown for all (ORL, ORR) combinations as a matrix similar to figure 11a in its arrangement. Note that, similar to SF interactions (figure 4), tuning curve has a strong modulation only for relatively matched OR pairs between the two eyes, and such modulation cannot be observed if difference of OR between the two eyes is large. It should be noted that a large difference in preferred OR between the eyes (figure 11a) is likely to be due to cyclorotation (cyclointorsion) of the eyes resulting from paralysis and anaesthesia. Typically, there was a difference of 10–20°. Such a potential effect of paralysis was noted in previous studies [8,19,24].
Figure 11.
A set of responses is shown for the representative complex cell (same as that in figure 4) to stimuli containing various combinations of phases and ORs. (a) The entire data are response strengths in a four-dimensional parameter space (ORL, ORR, phL, phR), and presented here as multiple cross-sections (phL, phR) at each (ORL, ORR) for clarity. Each small map presents selectivity to binocular phases (phL, phR), illustrating responses to various combinations of left and right phases. These small maps are arranged as an 11 × 11 matrix of left and right ORs (ORL, ORR). Colour scale shows the number of spikes collected for each pair of (phL, phR). One of the phase selectivity maps is marked with a red border and is magnified in (b). (b) Selectivity to binocular phase combination for the highlighted OR pair in (a) is shown. Strong responses are observed along a 45° diagonal where the IOPD was constant. (c) One-dimensional tuning curve to IOPD was calculated from a binocular phase selectivity map shown in (b) by integrating responses to the same interocular phase difference between the two eyes. A sinusoid was fitted to the tuning curve to determine the modulation amplitude and phase (green dashed line). (d) Tuning curves to IOPD are represented for all binocular combinations of ORs. The highlighted OR pair shown in (c) is indicated with a red border.
(ii). Spatial binocular interactions for the Y-dimension
To examine the spatial aspect of binocular interactions, we also performed reverse correlation analysis in the stimulus image space (YL, YR). Here, YL and YR are defined as the axes parallel to the optimal OR for left and right eyes, respectively. Reverse correlation was performed on the same data as in figure 10 except that the actual stimulus image patterns were used rather than parameters such as OR and phases (figure 12a). In this process, spike-triggered one-dimensional sinewaves that passed through the stimulus centres were multiplied between the two eyes to produce binocular interaction terms (figure 12b). By summing the terms for all spikes, a binocular interaction map was obtained in the joint left–right space domain (YL, YR) (figure 12c). In this joint, left–right space domain (YL, YR), binocular disparity along preferred OR is constant along the +45° diagonal, whereas it changes along the −45° diagonal. The analysis for (YL, YR) is exactly complementary to that for (XL, XR) described in §3b(ii). Details of the derivation for (YL, YR) are given in the electronic supplementary material, appendix.
Figure 12.
Reverse correlation analysis in the joint left–right Y domain was performed using the identical spike train and set of stimuli to obtain a bRF for a given neuron. (a) Using a spike train recorded while binocular sinewave grating stimuli were presented, spike-triggered stimulus pairs were selected for an optimal correlation time delay. (b) Binocular interaction terms were calculated from each pair of spike-triggered gratings as follows. The YL- and YR-axes are defined as the axis parallel to preferred OR in the left and right eyes, respectively. The one-dimensional spike-triggered sinusoids that passed through the stimulus centres (broken pink and cyan lines in (a)) were multiplied to produce binocular interaction terms in the joint YL–YR domain. Positive values (red) mean that stimuli with the same contrast polarity were presented between the two eyes, whereas negative values (blue) mean those with the opposite polarity were presented between the two eyes. (c) A binocular interaction map was obtained by summing these interaction terms for all spike-triggered stimulus pairs. Binocular disparity along preferred OR is constant along the +45° diagonal in the map, whereas disparity changes along the −45° diagonal.
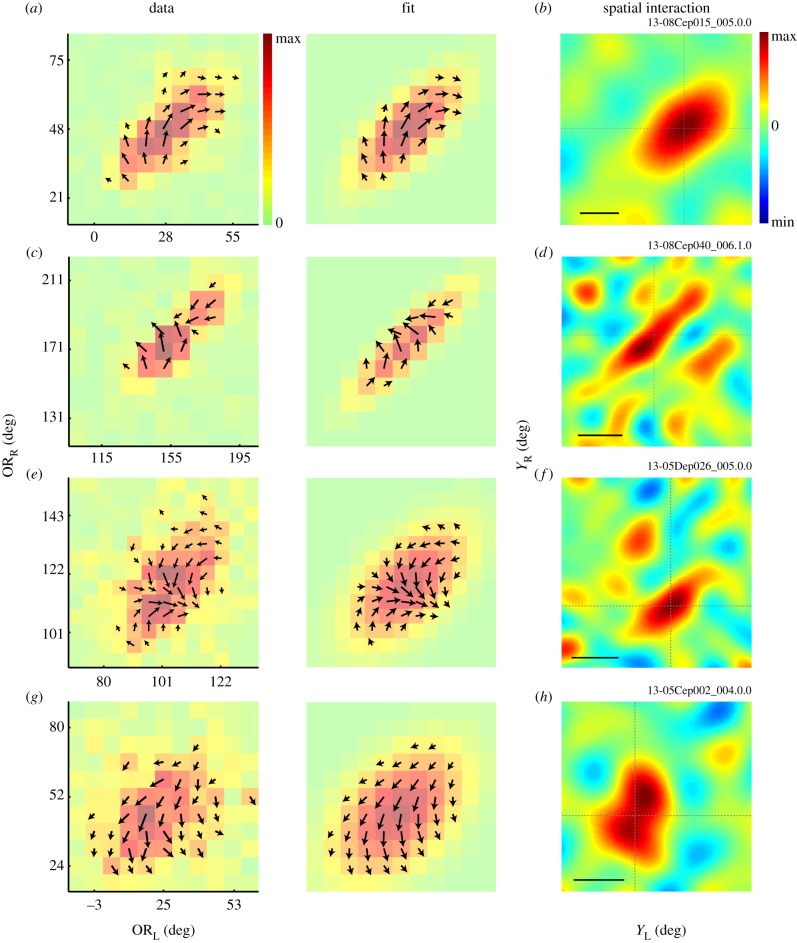
Taken together, we are able to obtain the binocular interaction data in both joint OR and joint Y domains. For the binocular OR domain, modulation amplitudes and phase were extracted from each IOPD tuning curve. These values are presented for four representative complex cells as a combination of a heat map and a vector field (figure 13, left column). The first two cells (figure 13a,c) are the same cells as presented in figure 6a,c. Unfortunately, cells in figure 13e,g are different cells from those in figure 6 due to smaller number of cells with OR interaction data. Colour of each pixel in a heat map and arrow length represent the degree of modulation at each (ORL, ORR) combination. The arrow direction represents the phase. The raw data (figure 13, left column) are fit by the pooling model incorporating both the amplitude (heat map) and phase (vector field) information. The results of the fit are depicted in figure 13 (middle column). Again, the (ORL, ORR) maps in figure 13, left column are substantially elongated along the 45° diagonal indicating that neurons were selective to stimuli that had matched ORs between the two eyes.
Figure 13.
The binocular OR interaction maps and the corresponding binocular interaction maps are shown for four complex cells from three animals. The neurons for a and c are from the same animal and are the same neurons depicted in figure 6a and c, respectively. These maps show the results of the analysis outlined in figure 2e and f, respectively. The left column shows binocular OR interaction maps (ORL–ORR) obtained by performing reverse correlation in the stimulus parameter space and extracting modulation amplitudes and phases from IOPD tuning curves for all binocular OR combinations (figure 11d). Colour of each square and arrow length represent the modulation amplitude. The arrow direction represents the phase. The middle column presents the results of model fit to the data. Both the amplitude and the phase information in the raw data are used in the fitting procedure. The right column shows the corresponding binocular spatial interaction maps (YL–YR) obtained by a reverse correlation analysis in the joint left–right space domain. Scale bars, 2°. Animal-cell ID is depicted above the top-right corner of spatial interaction maps for each cell. The first six characters represent the animal ID.
Figure 13b,d,f,h shows the spatial binocular interaction maps for the four neurons. In all these examples, there is a strip of positive interaction along the 45° diagonal, suggesting that the neurons are tuned for binocular disparity along preferred OR and its preferred disparity is constant for a relatively large range of Y-positions. Binocular OR interaction experiments were conducted on a total of eight complex cells, of which five had significant elongations of regions of responses in (ORL, ORR) maps.
(e). Predictions of binocular responses in (Y, OR) subspaces
As we have seen so far, analyses of binocular disparity of a representative complex cell in stimulus parameter space (figure 2e) and stimulus image space (figure 2f) exhibit substantial elongation of maps along the 45° diagonal. The complex cells were sensitive to the interocular phase difference only for highly matched OR pairs (figure 13, left column). These neurons also showed a spatial binocular interaction map elongated along the 45° diagonal (figure 13b). It appears that, to achieve the substantial elongations we observe, the neuron may collect inputs from subunits over the (Y, OR) subspaces, since a single disparity energy subunit shows circular, non-oriented interaction maps in both domains [19]. Therefore, we introduce a model for this part as follows.
(i). (Y, OR) pooling model
To estimate the contributions from space and OR pooling, we analysed a pooling model that was created by linearly collecting the responses of binocular energy subunits distributed over the (Y, OR) subspace. Again, this analysis is analogous to that for the (X, SF) subspace. Details of the model are provided in the electronic supplementary material, appendix as well as its assumptions and derivations of equations.
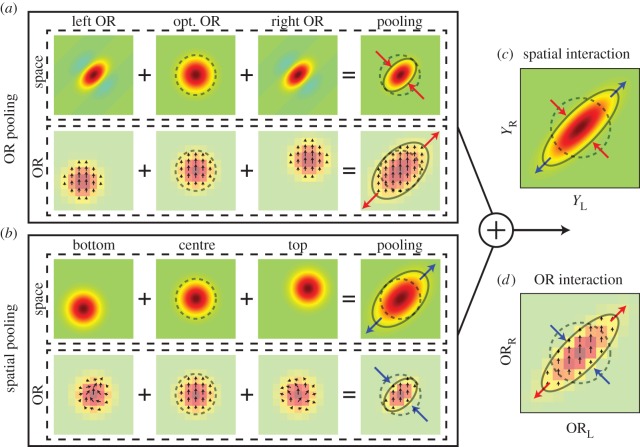
Figure 14 depicts the results of a model prediction that incorporates pooling in both the Y and OR domains. Effects of OR and space pooling are computed separately first, as illustrated in figure 14a and b, respectively. Then, these predictions are combined to arrive at the final result. In figure 14a, subunits are distributed over the OR domain. Since each subunit has a different preferred OR, peak locations are different in the binocular OR interaction maps (bottom row). The variation of the preferred OR is also reflected in the spatial binocular interaction maps (top row). The subunit tuned to the optimal OR possesses a circular (YL–YR) map. However, subunits tuned to slightly different ORs exhibit elongated (YL–YR) maps (left OR and right OR spatial maps in figure 14a). Not only are these maps elongated, these profiles are actually two-dimensional Gabor functions with negative lobes running parallel to the diagonal (notice the faint bluish side bands). These negative lobes cancel part of excitatory contributions from the opt. OR subunit. This is an effect that results from the mismatch of RF OR with respect to the OR of the coordinate system that defines YL and YR. When responses of these subunits are combined, the left–right OR interaction map (ORL–ORR) becomes elongated (outward pair of red arrows). But, at the same time, it reduces the extent of spatial (YL–YR) binocular interaction map along the −45° diagonal (inward pair of red arrows) by cancelling the side-band responses.
Figure 14.
Effects of simultaneous OR pooling and spatial pooling are predicted by a model. (a) OR pooling causes an elongation of a left–right OR interaction map (ORL–ORR) by extending its extent along the 45° axis (bottom; outward pair of red arrows). But it also reduces the extent of spatial (YL–YR) binocular interaction map along the −45° axis (top; inward pair of red arrows). Each column of left, opt. and right OR shows a binocular interaction map (top row) and its binocular OR interaction map (bottom row) for a binocular energy unit with left, optimal and right OR, respectively. Other parameters for each model are identical across subunits. Arrows in the OR interaction maps indicate the phase of IOPD tuning (figure 13, left). Since subunits are located at the same position, the phase is unchanged. (b) Conversely to (a), spatial pooling extends the spatial binocular interaction map (YL–YR) along the 45° axis (top; outward pair of blue arrows). But it also reduces the extent of left–right OR interaction map (ORL–ORR) by cancelling responses at upper left and lower right areas of the map along (bottom; inward pair of blue arrows). The model pools subunits densely at many spatial positions, but for clarity is shown with three subunits: bottom, centre and upper. Note that arrows indicate phases of tuning curves like those in figure 11d. Some arrows in the OR interaction maps show complex patterns of rotation. These phase variations are the basis of response cancellation. (c) When OR pooling and spatial pooling are present simultaneously, effects from both on the spatial binocular interaction map (YL–YR) add up, causing further elongation (outward blue arrows and inward red arrows). (d) Binocular OR map (ORL–ORR) is shown. This map is also extended further by the constructive addition of effects from simultaneous OR and space pooling (outward red arrows and inward blue arrows).
Conversely to OR pooling, spatial pooling along the Y-dimension affects these maps in an opposite manner (figure 14b). Here, subunits are distributed over the space domain as indicated by progressive shift of (YL–YR) profiles (upper row). Although the position shift does not change the strength (modulation amplitudes) of binocular OR interactions or its position in the joint OR domain, it shifts the phase of the IOPD tuning curve as indicated by opposite rotation of arrows for the unit located at top and bottom positions (bottom row). The amount of shift is proportional to both the difference of OR between the two eyes and the amount of offset between stimulus and RF. Note therefore that phase shifts of IOPD tuning curves are absent if the left and right ORs are matched. As a result, by pooling the subunits distributed over space domain, it extends the spatial binocular interaction map (YL–YR) along the 45° diagonal (top row; outward pair of blue arrows). But it also reduces the extent of the left–right OR interaction map (ORL–ORR) by cancelling responses at upper left and lower right areas of the map (bottom row; inward pair of blue arrows) due to the opposite phase shifts in IOPD tuning curves.
Because the number of cells is small for the (Y, OR) domain, it is not possible to conduct analyses similar to those in figures 8 and 9 for SF.
(f). Potential interactions between (X, SF) and (Y, OR) subspaces
We have analysed potential interactions between pooling over the (X, SF) and over the (Y, OR) subspaces. The interactions between these domains were very weak and essentially negligible (not shown). It is likely that the weak interactions are due to approximate orthogonality of these dimensions. For example, X and Y are orthogonal by definition. SF and OR dimensions are also approximately orthogonal in a small localized region, although SF and OR are two components of the polar representation of the two-dimensional Fourier space.
(g). Effects of pooling on binocular matching
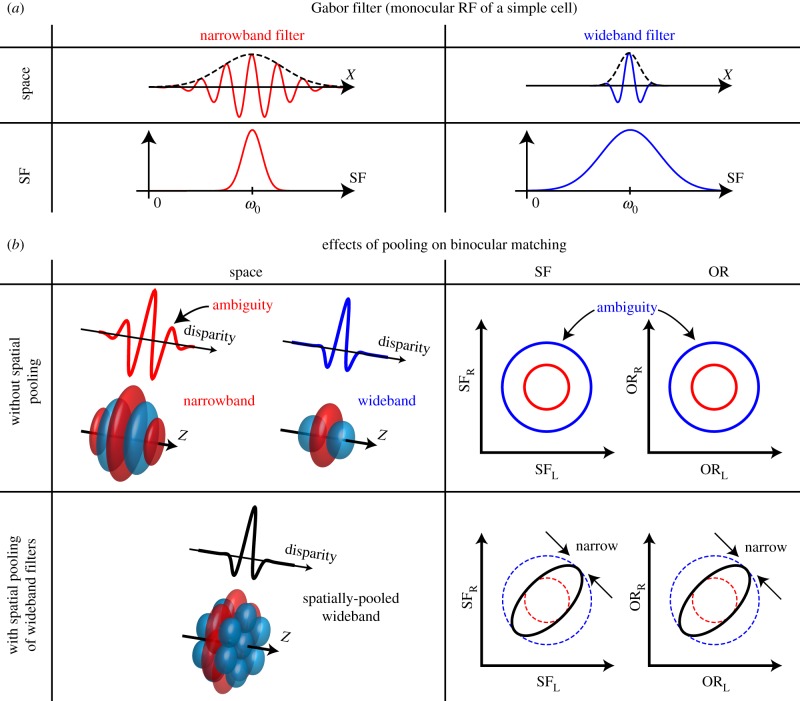
The summary of the effect of spatial pooling on the binocular SF and OR selectivity is shown in figure 15. In general, there is an uncertainty relationship between the space domain and the Fourier domain for the linear filtering (figure 15a) [29]. A narrowband filter has a large spatial extent, and consequently multiple on and off subregions are required for a narrowband simple cell RF.
Figure 15.
One of the key findings is summarized regarding the dissociation of bandwidth of monocular linear filter stage and bandwidths for binocular matching, where spatial pooling effectively overcomes the uncertainty relationship between the resolution in the space domain and the SF/OR domain. (a) Each monocular RF of a simple cell is generally modelled by a Gabor filter, where the extent of the RF envelope is inversely proportional to the SF bandwidth. That is, narrowband SF tuning requires multiple cycles of on/off subregions in the RF (left), and vice versa. (b) Top, in the absence of spatial pooling, binocular tuning properties are determined essentially by the filtering properties of the linear simple cell stage. This consequently increases ambiguity in signalled binocular disparity (red curve and 3D bRF). A wideband filter can avoid this ambiguity (blue curve and 3D bRF), but its selectivities to SF and OR are inevitably broad and ambiguous (right, blue circles). Bottom, spatial pooling of wideband units maintains the sharp selectivity to binocular disparity (left). At the same time, this pooling reduces the responses to pairs of stimuli with binocularly unmatched parameters in both the SF and OR domains (right). Hence, narrowband binocular matching in the frequency domain is achieved through spatial pooling without sacrificing accuracy in the space domain. We expect that this narrowband matching is important for the robust binocular disparity detection.
A binocular disparity energy unit built upon such narrowband simple cells will suffer from ambiguous binocular matches or ‘false matches’ due to the oscillatory disparity tuning curves (figure 15b, top left). On the other hand, a wideband filter generally has a sharp single-peaked binocular disparity tuning by sacrificing the acuity in the SF/OR domains (larger blue circles in figure 15b, top right). We found the pooling of binocular energy units overcomes the tradeoff (figure 15b, bottom row). Collecting multiple wideband disparity detectors with identical parameters over space sharpens the binocular SF/OR selectivity without sacrificing the sharp binocular disparity selectivity. Figure 15b only illustrates the effects of spatial pooling on the frequency-domain binocular matching. Note that there are complementary effects of pooling in the SF and OR domains on the disparity tuning as depicted by inward arrows in figure 7a and figure 14a, respectively. That is, the pooling in the frequency domain makes the disparity tuning narrower by attenuating its sidebands.
Taken together, by using pooling in addition to filters, it is possible to achieve accurate binocular matching in both the space domain and the frequency domain, which was thought to be unattainable previously due to the uncertainty relationship.
4. Discussion
In this study, we investigated the pooling over four-dimensional V1 parameter space. The pooling was partitioned into (X, SF) and (Y, OR) subspaces. The degree of pooling over the (X, SF) subspace was simultaneously estimated by recording neural responses to various combinations of left–right SFs, (SFL, SFR), and phases (phL, phR) for sinewave grating stimuli presented dichoptically. The extent of modulation depth and the phase of the IOPD tuning curves revealed that the binocular SF tunings tended to be narrower than the monocular SF tunings (figure 9). Since the binocular energy model predicts that these two tuning curves are identical, neurons that showed narrower binocular SF tuning seemed to integrate multiple SF channels [21]. Examining the responses in the stimulus image space revealed that the corresponding binocular receptive fields were also elongated so that spatial pooling also seemed to take place. To quantify the relationship between SF pooling and spatial pooling, we first made a pooling model in the (X, SF) subspace. The model indicates that both spatial pooling and SF pooling contribute to refine selectivity to binocular disparity in a constructive manner (figure 7). Applying an analogous approach to the (Y, OR) subspace also revealed the relationship between spatial pooling and OR pooling. Some neurons showed narrower binocular OR bandwidth than monocular OR bandwidth, indicating pooling took place in the OR and/or Y space.
(a). Binocular spatial frequency selectivity
An elongated binocular SF interaction map was reported as evidence for the integration of multiple frequency channels [21]. However, we found that pooling the responses of binocular energy units over space also elongates the binocular SF interaction map diagonally, not by actually adding to the length but by reducing the width (cf. figure 7a,b). To separate the contributions of the SF and space pooling to the elongation of the map, we analysed our data through the pooling model. As the scatter plot in figure 8b shows, the degree of space pooling tended to be larger than that of SF pooling, although both components are present for many neurons.
Note that, owing to the assumption of constant SF bandwidths (1.3 octaves) of subunits, there are ambiguities in the exact positions of points in figure 8b in dividing the elongation into spatial and SF pooling components. The ambiguity will move the data points while constrained to a hyperbolic curve for the corresponding EI (figure 8b). Such ambiguities are unavoidable as long as one attempts such a division without actually recording from the subunits simultaneously. Despite the ambiguity, we believe the results are still informative, since without the contributions of both the spatial and SF domain pooling, (XL, XR) maps of some neurons are unusually elongated and narrow in the near–far dimension (e.g. figure 6a).
Also note that the generalized pooling model we employed in this study inherits the characteristics of the disparity energy model with no extensions, other than that multiple of those which are pooled in the V1 parameter space. This means that it inherits various known discrepancies of model predictions with experimental data. For example, Prince et al. [30] and others [16,31] show discrepancies in monocular SF tuning and the disparity frequency (the frequency at which disparity tuning is modulated). There have been various extensions to the disparity energy model. However, our model in its current form does not include these extensions [14–17,32]. Instead our focus was first to determine the degree of pooling in various domains (space, SF, OR) and to construct a simple quantitative model that accurately describes how the pooling affects the disparity tuning bandwidth in these domains. Owing to limitations with space and experimental protocols, analyses that include other types of extensions and explanations of discrepancies require additional studies.
(b). Potential problem with eye stability
There is a possibility of eye drifts causing false appearance of elongation of binocular interaction maps. There are number of reasons which make such a possibility unlikely. We have analysed the data for the cell shown in figures 13a and 6a by dividing the run into the first and second halves, and the two maps from data taken about 20 min apart were nearly identical. Although it is impossible to guarantee the eye stability for all of the data, we have confidence in the general stability of eye positions during our recordings, because phase tunings such as those in figures 4 and 11 will be destroyed by eye movements. For complex cells, if the two eyes drift in a yoked manner, the phase tuning is maintained, but the stability of maps for simple cells such as fig. 4E of Baba et al. [21] is proof that eyes were stable during the recording for those cells.
(c). Existence of neurons tuned to relative orientation disparity
Selectivity to the binocular OR disparity, tuning for a given interocular OR difference independent of absolute monocular ORs (within a range), has been investigated [17,33,34]. Our data support the idea that some neurons have suitable selectivities to extract the binocular OR disparity (figure 13). However, Bridge & Cumming [17] concluded that the apparent selectivity for OR disparity was just an artifactual consequence of the positional disparity selectivity. Sources for the apparent difference in the results cannot be determined conclusively. One factor may be different choices for the response metric. We employed the modulation depth in responses to variations of disparity (interocular phase), whereas Bridge & Cumming [17] used firing rates, which included monocular responses in addition to binocular interactions. It may simply due to the more complete nature of our data obtained for all left–right combinations of phases and ORs.
Looking back, we had incorrectly assumed that tuning to a relative OR disparity would be generated solely by excitatory convergence of multiple binocular neurons tuned to slightly different absolute ORs. Our results show that, to our surprise, essentially the same tuning (but narrower) may be obtained by simply pooling the output of many neurons tuned to the same OR over space. Interaction profiles in the joint left–right OR domain can be elongated, not by adding excitations along the diagonal, but by suppressing or cancelling responses of a single channel for unmatched ORs. Note, however, that this does not exclude the possibility of excitatory convergence from multiple neurons. Unfortunately, our sample size in this part of the experiments does not allow determination of the relative contribution of spatial and OR domain pooling in generating tuning to relative OR disparity.
(d). Relationship to spatial pooling investigated through binocular two-dot interactions
The spatial pooling of binocular disparity detectors for V1 complex cells has been reported previously by Sasaki et al. [19]. In their study, disparity-selective neurons were examined with binocular two-component interaction analysis. Since some complex cells showed a narrower extent of the binocular spatial interaction than that expected from the size of receptive fields, they concluded that the complex cells collect multiple disparity detectors in space. Note that their conclusion also rests upon the elongation of interaction maps in the (XL–XR) and (YL–YR) domains. However, given the results from this study, it is possible in principle to generate elongated binocular interactions in the (XL–XR) and (YL–YR) domains based on pooling not in the space domain, but rather in the SF and OR domains, respectively, as shown in figures 7 and 14. As both spatial and frequency-domain factors have a functionally equivalent effect as far as the aspect ratio of elongation is concerned, we cannot determine the exact extent of pooling directly from an input–output relationship. However, since spatial pooling was generally more extensive than SF pooling (figure 8b), it is likely that basic findings of our previous work are correct [19].
(e). Excitation and suppression in disparity-tuned responses
Inhibitory subunits have been identified functionally through spike-triggered covariance analysis and forward correlation analysis by Tanabe and co-workers [14,32]. They also found that excitatory and inhibitory elements are organized in a push–pull organization so that the organization helps suppress responses to false matches in binocular images. It is tempting to suggest that our finding that sharpening of the joint left–right SF and OR domains (which seems to remove responses for binocularly unmatched SF and OR) may be related to the suppression reported in previous studies [14,32]. However, note that it is possible to explain our results strictly on the basis of an excitation-only model, based on simple pooling of binocular disparity energy units which, by definition, only adds positive input without any subtractions, as illustrated in figures 7 and 14. Optimal phases of interocular phase tunings of pooled subunits become unaligned when left and right SFs of the stimuli are unmatched, thereby reducing modulation of the pooled tuning curve.
Note that we are in no way excluding the possibility of the existence of suppression. In particular, our analysis methods can potentially miss suppressive influences (for that matter excitatory ones as well), since any input not reflected in the modulation amplitude of phase tuning curves will drop out of further analyses as outlined in figure 4. These include any influences of monocular origin and input that are not disparity tuned. In this sense, it is possible that further analyses of these neurons may reveal suppression.
(f). Pooling in actual neurons and artificial neural nets
There is a recent surge of interest in deep-learning neural nets (NNs), and especially convolutional NNs, in which the basic structure is an alternation of filtering and pooling layers [35–37]. Beause pooling is a keyword of this study and there are already attempts in comparing artificial and actual neural nets (e.g. [37]), we believe it is appropriate to discuss relationships between the two.
Although there are structural similarities between convolutional NNs and the hierarchy of processing in the visual pathways of actual animals, there are clear differences between the two. These differences may not be fixed or permanent, and the current choices of the configuration on the part of the artificial NN may change.
First, in the actual visual system, pooling appears to take place over the four-dimensional V1 parameter space as we have shown above. In most artificial NNs, especially in convolutional NNs, pooling is constrained to collecting from the outputs of filters of the same shape. Convergence of input across filters of different shapes takes place only in constructing filters of the next layer but not at the pooling stage.
Second, we modelled pooling as linear summation of half-squared output of filters [10,31], and connection strengths from these filters were weighted according to a Gaussian function in the four-dimensional space. The choice of Gaussian for space, SF and OR domains (equations C.0.1 and D.0.1, respectively, in the electronic supplementary material, appendix) should be appropriate considering the nature of biological connections; for example, complex cell subunit contributions evaluated via two-dot interactions [38]. On the other hand, in the majority of artificial NNs, connection strengths from multiple filters are based on MAX (winner-take-all) operation. In MAX pooling, the output of the neuron that is most active is used and signals from the others are discarded. In this context, there have been studies in which V1 complex cells were studied regarding the nature of pooling, i.e. whether the pooling is based on summation or MAX operation [39,40]. However, these studies examined neural responses to single and combined stimuli only, and not directly the properties of connections from simple cells to complex cells. Therefore, we believe the question to be still open.
In addition, some artificial NNs use soft-MAX pooling, which is a summation after an accelerating nonlinearity (such as a power law). This is actually quite similar to the model we used, since linear summation after squaring is a form of soft-MAX.
In summary, at this stage of the development of artificial NN, it is not surprising that there are differences, because the performance of artificial NNs have been tuned to tasks and performance targets different from those of actual animals. Regardless of whether they will eventually converge, it is important to be aware of these differences at this time.
(g). What features are matched binocularly for stereopsis?
Previous studies on neural mechanisms of binocular vision defined the key problem of stereopsis as accurately finding the positional shifts of corresponding object features between left and right images. As a concluding summary of this study, we wish to question this traditional notion and wonder whether the choice of the key problem has really been appropriate. Although the visual cortex is clearly retinotopically organized, accurate position information of objects in the visual world cannot be recovered completely from receptive field positions of neurons alone. That is like attempting to recover the original image only from the output of monocular V1 complex cells, which lack the phase information. Phase information is critical in representing accurate positions of edges and lines [41,42]. Indeed, there is really no neuron that explicitly represents the accurate position information. That is because the information is represented in V1, not only in the position domain, but also in terms of SF and OR, i.e. in the frequency domain where the phase information plays an inherently important role. Looking back, some of the early attempts at proposing the phase versus position encoding in binocular neurons were driven by lines of thinking [10,24,31,43,44] such that somehow the frequency-domain representation based on phase information must play a role in accurate stereoscopic performance.
For the reasons noted above, we examined the nature of pooling in the multi-dimensional V1 parameter space (X, Y, SF, OR) in a generalized manner. To our surprise, the unexpected key finding of this study is that pooling in the four-dimensional space sharpens or tightens the binocular matching requirement constructively along all dimensions. Not only does it sharpen the disparity tuning, binocular SF and OR bandwidths were also made narrower with pooling. Viewing these sharpening effects from a functional perspective, the properties of neurons appear to be refined by pooling in a highly suitable manner for achieving unambiguous binocular matches. If the phase is of such importance for vision, it makes sense to compute relative phases for SF components of the same precisely matched frequency. As illustrated in figure 15, this is achieved by pooling without sacrificing the spatial matching performance.
Supplementary Material
Acknowledgements
We thank laboratory members T. Nakazono, M. Inagaki, H. Tanaka, Y. Asada, T. Arai, S. Nishimoto, T. M. Sanada, T. Ninomiya and M. Fukui for help in experiments and discussions. We also thank Drs Ichiro Fujita, Shigeru Kitazawa, Hiroshi Tamura, and Bruce Cumming for valuable comments and suggestions.
Ethics
All animal care and experimental procedures conformed to the standards established by the National Institutes of Health and were approved by the Osaka University Animal Care and Use Committee.
Authors' contributions
D.K., M.B., K.S.S. and I.O. designed research; D.K., M.B. and K.S.S. performed experiments; D.K. and M.B. analysed data; D.K., M.B., K.S.S. and I.O. wrote the paper. All authors reviewed the manuscript.
Competing interests
The authors declare no competing interests.
Funding
This work was supported by Grant-in-Aid for Scientific Research on Innovative Areas ‘Shitsukan’ (22135006 and 15H05921) to I.O. from the Ministry of Education, Culture, Sports, Science and Technology. Support was also provided by KAKENHI 24700325 to K.S.S. from the Japan Society for the Promotion of Science.
References
- 1.Julesz B. 1960. Binocular depth perception of computer-generated patterns. Bell Syst. Tech. J. 39, 1125–1162. ( 10.1002/j.1538-7305.1960.tb03954.x) [DOI] [Google Scholar]
- 2.Wheatstone C. 1838. Contributions to the physiology of vision. Part the first. On some remarkable, and hitherto unobserved, phenomena of binocular vision. Phil. Trans. R. Soc. Lond. 128, 371–394. ( 10.1098/rstl.1838.0019) [DOI] [Google Scholar]
- 3.Hubel DH, Wiesel TN. 1959. Receptive fields of single neurones in the cat's striate cortex. J. Physiol. 148, 574–591. ( 10.1113/jphysiol.1959.sp006308) [DOI] [PMC free article] [PubMed] [Google Scholar]
- 4.Hubel DH, Wiesel TN. 1962. Receptive fields, binocular interaction and functional architecture in the cat's visual cortex. J. Physiol. 160, 106–154. ( 10.1113/jphysiol.1962.sp006837) [DOI] [PMC free article] [PubMed] [Google Scholar]
- 5.Barlow HB, Blakemore C, Pettigrew JD. 1967. The neural mechanism of binocular depth discrimination. J. Physiol. 193, 327–342. ( 10.1113/jphysiol.1967.sp008360) [DOI] [PMC free article] [PubMed] [Google Scholar]
- 6.Pettigrew JD, Nikara T, Bishop PO. 1968. Responses to moving slits by single units in cat striate cortex. Exp. Brain Res. 6, 373–390. ( 10.1007/BF00233185) [DOI] [PubMed] [Google Scholar]
- 7.Poggio GF, Fischer B. 1977. Binocular interaction and depth sensitivity in striate and prestriate cortex of behaving rhesus monkey. J. Neurophysiol. 40, 1392–1405. [DOI] [PubMed] [Google Scholar]
- 8.Ohzawa I, Freeman RD. 1986. The binocular organization of simple cells in the cat's visual cortex. J. Neurophysiol. 56, 221–242. [DOI] [PubMed] [Google Scholar]
- 9.Ohzawa I, Freeman RD. 1986. The binocular organization of complex cells in the cat's visual cortex. J. Neurophysiol. 56, 243–259. [DOI] [PubMed] [Google Scholar]
- 10.Ohzawa I, DeAngelis GC, Freeman RD. 1990. Stereoscopic depth discrimination in the visual cortex: neurons ideally suited as disparity detectors. Science 249, 1037–1041. ( 10.1126/science.2396096) [DOI] [PubMed] [Google Scholar]
- 11.Cumming BG, Parker AJ. 1997. Responses of primary visual cortical neurons to binocular disparity without depth perception. Nature 389, 280–283. ( 10.1038/38487) [DOI] [PubMed] [Google Scholar]
- 12.Anzai A, Ohzawa I, Freeman RD. 1999. Neural mechanisms for processing binocular information I. Simple cells. J. Neurophysiol. 82, 891–908. [DOI] [PubMed] [Google Scholar]
- 13.Anzai A, Ohzawa I, Freeman RD. 1999. Neural mechanisms for processing binocular information II. Complex cells. J. Neurophysiol. 82, 909–924. [DOI] [PubMed] [Google Scholar]
- 14.Tanabe S, Haefner RM, Cumming BG. 2011. Suppressive mechanisms in monkey V1 help to solve the stereo correspondence problem. J. Neurosci. 31, 8295–8305. ( 10.1523/JNEUROSCI.5000-10.2011) [DOI] [PMC free article] [PubMed] [Google Scholar]
- 15.Read JCA, Parker AJ, Cumming BG. 2002. A simple model accounts for the response of disparity-tuned V1 neurons to anticorrelated images. Vis. Neurosci. 19, 735–753. ( 10.1017/S0952523802196052) [DOI] [PubMed] [Google Scholar]
- 16.Read JCA, Cumming BG. 2003. Testing quantitative models of binocular disparity selectivity in primary visual cortex. J. Neurophysiol. 90, 2795–2817. ( 10.1152/jn.01110.2002) [DOI] [PMC free article] [PubMed] [Google Scholar]
- 17.Bridge H, Cumming BG. 2001. Responses of macaque V1 neurons to binocular orientation differences. J. Neurosci. 21, 7293–7302. [DOI] [PMC free article] [PubMed] [Google Scholar]
- 18.Sanada TM, Ohzawa I. 2006. Encoding of three-dimensional surface slant in cat visual areas 17 and 18. J. Neurophysiol. 95, 2768–2786. ( 10.1152/jn.00955.2005) [DOI] [PubMed] [Google Scholar]
- 19.Sasaki KS, Tabuchi Y, Ohzawa I. 2010. Complex cells in the cat striate cortex have multiple disparity detectors in the three-dimensional binocular receptive fields. J. Neurosci. 30, 13 826–13 837. ( 10.1523/JNEUROSCI.1135-10.2010) [DOI] [PMC free article] [PubMed] [Google Scholar]
- 20.Bridge H, Cumming BG, Parker AJ. 2001. Modeling V1 neuronal responses to orientation disparity. Vis. Neurosci. 18, 879–891. [PubMed] [Google Scholar]
- 21.Baba M, Sasaki KS, Ohzawa I. 2015. Integration of multiple spatial frequency channels in disparity-sensitive neurons in the primary visual cortex. J. Neurosci. 35, 10 025–10 038. ( 10.1523/JNEUROSCI.0790-15.2015) [DOI] [PMC free article] [PubMed] [Google Scholar]
- 22.Fleet DJ, Wagner H, Heeger DJ. 1996. Neural encoding of binocular disparity: energy models, position shifts and phase shifts. Vis. Res. 36, 1839–1857. ( 10.1016/0042-6989(95)00313-4) [DOI] [PubMed] [Google Scholar]
- 23.Qian N, Zhu Y. 1997. Physiological computation of binocular disparity. Vis. Res. 37, 1811–1827. ( 10.1016/S0042-6989(96)00331-8) [DOI] [PubMed] [Google Scholar]
- 24.Ohzawa I, DeAngelis GC, Freeman RD. 1996. Encoding of binocular disparity by simple cells in the cat's visual cortex. J. Neurophysiol. 75, 1779–1805. [DOI] [PubMed] [Google Scholar]
- 25.Ringach DL, Sapiro G, Shapley R. 1997. A subspace reverse-correlation technique for the study of visual neurons. Vis. Res. 37, 2455–2464. ( 10.1016/S0042-6989(96)00247-7) [DOI] [PubMed] [Google Scholar]
- 26.Nishimoto S, Arai M, Ohzawa I. 2005. Accuracy of subspace mapping of spatiotemporal frequency domain visual receptive fields. J. Neurophysiol. 93, 3524–3536. ( 10.1152/jn.01169.2004) [DOI] [PubMed] [Google Scholar]
- 27.Skottun BC, Valois RL, Grosof DH, Movshon JA, Albrecht DG, Bonds AB. 1991. Classifying simple and complex cells on the basis of response modulation. Vis. Res. 31, 1078–1086. ( 10.1016/0042-6989(91)90033-2) [DOI] [PubMed] [Google Scholar]
- 28.Movshon JA, Thompson ID, Tolhurst DJ. 1978. Spatial and temporal contrast sensitivity of neurones in areas 17 and 18 of the cat's visual cortex. J. Physiol. 283, 101–120. ( 10.1113/jphysiol.1978.sp012490) [DOI] [PMC free article] [PubMed] [Google Scholar]
- 29.Daugman J. 1985. Uncertainty relation for resolution in space, spatial frequency, and orientation optimized by two-dimensional visual cortical filters. J. Opt. Soc. Am. A 2, 1160–1169. ( 10.1364/JOSAA.2.001160) [DOI] [PubMed] [Google Scholar]
- 30.Prince SJD, Pointon AD, Cumming BG, Parker AJ. 2002. Quantitative analysis of the responses of V1 neurons to horizontal disparity in dynamic random-dot stereograms. J. Neurophysiol. 87, 191–208. [DOI] [PubMed] [Google Scholar]
- 31.Ohzawa I, DeAngelis GC, Freeman RD. 1997. Encoding of binocular disparity by complex cells in the cat's visual cortex. J. Neurophysiol. 77, 2879–2909. [DOI] [PubMed] [Google Scholar]
- 32.Tanabe S, Cumming BG. 2014. Delayed suppression shapes disparity selective responses in monkey V1. J. Neurophysiol. 111, 1759–1769. ( 10.1152/jn.00426.2013) [DOI] [PMC free article] [PubMed] [Google Scholar]
- 33.Blakemore C, Fiorentini A, Maffei L. 1972. A second neural mechanism of binocular depth discrimination. J. Physiol. 226, 725–749. ( 10.1113/jphysiol.1972.sp010006) [DOI] [PMC free article] [PubMed] [Google Scholar]
- 34.Nelson JI, Kato H, Bishop PO. 1977. Discrimination of orientation and position disparities by binocularly activated neurons in cat straite cortex. J. Neurophysiol. 40, 260–283. [DOI] [PubMed] [Google Scholar]
- 35.Fukushima K. 1980. Neocognitron: a self organizing neural network model for a mechanism of pattern recognition unaffected by shift in position. Biol. Cybern. 36, 193–202. ( 10.1007/BF00344251) [DOI] [PubMed] [Google Scholar]
- 36.Huang FJ, LeCun Y.2006. Large-scale learning with SVM and convolutional for generic object categorization. In 2006 IEEE Computer Society Conf. on Computer Vision and Pattern Recognition ( CVPR’06 ), vol. 1, pp. 284–291. ( ) [DOI]
- 37.Yamins DLK, Hong H, Cadieu CF, Solomon EA, Seibert D, DiCarlo JJ. 2014. Performance-optimized hierarchical models predict neural responses in higher visual cortex. Proc. Natl Acad. Sci. USA 111, 8619–8624. ( 10.1073/pnas.1403112111) [DOI] [PMC free article] [PubMed] [Google Scholar]
- 38.Sasaki KS, Ohzawa I. 2007. Internal spatial organization of receptive fields of complex cells in the early visual cortex. J. Neurophysiol. 98, 1194–1212. ( 10.1152/jn.00429.2007) [DOI] [PubMed] [Google Scholar]
- 39.Lampl I, Ferster D, Poggio T, Riesenhuber M. 2004. Intracellular measurements of spatial integration and the MAX operation in complex cells of the cat primary visual cortex. J. Neurophysiol. 92, 2704–2713. ( 10.1152/jn.00060.2004) [DOI] [PubMed] [Google Scholar]
- 40.Finn IM, Ferster D. 2007. Computational diversity in complex cells of cat primary visual cortex. J. Neurosci. 27, 9638–9648. ( 10.1523/JNEUROSCI.2119-07.2007) [DOI] [PMC free article] [PubMed] [Google Scholar]
- 41.Oppenheim AV, Lim JS. 1981. The importance of phase in signals. Proc. IEEE 69, 529–541. ( 10.1109/PROC.1981.12022) [DOI] [Google Scholar]
- 42.Lee TS. 1996. Image representation using 2D Gabor wavelets. IEEE Trans. Pattern Anal. Mach. Intell. 18, 959–971. ( 10.1109/34.541406) [DOI] [Google Scholar]
- 43.Freeman RD, Ohzawa I. 1990. On the neurophysiological organization of binocular vision. Vis. Res. 30, 1661–1676. ( 10.1016/0042-6989(90)90151-A) [DOI] [PubMed] [Google Scholar]
- 44.DeAngelis GC, Ohzawa I, Freeman RD. 1991. Depth is encoded in the visual cortex by a specialized receptive field structure. Nature 352, 156–159. ( 10.1038/352156a0) [DOI] [PubMed] [Google Scholar]
Associated Data
This section collects any data citations, data availability statements, or supplementary materials included in this article.


