

Abstract
Background:
Predicting the trend in traffic accidents deaths and its analysis can be a useful tool for planning and policy-making, conducting interventions appropriate with death trend, and taking the necessary actions required for controlling and preventing future occurrences.
Objective:
Predicting and analyzing the trend of traffic accidents deaths in Iran in 2014 and 2015.
Settings and Design:
It was a cross-sectional study.
Materials and Methods:
All the information related to fatal traffic accidents available in the database of Iran Legal Medicine Organization from 2004 to the end of 2013 were used to determine the change points (multi-variable time series analysis). Using autoregressive integrated moving average (ARIMA) model, traffic accidents death rates were predicted for 2014 and 2015, and a comparison was made between this rate and the predicted value in order to determine the efficiency of the model.
Results:
From the results, the actual death rate in 2014 was almost similar to that recorded for this year, while in 2015 there was a decrease compared with the previous year (2014) for all the months. A maximum value of 41% was also predicted for the months of January and February, 2015.
Conclusion:
From the prediction and analysis of the death trends, proper application and continuous use of the intervention conducted in the previous years for road safety improvement, motor vehicle safety improvement, particularly training and culture-fostering interventions, as well as approval and execution of deterrent regulations for changing the organizational behaviors, can significantly decrease the loss caused by traffic accidents.
Keywords: Interventions, rate of death, time series, traffic accidents
INTRODUCTION
The increasing trends in traffic accidents deaths, in particularly the low- and middle-income countries, poses great threat to the wellbeing and existence of mankind in such areas.[1,2] Presently, traffic accident is considered the most life threatening throughout the world.[3] Majority of deaths, disabilities, hospitalizations and reduction in nations' economy are associated with losses and damages caused by traffic accidents.[4] Most traffic accidents in the low- and middle-income countries are due to one or more of the following reasons: Rapid increase in the number of motor vehicles, increased exposure to risky factors such as speed and alcohol consumption, insufficient regulations for road safety, and inefficient public health structure.[5] A number of studies on the factors responsible for traffic accident deaths have been conducted in Iran and other parts of the world. These studies were conducted using the fields such as human behavior, road safety, vehicle safety, and traffic management, all of which necessitated the revision and preparation of regulation and rules, as well as their full implementation.[6,7] One way to reduce these traffic accidents is to investigate the trend of the resultant deaths and the effect of the different interventions. In 2012, Bahadori et al., proposed a model to predict traffic accident death in Iran between 2004 and 2010 by using the Box Jenkins multi-variable time series models. A prediction was made of traffic accidents deaths which occurred between 2011 and 2012 and this was compared with the statistical data for the first 9 months of 2011. In 2011 and 2012, there were predicted negative growth rates of 7.32 and 5.31%, respectively with a 93% accuracy.[8] In a study by Ersi et al., death trend of motor vehicle collisions in Europe from 1980 to 2007 was investigated, with the sole purpose of comparing the results with those of similar studies in the USA and Japan. Their results showed a decreased trend in Europe from 20.2 per 100000 persons in 1987 to 13.5 per 100000 persons in 2007 for men and from 6.3 to 3.7 for women, indicating the necessity in implementing quick and coherent measures to further reduce this number, particularly in the southern and eastern countries in this continent.[9]
One of the models used to determine these trends is the time series model which is attributed to a change-point analysis, which scientifically compares the trends observed prior to a specific time period with that of a similar time period, and provides the graphical and quantitative demonstration for any significant changes. In a study which focused on the approximate time of reduction in traffic accidents among young drivers in New Zealand, this model was able to show such time and identify the parameters effective for this issue.[10] Generally, plans with the purpose of studying the trend of a health-related event, such as death, have the following applications: 1- Observing the results of efforts made to reduce or mitigate the considered event; 2- Effectively directing the actions toward controlling the occurrence of the considered event; 3- Providing a recommendation for modifying the accurate traffic accident monitoring system.[11] Traffic accidents deaths in Iran have followed a decreasing trend during the last years, and 20,408 deaths per year were reported in a study by Ainy et al.[12] Therefore, these deaths are one of the major areas of focus and concern for the Iranian government and health system.[13,14]
In this study, traffic accidents deaths were predicted and analyzed to provide a useful planning and policy-making tool for authorities in the field of road traffic, conduct interventions appropriate with death trends, and take the measures required for future control.
MATERIALS AND METHODS
In a cross-sectional study, all the information related to the traffic accidents deaths available in the database of Iran Legal Medicine Organization from 2004 to the end of year 2013 was used to determine the change points (multi-variable time series analysis). To moderate the effect of the intervening factors of the monthly number of deaths caused by car crashes from 2004 to the end of year 2013, change-point analysis was used to study the existing variations in this time series, while synchronicity of these changes was accommodated with the enforcement of new regulations. The role of the rules and regulations in the variations of these deaths was examined using Box Jenkins multi-variable time series models and CPA analysis over time. In this study, based on Box Jenkins prediction model, and in addition to trend, seasonal and stochastic variations were taken into consideration, and non-stationary factor was eliminated to identify the appropriate ARIMA model in order to evaluate the parameters, analyze the residuals, and finally predict the model.[10] Using ARIMA model, it was possible to predict death rates between 2014 and 2015, and a comparison was made between the actual death rate and the predicted death rate in order to ascertain the efficiency of the model. All statistical analysis were carried out using SAS and Stata 12 software packages, with a P < 0.05 considered as being significant.
Findings
Table 1 indicated that years 2006 and 2014 accounted for the highest and lowest death rates, respectively [Table 1].
Table 1.
Rate of death incidence caused by the traffic accidents in Iran, per 100000 persons and 10000 vehicles during 2001 to 2014
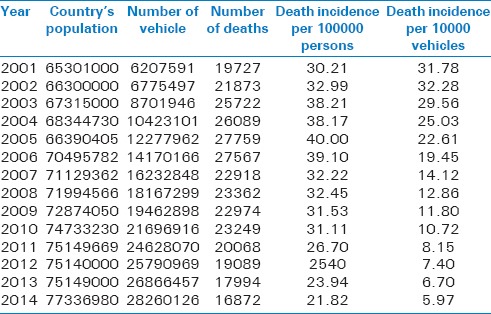
Figure 1 illustrated an annual change compared with the previous year. Based on the results, the highest percent variation occurred in 2008 and 2012, respectively, compared to 2007 and 2011 [Figure 1].
Figure 1.

Percent variation of death rate caused by the traffic accidents during 2004-2013, per 10000 vehicles
Figure 2 illustrated a time series for the death rate in Iran (per 10000 vehicles) in terms of month and year [Figure 2].
Figure 2.

The death trend of traffic accidents during a 14-year period (per 10000 vehicles)
This time series was seasonal and non-stationary, in which the variation pattern was repeated once with each observation. This repetition was evidence of its seasonality. Conversely, there was an average decrease over time of the value of this series. An increase in the particular months of the year with the maximum number of travels (months of summer) was also clearly observed, indicating that the time series was also a non-stationary one. Differencing (1st and 12th order) was used to convert the series into a stationary series (eliminating the non-stationary factor). Based on the data obtained from the auto-regression and partial auto-regression curves, order of the moving average process and auto-regression was assumed to be equal to one and that of the moving average process and seasonal auto-regression was also considered equal to one. Some of the parameters of ARIMA model were approximated and the model was made to fit the different values of the parameters. Also, its acceptable performance was examined by studying the residual values. If the model was not appropriate, the parameters would be changed to fit other models; finally, the models were compared using AIC and SBC criteria to select the appropriate model. A comparison of the models fitted to the logarithm of the death rate caused by the traffic accidents in Iran (per 10000 vehicles) is shown in [Table 2].
Table 2.
Comparing the models fitted to the logarithm of death rate caused by the traffic accidents in Iran (per 10000 vehicles)
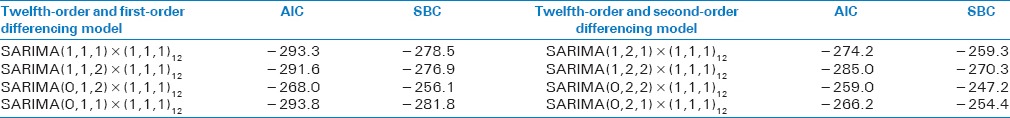
From the table, the minimum value of AIC was -293.8, implying that model is the most appropriate model for fitting the series.
Table 3 shows the results for the selected model [Table 3].
Table 3.
Result of model
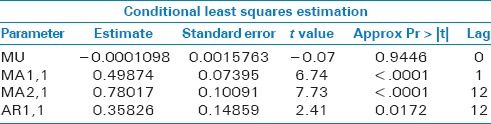
By investigating the auto-regression of the residuals of the fitted model, it was discovered that the residuals were not correlated at any of the time intervals. Finally, using the determined model, the death rate (per 10000 vehicles) for 2014 and 2015 was predicted and a comparison of this predicted rate for 2014 was made with the actual rate the same year [Figure 3].
Figure 3.
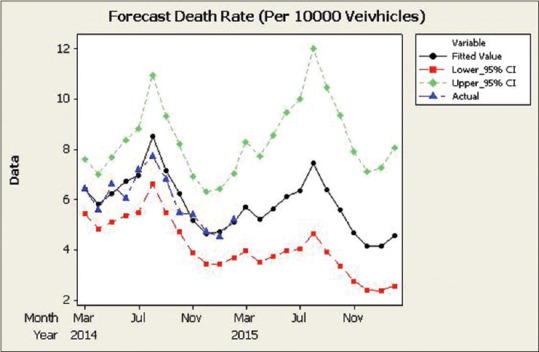
Predicting the logarithm of rate of deaths caused by traffic accidents (per 10000 vehicles) at 95% confidence interval
Findings showed that the death rate in 2014 was almost similar to the actual rate recorded for the same year, while in 2015 this rate decreased in all the months of the year compared with the previous year (2014). A maximum rate of 4.1% in the entire year was recorded in the months of January and February, 2015. Tables 4 and 5 demonstrate the predicted values of the rate of deaths caused by the traffic accident in 2014 and 2015 [Tables 4 and 5].
Table 4.
Predicted values of rate of death caused by traffic accidents in Iran (per 10000 vehicles) at 95% confidence interval in 2014
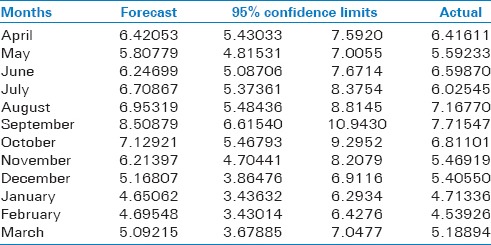
Table 5.
Predicted values of rate of death caused by traffic accidents in Iran (per 10000 vehicles) at 95% confidence interval in 2015

DISCUSSION
The results showed that the death rate in 2014 was almost similar with its actual rate recorded in the same year, and this rate decreased in all the months of 2015 compared with the previous year (2014). Also, it was predicted that the rate would reach a maximum of 4.1% in January and February, 2015.
One of the models for determining the trend in the field of effect of regulations is the time series model attributed to the change point analysis, which scientifically compares the trends observed prior to a specific time period with that of a similar time period and provides a graphical and quantitative demonstration for any significant change.
Results of the analysis of this time series model related to the study conducted in Iran also showed a decrease from 38 deaths in 2004 to 31 deaths in 2010, per 100000 persons. Also, the number of deaths based on the index related to the number of vehicles decreased from 38 deaths in 2004 to 12 deaths in 2010.[8] In a study conducted to predict the approximate date of reduction in the traffic accidents among young drivers in New Zealand, the model was able to demonstrate this time series and identify the effective variables on this transition.[10]
During 1966 to 2010, the government of The United States of America took some measures such as establishment of National Traffic and Safety Organization, application of regulation for factories manufacturing motor vehicles to install safety equipment and belts, approval and implementation of regulations related to speed limits, approval and implementation of regulations related to the use of safety belt and child seat, increased standards for the safety of vehicles, approval and implementation of regulations related to the use of safety helmet, and strict application of regulations for individuals below the age of 21 and drivers with the record of alcoholic consumption to curb traffic accidents, and this reduced the rate of damage and loss caused by traffic accidents by 9.7%.[15,16,17,18,19]
In the same approach and for the same reason, during 1988 to 2010, the UK government also carried out a series of actions including revision of road safety regulations, installing speed limit cameras, and executing a national program for safety cameras in order to reduce the number of deaths in the traffic accidents from 5200 to 1900 deaths per year.[20,21]
According to the data collected from Iran Legal Medicine Organization, the number of death occurrences resulting from road accidents in 2001 was equal to 19727, and this was maximum in 2005, with a total number of 27,759 deaths. A maximum number was recorded between 2001 and 2014, with a total of 16872 in 2014. From the data, it was deduced that there was significant decrease of 47% in death in 2014 compared to 2005.
This is indicative that by continuing this trend and conducting other interventions in other fields such as forbidding the use of cell phones while driving, using child restraint, and increasing the road and vehicle safety standards in Iran, the deaths caused by traffic accidents can be significantly reduced. Based on the proposed model, it can be concluded that death rate from traffic accidents in Iran would decrease in 2015 if this trend continues.
CONCLUSION
From the obtained results, the use of ARIMA model in predicting traffic accidents deaths can be a useful and appropriate approach for providing good and efficient preventive measures against future occurrences. Also, the actions conducted during 2007 to 2014 regarding making new regulations were also effective, and considerably reduced the death incidences. It is recommended that some actions such as strict regulations for cell phone use and safety of backseat passengers should be taken in order to increase road and vehicle safety, and this will in turn significantly reduce the number of victims in traffic accidents.
Citation
Mehmandar MR, Soori H, Mehrabi Y. Predicting and Analyzing the Trend of Death Caused by Traffic Accidents in Iran in 2014 and 2015. Int J Crit Illn Inj Sci. 2016 Jan-Mar;6(1):1-5.
Financial support and sponsorship
Nil.
Conflicts of interest
There are no conflicts of interest.
Acknowledgement
This study was as a part of findings of Dr Mohammadreza Mehmandar PhD thesis of PhD by Research, Safety Promotion and Injury Prevention research center of Shahid Beheshti University of Medical Sciences, Tehran, Iran.
The authors would like to thank the studied samples as well as the organizations supporting the careful implementation of research.
REFERENCES
- 1.Bunn F, Collier T, Frost C, Ker K, Roberts I, Wentz R. Traffic calming for the prevention of road traffic injuries: Systematic review and meta-analysis. Inj Prev. 2003;9:200–4. doi: 10.1136/ip.9.3.200. [DOI] [PMC free article] [PubMed] [Google Scholar]
- 2.García-Altés A, Pérez K. The economic cost of road traffic crashes in an urban setting. Inj Prev. 2007;13:65–8. doi: 10.1136/ip.2006.012732. [DOI] [PMC free article] [PubMed] [Google Scholar]
- 3.Peden M, Scurfield R, Sleet D, Mohan D, Hyder A, Jarawan E, et al. World Report on Road Traffic Injury Prevention. Geneva: World Health Organization; 2004. pp. 1–22. [Google Scholar]
- 4.Cameron M. World report on road traffic injury prevention. Inj Prev. 2004;10:255–6. [Google Scholar]
- 5.Chisholm D, Naci H, Hyder AA, Tran NT, Peden M. Cost effectiveness of strategies to combat road traffic injuries in sub-Saharan Africa and South East Asia: Mathematical modelling study. BMJ. 2012;344:e612. doi: 10.1136/bmj.e612. [DOI] [PMC free article] [PubMed] [Google Scholar]
- 6.Elvik R. The safety value of guardrails and crash cushions: A meta-analysis of evidence from evaluation studies. Accid Anal Prev. 1995;27:523–49. doi: 10.1016/0001-4575(95)00003-i. [DOI] [PubMed] [Google Scholar]
- 7.Robertson LS. Reducing death on the road: The effects of minimum safety standards, publicized crash tests, seat belts, and alcohol. Am J Public Health. 1996;86:31–4. doi: 10.2105/ajph.86.1.31. [DOI] [PMC free article] [PubMed] [Google Scholar]
- 8.Bahadorimonfared A, Soori H, Mehrabi Y, Delpisheh A, Esmaili A, Salehi M, et al. Trends of fatal road traffic injuries in Iran (2004-2011) PloS One. 2013;8:e65198. doi: 10.1371/journal.pone.0065198. [DOI] [PMC free article] [PubMed] [Google Scholar]
- 9.Orsi C, Bertuccio P, Morandi A, Levi F, Bosetti C, La Vecchia C. Trends in motor vehicle crash mortality in Europe, 1980-2007. Saf Sci. 2012;50:1009–18. [Google Scholar]
- 10.Tay R. Fatal crashes involving young male drivers: A continuous time poisson change-point analysis. Aust N Z J Public Health. 2001;25:21–3. doi: 10.1111/j.1467-842x.2001.tb00544.x. [DOI] [PubMed] [Google Scholar]
- 11.Wu WY, Chen SP. A prediction method using the grey model GMC (1, n) combined with the grey relational analysis: A case study on Internet access population forecast. Appl Math Comput. 2005;169(1):198–217. [Google Scholar]
- 12.Ainy E, Soori H, Ganjali M, Le H, Baghfalaki T. Estimating cost of road traffic injuries in Iran using willingness to pay (WTP) method. PLoS One. 2014 Dec 1;9(12):e112721. doi: 10.1371/journal.pone.0112721. [DOI] [PMC free article] [PubMed] [Google Scholar]
- 13.Montazeri A. Road-traffic-related mortality in Iran: A descriptive study. Public Health. 2004;118:110–3. doi: 10.1016/S0033-3506(03)00173-2. [DOI] [PubMed] [Google Scholar]
- 14.Ellen J, David B, John C, Gregory J, Anthony R, Sandra D, Harry Teter. National Inventory of Hospital Trauma Centers. JAMA. 2003;289(12):1515–22. doi: 10.1001/jama.289.12.1515. [DOI] [PubMed] [Google Scholar]
- 15.Pruitt C. People doing what they do best: The professional engineers and NHTSA. Public Adm Rev. 1979;39:363–71. [Google Scholar]
- 16.Kratzke SR. Regulatory history of automatic crash protection in FMVSS 208: SAE Technical Paper1995. Report No: 0148-7191 [Google Scholar]
- 17.McLeer SV, Anwar AR, Herman S, Maquiling K. Education is not enough: A systems failure in protecting battered women. Ann Emerg Med. 1989;18:651–3. doi: 10.1016/s0196-0644(89)80521-9. [DOI] [PubMed] [Google Scholar]
- 18.Ehrlich I, Posner RA. An economic analysis of legal rulemaking. J Legal Stud. 1974;3:257–86. [Google Scholar]
- 19.Naumann RB, Dellinger AM, Zaloshnja E, Lawrence BA, Miller TR. Incidence and total lifetime costs of motor vehicle–related fatal and nonfatal injury by road user type, United States, 2005. Traffic Inj Prev. 2010;11:353–60. doi: 10.1080/15389588.2010.486429. [DOI] [PubMed] [Google Scholar]
- 20.Nekovee M. Sensor networks on the road: The promises and challenges of vehicular ad hoc networks and vehicular grids. Proceedings of the Workshop on Ubiquitous Computing and e-Research. 2005:1–5. [Google Scholar]
- 21.Avineri E, Goodwin P. Individual Behaviour Change: Evidence in Transport and Public Health. London: Department for Transport; 2010. pp. 1–33. [Google Scholar]