Abstract
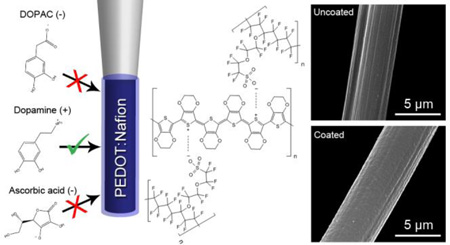
A Nafion and PEDOT-containing composite polymer has been electropolymerized on carbon-fiber microelectrodes with the goal of creating a mechanically stable, robust, and controllable electrode coating that increases the selectivity and sensitivity of in vivo electrochemical measurements. The coating is deposited on carbon-fiber microelectrodes by applying a triangle waveform from + 1.5 V to −0.8 V and back in a dilute solution of ethylenedioxythiophene (EDOT) and Nafion in acetonitrile. Scanning electron microscopy (SEM) demonstrated that the coating is uniform and ~100 nm thick. Energy-dispersive x-ray spectroscopy (EDX) demonstrated that both sulfur and fluorine are present in the coating, indicating the incorporation of PEDOT (poly(3,4-ethylenedioxythiophene) and Nafion. Two types of PEDOT:Nafion coated electrodes were then analyzed electrochemically. PEDOT:Nafion-coated electrodes made using 200 µM EDOT exhibit a 10–90 response time of 0.46 ± 0.09 seconds vs. 0.45 ± 0.11 seconds for an uncoated fiber in response to a 1.0 µM bolus of dopamine. The electrodes coated using a higher EDOT concentration (400 µM) are slower with a 10–90 response time of 0.84 ± 0.19 seconds, but display increased sensitivity to dopamine, at 46 ± 13 nA/µM, compared to 26 ± 6 nA/µM for the electrodes coated in 200 µM EDOT and 13 ± 2 nA/µM for an uncoated fiber. PEDOT:Nafion-coated electrodes were lowered into the nucleus accumbens of a rat, and both spontaneous and electrically evoked dopamine release were measured. In addition to improvements in sensitivity and selectivity, the coating dramatically reduces acute in vivo biofouling.
Graphical Abstract
Introduction
Monitoring real-time dynamics of biogenic amines in vivo is essential for understanding the role of chemical communication in cognitive function. These molecules are released at axon terminals in response to salient stimuli and diffuse through the extracellular space where they can either act on distal receptors (volume neurotransmission) or are cleared by reuptake or metabolic mechanisms. Dopamine is of particular interest because of its well-established role in reward-based behavior,1 memory,2–4 addiction,5,6 and movement.7,8 Most often, carbon-fiber microelectrodes (CFMEs) are utilized for these electrochemical measurements because of their biocompatibility, small size (5 – 10 µm in diameter), and favorable electrochemical properties. Furthermore, neurotransmission occurs on the sub-second timescale, thus for a measurement to probe transmitter dynamics, the temporal resolution of the measurement must be on the order of milliseconds. Because of this, CFMEs have been coupled to fast-scan cyclic voltammetry,9 which provides adequate temporal resolution and the shape of the resultant voltammogram can be used to analyte identification and quantification.10 However, during in vivo measurements, the presence of interferents complicates measurements warranting additional modification of the electrode surface to enhance selectivity.11
For in vivo measurements of chemical communication the presence of metabolites and antioxidants in the extracellular space can detrimentally affect accurate measurements chemical communciation.12 Specifically, a large body of work has been directed towards maximizing the selectivity of dopamine over ascorbic acid (AA) and 3,4-dihydroxyphenylacetic acid (DOPAC).13–15 These two molecules share a similar oxidation potential with dopamine, and can be present in concentrations 100-fold in excess of dopamine.16 To address this, researchers have historically relied predominantly on Nafion, which is a copolymer of polytetrafluoroethylene with perfluorovinyl ether sulfonic acid side chains.15 The sufonic acid moiety is stabilized by the electron-withdrawing character of the attached chain, and as such the pKa of the moiety is estimated at −6, leaving the functional group deprotonated within the physiological pH range.17 Presumably, a negative charge immobilized at the surface of the electrode will restrict the diffusion of anions to the electrode. Because ascorbic acid and DOPAC are both negatively charged at physiological pH, and dopamine is positively charged, a decrease of interferent signal and an increase of analyte signal is anticipated with successful coating of Nafion on the electrode. Nafion also forms cation-conducting sulfonate networks, which allow the transport of positively charged species to the electrode.18 Nafion is commonly dip-coated or electro-deposited onto electrodes prior to in vivo measurement in an attempt to minimize current measured from interferents.13–15,19 It has also been successfully used to increase selectivity of serotonin19 and adenosine measurements,20 and to reduce the shift in reference electrode potential during chronic implantation.21 Because Nafion is a fluoropolymer like PTFE (polytetrafluoroethylene), it does not strongly adhere to carbon-fiber surfaces and forms non-uniform layers,20 both of which limit the usefulness of Nafion coatings. Additionally, a reproducible, robust, and facile means for deposition on to cylindrical carbon-fiber microelectrodes has not yet been achieved.
Here, we deposit Nafion onto carbon-fiber microelectrodes by synthesizing a polyethylenedioxythiophene (PEDOT) and Nafion-containing polymer in a novel scheme on the surface of the electrode. This ensures a thin, even coating of the material, and enhances selectivity towards cations. Additionally, both PEDOT and Nafion have a well-established history in being coated onto biosensors to improve sensor function or biocompatibility.25–29 The deposition of a PEDOT:Nafion composite coating is described and characterized. The chemical space of the coating is explored and optimized, and coated electrodes are shown to yield accurate measurements of dopamine in vivo. Lastly, the coating provides a surface that mitigates biofouling and retains enhanced selectivity and sensitivity for dopamine over interferents following six hours of in vivo implantation.
Materials and Methods
Electrode fabrication
Electrodes were fabricated as previously described.30 Additional details are available in the Supporting Information.
Chemicals
Electrodes were pre-tested prior to coating deposition in an artificial cerebrospinal fluid solution (aCSF) (15 mM Tris HCl, 126 mM NaCl, 2.5 mM KCl, 20 mM Na2CO3, 1.2 mM NaH2PO4, 2.0 mM Na2SO4, 2.4 mM CaCl2, 1.2 mM MgCl2 pH = 7.40). Prior to CaCl2 and MgCl2 addition, the pH of the aCSF was adjusted to 7.40 using 0.1 N NaOH or a 0.1 N HCl solution. Electrodes were submerged in buffer and a triangle waveform from − 0.4 V to + 1.3 V was applied at 400 V/s for 1 minute; electrodes without a stable background were discarded. PEDOT:Nafion deposition solutions consisted of 100–200 µL of a stock solution of 0.04 M EDOT (Sigma Aldrich, St. Louis, MO, USA) in acetonitrile (prepared by the addition of 43 µL EDOT to 10 mL acetonitrile) and 200 µL of LQ-1105 Nafion (Ion Power Inc., DE, USA) in 20 mL acetonitrile (HPLC grade, EMD Chemicals Inc., Darmstadt, Germany). The final deposition solutions prepared from the stock solution contained either 200 µM EDOT (low-density PEDOT:Nafion coating) or 400 µM EDOT (high-density PEDOT:Nafion coating). Prior to electrodeposition, deposition solutions were mixed for 1 minute and used within 12 hours. Dopamine, ascorbic acid, DOPAC, bovine serum albumin, and all other chemicals, unless otherwise specified, were purchased from Sigma Aldrich. Neurotransmitter measurements were performed in aCSF buffer solution.
Electrochemistry
The voltage for electrodeposition was controlled using a Gamry Instruments Reference 600 potentiostat (Warminster, PA, USA) in a three-electrode configuration. A tightly coiled silver wire was used as the counter electrode, and a straight silver wire was used as the reference electrode. Both the reference and counter electrodes were polished using sandpaper and rinsed using 18.2 MΩ doubly-deionized (MilliQ) water. Deposition was performed by applying a triangle waveform from +1.5 V to −0.8 V at 100 mV/s for 15 cycles, and using an open-circuit potential prior to waveform application. Electrochemical characterization of coated and uncoated electrodes was performed via fast-scan cyclic voltammetry using the WCCV 3.0 software package, (Knowmad Technologies, LLC, Tucson, Arizona). A programmatically controlled a flow cell 6-port valve switch (VICI Valco, Houston, TX, USA) and Dagan ChemClamp potentiostat (Minneapolis, MN, USA) for background-subtracted electrochemical measurements of neurotransmitters and interferents.
Biological Experiments
Adult, male Sprague-Dawley rats (350 – 450 g; Harlan Laboratories, Harlan, Kentucky, USA) were used. All procedures were performed in accordance with the policies of the National Institutes of Health guidelines for laboratory animals under protocols approved by the University of Arizona Institutional Animal Care and Use Committee. Additional details regarding animal protocol is described in the supporting information.
Results and Discussion
Electropolymerization of EDOT with Nafion as the counterion
The polymerization of monothiophenes such as ethylenedioxythiophene (EDOT) is possible through a variety of oxidant-initiated or electrochemical processes.31–34 Commonly, iron (iii) tosylate (the monomeric homologue of polystyrenesulfonate) or iron (iii) chloride are used as oxidants for in situ polymerization.35 Solutions of EDOT and oxidant in solvent are deposited, dried, and rinsed to form a conductive polymer film. Alternatively, EDOT can be oxidatively electro-polymerized to PEDOT in the presence of a counter ion. Nafion contains sulfonate groups much like iron tosylate or polystyrenesulfonate making it a suitable counter ion. Additionally, because oxidized PEDOT is positively charged, Nafion can be incorporated into the coating as a counter ion. Given this similarity, thick PEDOT:Nafion composite films have been previously synthesized on platinum wires via a galvanostatic deposition in a 5% aqueous dispersion of Nafion with small a volume of EDOT added, though to date, no applications of this composite material have been described.36
Described here is the electro-synthesis of a surface-immobilized PEDOT:Nafion composite polymer. We have optimized solution concentrations to examine two different coating regimes, called low-density (LD) PEDOT:Nafion and high-density (HD) PEDOT:Nafion. Additonally, we employ an information-rich coating deposition method, cyclic voltammetry, which has been shown to increase the nucleation density of electropolymerized conducting polymers when compared to an amperometric deposition.37 This may lead to an increased Nafion density (and thus an increased repulsion of anionic species) at the electrode.
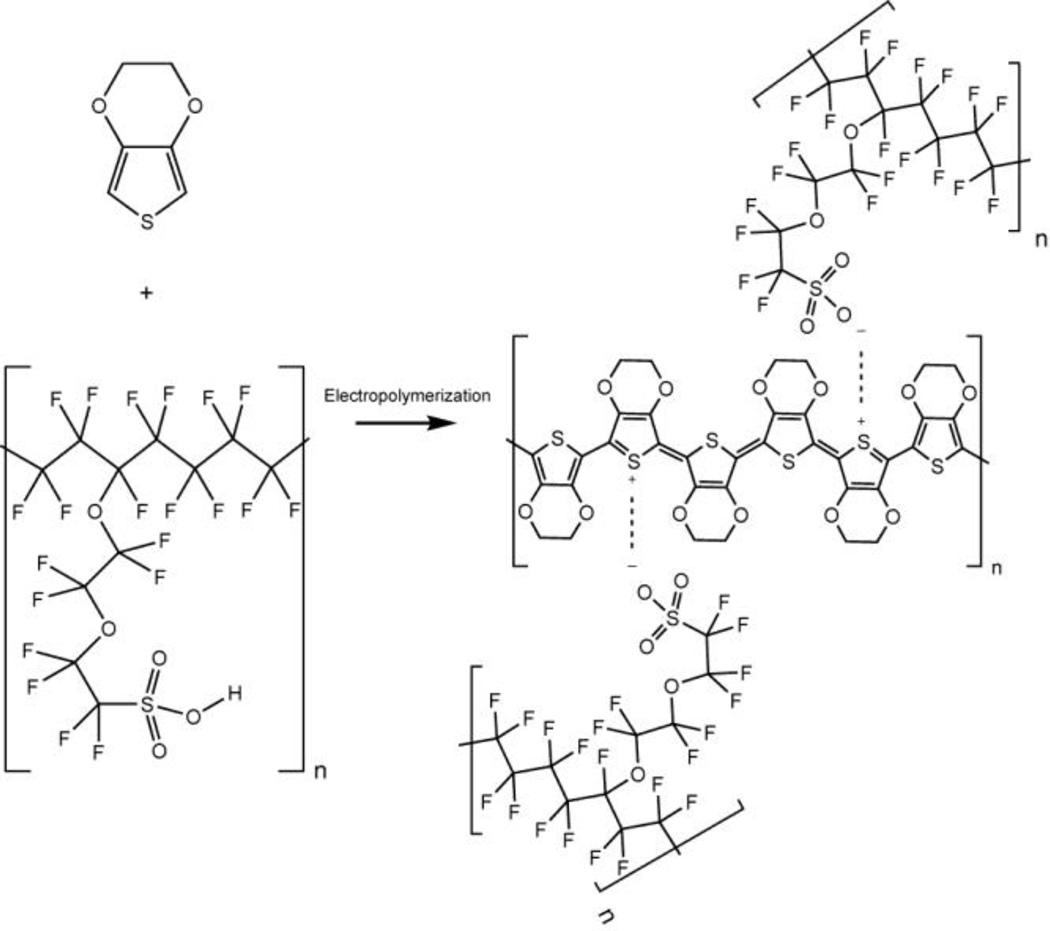
We propose that the final structure of the PEDOT has a positive charge which is coordinated by a Nafion sulfonate (Scheme 1). A positive charge every three monomer units has been proposed for PEDOT:Tosylate and given the similarity of the counter ion, it is expected that the Nafion sulfonate coordinates similarly.38 Furthermore, measurements made at other electrochemically polymerized PEDOTs with sulfonate dopants indicate that an excess of sulfonates is present in the coatings. Extending this conclusion, the PEDOT:Nafion coating is likely not charge neutral (i.e. one sulfonate to one PEDOT positive charge) but instead contains an excess of sulfonate groups relative to the positive charges on PEDOT.38 Given that a PEDOT-associated sulfonate on a Nafion chain is only one of many, this may increase the negative character of the coating, generating selectivity towards cations.
Scheme 1.
Proposed structure of PEDOT:Nafion. EDOT undergoes electropolymerization in the presence of Nafion, forming a PEDOT:Nafion composite polymer that coats the surface of a carbon-fiber microelectrode.
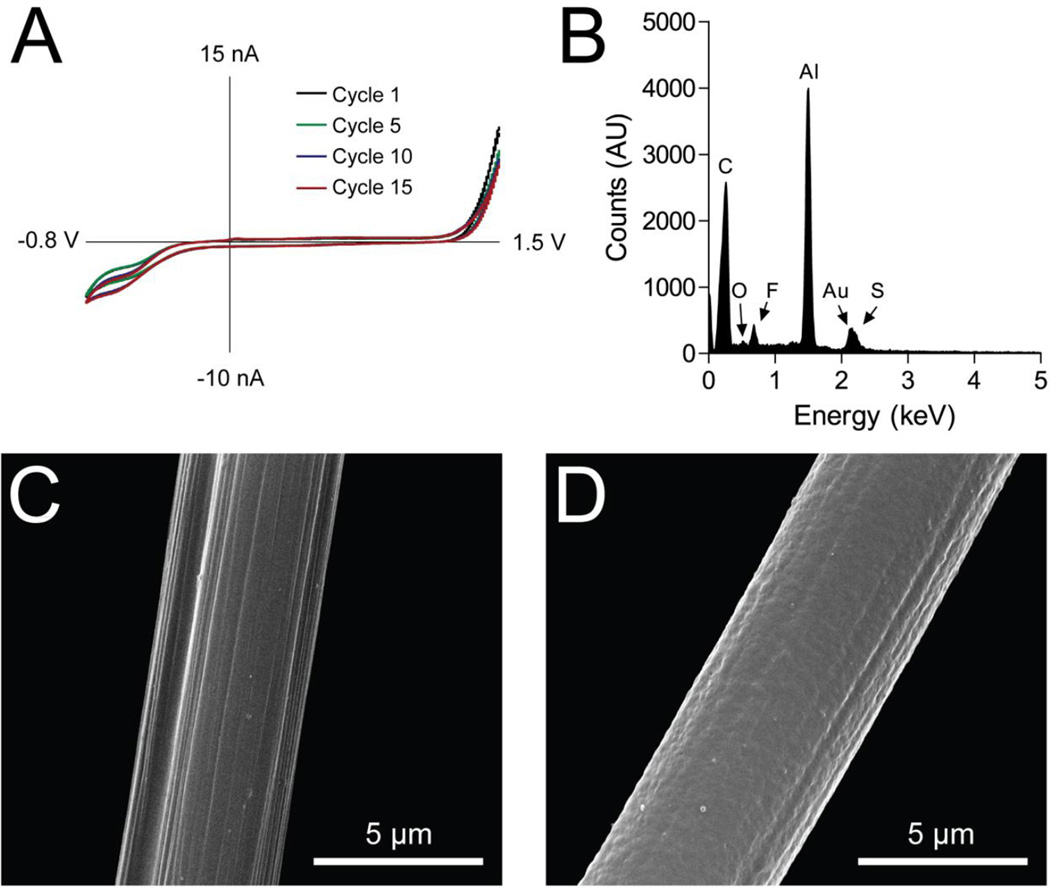
An ordinary deposition trace is shown, with cycles 1, 5, 10, and 15 highlighted in Figure 1. Three prominent characteristics of this deposition are apparent. First, an oxidation current near the anodic limit (+1.5 V) is attributed to the oxidation of EDOT that polymerized to form PEDOT. This oxidation current on the deposition voltammogram is the film-forming current, and is an indicator of coating success. Increasing the EDOT concentration results in a larger oxidative deposition current (Figure S-1). Second, a reduction wave starting near −0.6 V is apparent; we attribute this wave to the reduction of protons. The cycling of a carbon-fiber microelectrode using a deposition waveform in a solution of acetonitrile and sulfuric acid results in a similar wave shape and reduction potential (Figure S-2). Third, a small irreversible peak-shaped wave is apparent at 50 mV, and appears in most deposition traces. We attribute this peak to an irreversible oxidation of the PEDOT coating, as observed elsewhere in PEDOT electro-synthesis literature.39,40 Voltammetric deposition of EDOT without the presence of a counter ion in solution does not form a coating or generate an oxidative current (Figure S-1).
Figure 1.
Electropolymerization of EDOT with Nafion counterions on carbon-fiber microelectrodes. A) Voltammetric trace of a LD PEDOT:Nafion coating on a carbon-fiber microelectrode. Deposition cycles 1, 5, 10, and 15 are shown. B) Energy-dispersive X-ray spectroscopy of a LD PEDOT:Nafion coating on a T-40 carbon-fiber microelectrode indicating the presence of fluorine and sulfur. C) Electron micrograph of uncoated carbon-fiber microelectrode with characteristic ~100 nm striations. D) Electron micrograph of LD PEDOT:Nafion-coated T-40 carbon-fiber microelectrode.
Scanning electron microscopy was used to compare the surface morphology of uncoated (Figure 1C) and PEDOT:Nafion-coated carbon-fiber microelectrodes (Figure 1D). The unmodified carbon fiber exhibits a striated surface, with individual striations measuring between 50 and 200 nm wide. After deposition of a low-density PEDOT:Nafion coating on the electrode, a ~100 nm coating on the electrode obfuscates the striations, and imparts a smoother surface morphology. Energy-dispersive X-ray spectroscopy was utilized to measure the presence of sulfur and fluorine in the coatings. As both PEDOT and Nafion contain sulfur, while only Nafion contains fluorine, the fluorine Kα line was used to confirm the presence of Nafion in the PEDOT:Nafion coatings (Figure 1B). Indeed, the fluorine peak is present for polymer-coated electrodes, and is absent for uncoated electrodes (Figure S-2). Interestingly, given a constant Nafion concentration and an increasing EDOT concentration, the fluorine Kα peak grows with higher EDOT concentrations, indicating that the PEDOT incorporates more counterion Nafion into the coating if there is more PEDOT polymerized during the voltammetric deposition process (data not shown).
Fast-scan cyclic voltammetry at PEDOT:Nafion modified electrodes
To explore the chemical effect of EDOT concentration on coating performance, two concentrations of EDOT (and thus two coating types) were chosen for exploration in the scope of this work. The first coating type (Figure S-3, panel A) is prepared with the intent of maximizing selectivity while minimizing changes in temporal response or background current. Flow-injection analysis background-subtracted fast-scan cyclic voltammetry was used to characterize the effect of LD PEDOT:Nafion coatings on the temporal response and background current of the electrode (Table 1 and Figure S-3, panel A). An statistically significant increase in sensitivity from 13 ± 2 nA/µM for uncoated carbon fibers to 26 ± 6 nA/µM for coated carbon fibers was observed (Student’s t-test, n = 6 electrodes, P < 0.01). The 10–90 rise time of a 1.0 µM bolus of dopamine detected at the LD PEDOT:Nafion coated electrode was 0.45 ± 0.11 seconds, compared to 0.46 ± 0.09 seconds from an uncoated electrode. This difference was not statistically significant (Student’s t-test, n = 6 electrodes, P = 0.95). The background shape and current are essentially unchanged. The second coating type (Figure S-3, panel B), HD PEDOT:Nafion, is prepared with the intent of maximizing selectivity and sensitivity while maintaining a background current under the maximum current threshold of typical FSCV current amplifiers. The HD PEDOT:Nafion coating resulted in a statistically significant 4-fold increase in sensitivity with respect to the uncoated carbon-fiber electrode for dopamine (46 ± 13 nA/µM, Student’s t-test, n = 6 electrodes, P < 0.05). The background current increases nearly 3-fold, though the background shape is similar. The wave shape of a background-subtracted dopamine voltammogram is markedly different as the oxidative current is ~4 times larger while the reduction current increases only by a factor of 1.5 compared to a control electrode. Electron microscopy of HD PEDOT:Nafion-coated electrodes does not indicate an increased geometric area compared to LD PEDOT:Nafion-coated electrodes. We are currently investigating the origin of this sensitivity difference but suspect that differences in proton-transfer equilibrium between the adsorbed dopamine and adsorbed dopamine-orthoquinone could give rise to this effect. The 10–90 rise time of a 1.0 µM bolus of dopamine detected at the higher EDOT coated electrode is 0.84 ± 0.19 seconds, compared to 0.46 ± 0.09 seconds from an uncoated electrode. Clearly, a sacrifice in temporal resolution is made for a substantial increase in sensitivity. This temporal resolution may not be needed for all types of measurements, for example in equilibrium surface coverage measurements of dopamine via fast-scan controlled-adsorption voltammetry, but may be advantageous for low signal recordings, such as in vivo measurements of spontaneous phasic dopamine release, or perhaps for lower concentration transmitters.
Table 1.
Figures-of-merit for uncoated and PEDOT:Nafion electrodes acquired via flow-injection analysis with background-subtracted fast-scan cyclic voltammetry (n = 6 electrodes, ± SEM).
| Electrode Type | Rise time (s) |
DA Sensitivity (nA/µM) |
RMS Noise (pA) |
DA LOD (nM) |
|---|---|---|---|---|
| Uncoated | 0.45 ± 0.11 | 13 ± 2 | 80 ± 30 | 20 ± 7 |
| PEDOT:Nafion, 200 µM EDOT |
0.46 ± 0.09 | 26 ± 6 | 30 ± 10 | 4 ± 1 |
| PEDOT:Nafion, 400 µM EDOT |
0.84 ± 0.19 | 46 ± 13 | 100 ± 40 | 6 ± 1 |
Voltammetry of dopamine and interferences at carbon-fiber microelctrodes
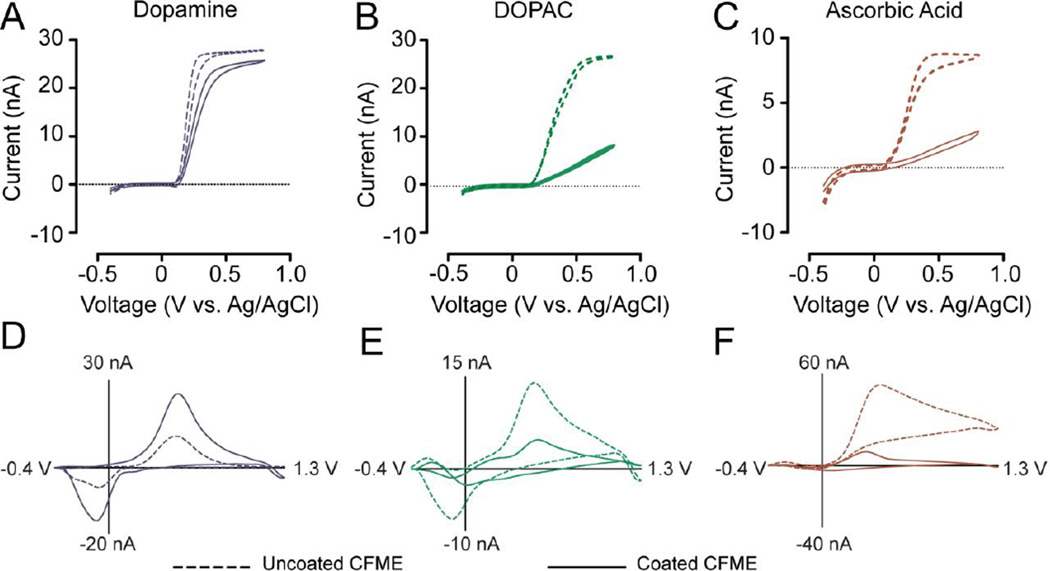
Following deposition of Nafion onto the electrode surface, it is expected that mass transfer for a cation (such as dopamine) should be faster than that of an anion (such as DOPAC or ascorbic acid). To validate that the PEDOT:Nafion coating decreased the rate of mass transfer of DOPAC and ascorbic acid, slow scan cyclic voltammetry (20 mV/s) was performed using LD PEDOT:Nafion-coated electrodes on solutions of 1.0 mM dopamine, DOPAC, and AA in 20 mM pH 7.4 phosphate buffered saline (Figure 2). The steady-state current for a 1.0 mM dopamine voltammogram is largely unchanged for the coated electrodes, meaning that the coating has a negligible effect on the rate of mass transfer for dopamine. However, a considerable decrease is apparent in both Figure 2B and 2C which correspond to DOPAC and ascorbic acid (anions at physiological pH). Fast-scan cyclic voltammograms (400V/s) show an increase in dopamine sensitivity and a decrease in sensitivity to interferents (DOPAC and AA). These signals are dependent on adsorption, and the PEDOT:Nafion coating reduces anion adsorption.
Figure 2.
Cyclic voltammetry of dopamine, DOPAC, and ascorbic acid at PEDOT:Nafion-coated electrodes. Solid line – LD PEDOT:Nafion-coated electrode, dashed line – uncoated electrode. Cyclic voltammograms collected with a scan rate of 10 mV/s for A) dopamine (1.0 mM), B) DOPAC (1.0 mM), and C) AA (1.0 mM), exhibit a decrease in the rate of mass transfer for anionic compounds, while dopamine remains comparably unchanged. Representative background-subtracted fast-scan cyclic voltammograms of D) dopamine (1.0 µM), E) DOPAC (20 µM), and F) ascorbic acid (200 µM) (L to R), show that the sensitivity for DOPAC and AA has decreased. Electrode sensitivity has increased for dopamine for PEDOT:Nafion-coated vs. uncoated electrodes.
Selectivity and limit-of-detection for PEDOT:Nafion-coated electrodes
Selectivity of PEDOT:Nafion-coated electrodes for dopamine over DOPAC and ascorbic acid was quantified by background-subtracted fast-scan cyclic voltammetry (Figure 3). Equimolar current ratios of dopamine and DOPAC or dopamine and ascorbic acid were used to calculate the selectivity of the sensor. The current used in this ratio was measured at peak potential of the oxidation wave for dopamine. Uncoated electrodes had a selectivity of 54 ± 6 for dopamine/AA and 21 ± 4 for dopamine/DOPAC. Electrodes prepared using a traditional dip-coating method19 are not statistically distinguishable from uncoated electrodes (97 ± 20 for dopamine/AA and 23 ± 7 for dopamine/DOPAC, Student’s t-test, n = 3 electrodes, P > 0.1 for both). Conversely, LD PEDOT:Nafion-coated electrodes exhibit a statistically significant increase in selectivity for DA/AA (530 ± 60, Student’s t-test, n = 15 electrodes, P < 0.001), and at HD PEDOT:Nafion-coated electrodes, the selectivity increased to 1540 ± 150, which was also statistically significant compared to uncoated carbon-fiber electrodes (Student’s t-test, n = 3 electrodes, P < 0.001). The selectivity for DA/DOPAC was increased from 21 ± 4 (uncoated) to 45 ± 6 (LD PEDOT:Nafion coating) and 52 ± 4 (HD PEDOT:Nafion coating). This difference was statistically significant when comparing uncoated to any of the PEDOT:Nafion-coated electrodes (Student’s t-test, n = 3 – 15 electrodes, P < 0.05). It is not yet understood why selectivity for DA over DOPAC plateaus.
Figure 3.
Chemical selectivity of PEDOT:Nafion-coated, Nafion dip-coated, and uncoated carbon-fiber microelectrodes for dopamine over ascorbic acid and DOPAC. Selectivity is defined as an equimolar current ratio at the peak oxidation potential of dopamine. Error bars are SEM (n = 3 – 15). Statistical significance is marked with asterisks (* P < 0.05, ** P < 0.01, *** P < 0.001), and selectivity of treated electrodes is compared to uncoated carbon-fiber microelectrodes.
Electrode noise was characterized on 15 LD PEDOT:Nafion and 3 HD PEDOT:Nafion-coated electrodes by measuring the RMS (root mean square) current noise of the electrode between 0.575 and 0.625 V vs. Ag/AgCl while scanning at 400 V/s in pH 7.4 aCSF. Resultant data was filtered as previously described.41 The RMS noise for uncoated carbon fibers was 80 ± 30 pA. LD PEDOT:Nafion-coated electrodes had a statistically significant decrease in noise to 30 ± 10 pA (Student’s t-test, n = 15 electrodes, P < 0.01), while HD PEDOT:Nafion-coated electrodes showed a statistically significant increase to 100 ± 40 pA (Student’s t-test, n = 3 electrodes, P < 0.01).
Background-subtracted fast-scan voltammetry was also used to measure limit-of-detection for dopamine at uncoated, LD PEDOT:Nafion-coated, and HD PEDOT:Nafion-coated electrodes. The limit-of-detection was calculated by measuring the RMS current noise across the oxidation potential for dopamine over a 50 mV window (vide supra, Table 1). For uncoated carbon-fiber microelectrodes, this was 20 ± 7 nM. LD PEDOT:Nafion-coated electrodes had a dopamine limit of detection of 4 ± 1 nM, while HD PEDOT:Nafion-coated electrodes had a dopamine limit of detection of 6 ± 1 nM. Both of these limits of detection for PEDOT:Nafion-coated carbon-fiber electrodes were statistically different compared to uncoated carbon-fiber electrodes (Student’s t-test, n = 6 electrodes, P < 0.05).
Evaluation of PEDOT:Nafion-coated electrodes for in vivo dopamime measurements
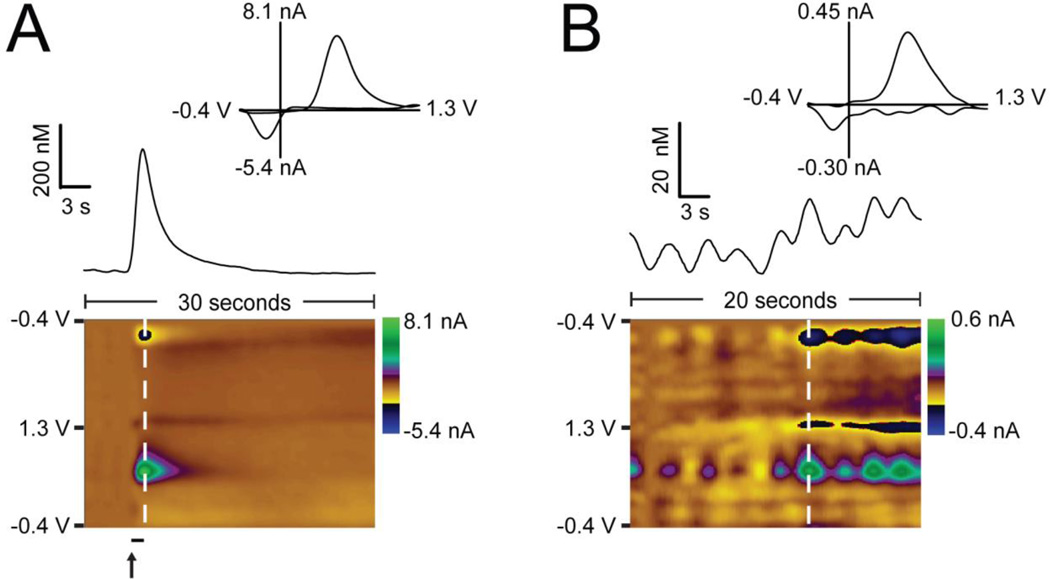
To validate the sensor's response to a typical voltammetric stimulated release experiment, a stainless steel stimulating electrode was implanted in the medial forebrain bundle and a LD PEDOT:Nafion-coated carbon-fiber microelectrode was implanted in the nucleus accumbens of an anesthetized Sprague-Dawley rat. Prior to implantation, the coated electrode was cycled from −0.4 V to +1.3 V at 400 V/s in pH 7.4 aCSF buffer for 10 minutes. Stimulated release of dopamine was measured with a concentration of approximately 300 nM (Figure 4A). A color plot recorded during stimulation shows typical stimulated release and reuptake (Figure 4A). Additionally, a current vs. time trace of the current at the oxidation wave for dopamine, and an extracted voltammogram are shown (Figure 4A, inset). To further validate the use of this sensor in vivo, physiological dopamine release was monitored in the nucleus accumbens of an anesthetized rat (Figure 4B). This is, to our knowledge, the first recording of dopamine transient release events in anesthetized animals without administration of reuptake inhibitors. Compared to recordings from anesthetized rats published elsewhere, we see more transients over a 20 second timeframe than were reported in a five-minute bin of transient recordings (1–5).42 While there are differences in anesthesia (urethane vs. isofluorane) and recording location (caudate putamen vs. nucleus accumbens) between the two recordings, we believe this arises at least in part due to the increased sensitivity of the PEDOT:Nafion-coated electrode. Several dopamine transients ranging from 5 – 200 nM are present. A representative cyclic voltammogram is taken at the white vertical dashed line and displayed in the inset.
Figure 4.
In vivo measurements of dopamine release using a PEDOT:Nafion coated carbon-fiber microelectrode. Current vs. time traces are extracted from the color plot at the peak oxidation potential for dopamine (~600 mV). Representative cyclic voltammograms are taken from the vertical white dashed line on the color plots. A) Dopamine release was electrically evoked by stimulation (black bar, 40 pulses at 60 Hz, ± 150 µA, 2 ms per phase) of the medial forebrain bundle and monitored in the nucleus accumbens of a Sprague-Dawley rat. B) Spontaneous transients recorded in the nucleus accumbens of an isufluorane-anesthetized Sprague-Dawley rat.
Investigation of PEDOT:Nafion coating on in vitro and in vivo fouling
The PEDOT:Nafion-coated sensors were characterized for their ability to resist synthetic and in vivo biofouling. In the context of these experiments, we define biofouling as the sensor's decrease in sensitivity to dopamine as measured by flow cell background-subtracted FSCV after being placed in a challenging chemical environment. To assess resistance to biofouling, we compare pre-calibration DA sensitivity with post-calibration DA sensitivity. While other important work has shown that the sensitivity of tyramine-fouled carbon fiber microelectrodes is renewed with application of the + 1.3 V waveform for 15 minutes,43 due to practical limitations electrode pre- and post-calibrations are infrequently performed by modern practitioners of in vivo voltammetry.
Fouling of the electrode in biological tissue was simulated by implanting the electrode into 40 g/L solution of bovine serum albumin (BSA) in pH 7.4 aCSF and applying the previously described detection waveform. This solution has been used elsewhere to mimic the fouling capacity of the brain environment.44,45 Uncoated and three LD PEDOT:Nafion-coated CFMEs were submerged in this solution for 2 hours. Three uncoated CFMEs were also submerged in pH 7.4 aCSF and cycled using the same waveform for 2 hours as a control for sensor degradation via application of the waveform.
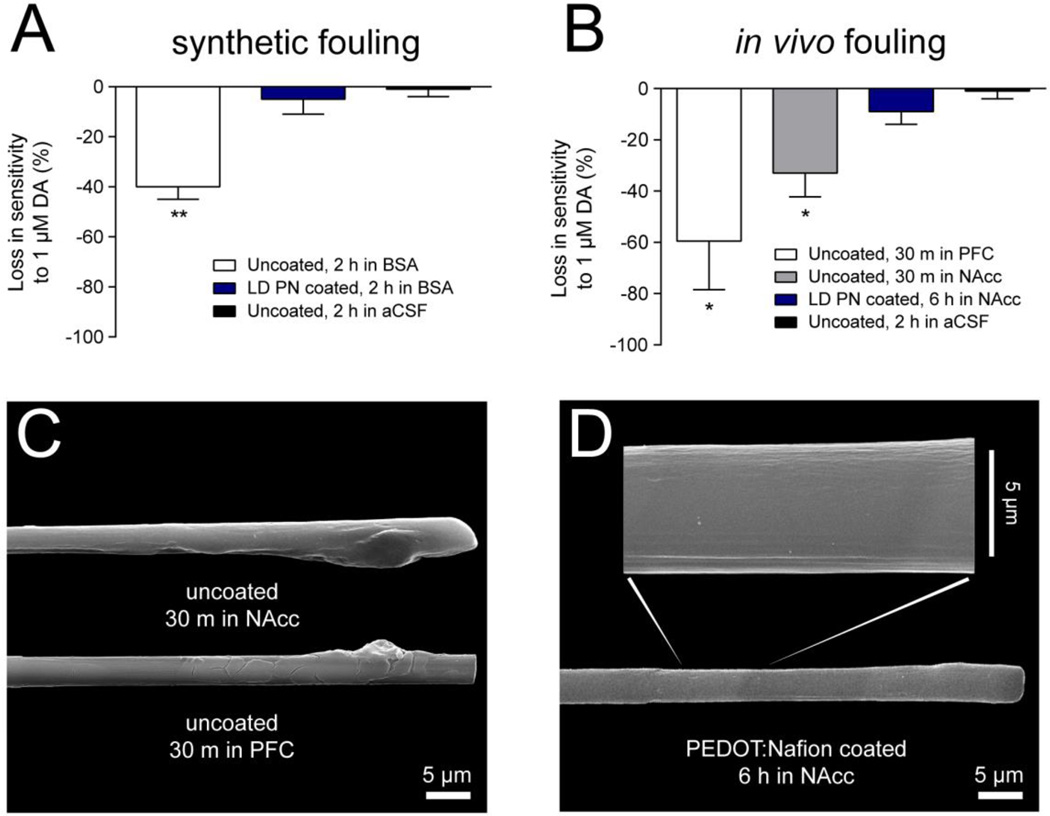
For the in vitro fouling procedure in BSA, uncoated CFMEs lost 40 ± 5 % of their sensitivity to a 1 µM bolus of dopamine (Figure 5, panel A). LD PEDOT:Nafion-coated CFMEs lost only 5 ± 6 % of their sensitivity, and electrodes cycled in pH 7.4 aCSF lose only 1 ± 3 % of their sensitivity. This sensitivity loss of approximately 40% for uncoated fibers is also reported elsewhere.45 The difference between coated and uncoated fibers is statistically significant (Student's t-test, P < 0.01, n = 3), while the difference between LD PEDOT:Nafion-coated CFMEs and control electrodes in pH 7.4 aCSF is not statistically significant (Student's t-test, P > 0.3, n = 3).
Figure 5.
PEDOT:Nafion electrodes resist A) synthetic fouling (40 g/L BSA in pH 7.4 aCSF) and B) in vivo biofouling. The dopamine detection waveform (−0.4 V to + 1.3 V) was continuously applied for the duration of synthetic and in vivo biofouling experiments. Asterisks indicate statistical significance when compared to uncoated CFMEs. Error bars are SEM (n = 3 – 4) C) Electron micrograph of two representative uncoated CFMEs removed after 30 minute implantations in the nucleus accumbens or prefrontal cortex show large accumulations of biomaterial on the surface of the electrode. D) Electron micrograph of a LD PEDOT:Nafion coated carbon fiber microelectrode implanted in the nucleus accumbens for six hours shows decreased accumulation of biomaterial when compared to uncoated CFMEs. Statistical significance is marked with asterisks (* P < 0.05, ** P < 0.01), and selectivity of treated electrodes is compared to uncoated carbon-fiber microelectrodes.
For the in vivo fouling procedure, uncoated electrodes were implanted in the prefrontal cortex (PFC) and nucleus accumbens (NAcc) of a male Sprague-Dawley rat for 30 minutes and compared to LD PEDOT:Nafion coated electrodes that were implanted for 6 hours to demonstrate the capacity of this coating to mitigate biofouling. Uncoated carbon fibers lost 60 ± 19 % and 33 ± 9 % of their sensitivity to dopamine over the course of 30 minutes of implantation in the PFC and NAcc, respectively (Figure 5, panel B). LD PEDOT:Nafion-coated CFMEs lost only 9 ± 5 % of the pre-calibration sensitivity, despite being implanted for 5.5 hours longer than the uncoated fibers. Differences in sensitivity between uncoated implanted electrodes (in the PFC and NAcc) and uncoated electrodes cycled in aCSF for 6 hours were statistically significant (Student’s T-test, P < 0.05, n = 3 – 4 for both implant sites), while LD PEDOT:Nafion-coated electrodes did not lose a statistically significant amount of sensitivity (Student’s T-test, P > 0.1, n = 3).
The origin of large uncertainty in uncoated CFME sensitivity loss could be due to differences in surgical preparation. Recently, two-photon mapping measurements made during implantation of microelectrodes showed that whether the microelectrode ruptures a blood vessel as it is lowered into the cortex can dramatically impact the performance of the microelectrode.46 Because few laboratories are equipped to guide the microelectrode into the brain with advanced blood vessel imaging techniques, there is value in mitigating fouling originating from ruptured intracranial blood vessels or other sources not described in literature.
Scanning electron microscopy with energy-dispersive X-ray spectroscopy was also performed with the intent of examining the surface morphology and fluorine content of coated and uncoated electrodes post-implantation. A representative micrograph of uncoated CFMEs implanted in either the PFC or NAcc show large accumulations of biomaterial, perhaps dried blood, on the electrodes after just 30 minutes of implantation (Figure 6, panel C). In contrast, a representative electron micrograph of a LD PEDOT:Nafion coated CFME implanted for 6 hours shows little accumulation of biomaterial on the electrode. The coated electrode also retained fluorine and sulfur (and therefore PEDOT:Nafion) on the electrode surface following implantation (Figure S-4).
The sensors retained selectivity for dopamine over ascorbic acid after 6 hours of implantation (pre-implantation DA/AA selectivity: 530 ± 40, post-implantation: 520 ± 180, no statistical difference, Student’s t-test, P > 0.1, n = 3 electrodes). The post-implantation selectivity for dopamine over DOPAC for the coated electrode was also retained (pre-implantation DA/DOPAC selectivity: 45 ± 6, post-implantation: 35 ± 3, no statistical difference, Student’s t-test, P > 0.1, n = 3 electrodes). Thus, the performance of the electrode coating not changed during an acute in vivo measurement.
Conclusions
A Nafion and PEDOT containing composite polymer has been electropolymerized in a novel scheme on carbon-fiber microelectrodes. The robust and reproducible coating is applied voltammetrically in a solution of EDOT and Nafion. Coated electrodes show increased electrochemical sensitivity (2 – 5×) and selectivity (2 – 30×), a comparable temporal response, lower noise, and mechanical stability. Coated electrodes do not lose selectivity and sensitivity after being implanted in the brain for 6 hours, which is an improvement over uncoated electrodes. From these data, we posit that LD PEDOT:Nafion-coated electrodes have a desirable combination of characteristics that lead us to recommend it over an uncoated electrode for in vivo dopamine measurements. The LD PEDOT:Nafion coating is also preferable to the HD PEDOT:Nafion coating because it retains electrochemical information by preserving the voltammogram shape. However, in circumstances where high sensitivity is required, the HD PEDOT:Nafion-coated electrodes may prove useful. Here, we exhibit the advantages of the coating with respect to dopamine measurements, but it may also be advantageous for in vivo measurements of other neurotransmitters. In the future, we would like to investigate chronic-implant performance and to establish a better mechanistic understanding of the sensor performance.
Supplementary Material
Acknowledgments
The authors thank the University of Arizona and NIH DA034975 for supporting this work. We thank Kate L. Parent for assisting with biofouling experiments. Additionally, we thank Dr. Brooke Massani, and the W.M. Keck Center for Surface and Interface Imaging. Lastly, we thank the Hexcel Corporation for a donation of AS-4 and IM-7 carbon fibers.
Footnotes
Supporting Information
Additional supporting figures are included. This material is available free of charge via the Internet at http://pubs.acs.org.
References
- 1.Schultz W. J. Neurophysiol. 1998;80:1–27. doi: 10.1152/jn.1998.80.1.1. [DOI] [PubMed] [Google Scholar]
- 2.Sawaguchi T, Goldman-Rakic PS. Science (80-.) 1991;251:947–950. doi: 10.1126/science.1825731. [DOI] [PubMed] [Google Scholar]
- 3.Shohamy D, Adcock RA. Trends Cogn. Sci. 2010;14:464–472. doi: 10.1016/j.tics.2010.08.002. [DOI] [PubMed] [Google Scholar]
- 4.Chowdhury R, Guitart-Masip M, Bunzeck N, Dolan RJ, Duzel E. Dopamine Modulates Episodic Memory Persistence in Old Age. J. Neurosci. 2012;32:14193–14204. doi: 10.1523/JNEUROSCI.1278-12.2012. [DOI] [PMC free article] [PubMed] [Google Scholar]
- 5.Di Chiara G, Bassareo V, Fenu S, De Luca MA, Spina L, Cadoni C, Acquas E, Carboni E, Valentini V, Lecca D. Neuropharmacology. 2004;47:227–241. doi: 10.1016/j.neuropharm.2004.06.032. [DOI] [PubMed] [Google Scholar]
- 6.Phillips PE, Stuber GD, Heien ML, Wightman RM, Carelli RM. Nature. 2003;422:614–618. doi: 10.1038/nature01476. [DOI] [PubMed] [Google Scholar]
- 7.Baik JH, Picetti R, Saiardi A, Thiriet G, Dierich A, Depaulis A, Le Meur M, Borrelli E. Nature. 1995;377:424–428. doi: 10.1038/377424a0. [DOI] [PubMed] [Google Scholar]
- 8.Kelly MA, Rubinstein M, Phillips TJ, Lessov CN, Burkhart-Kasch S, Zhang G, Bunzow JR, Fang Y, Gerhardt GA, Grandy DK, Low MJ. J. Neurosci. 1998;18:3470–3479. doi: 10.1523/JNEUROSCI.18-09-03470.1998. [DOI] [PMC free article] [PubMed] [Google Scholar]
- 9.Robinson DL, Venton BJ, Heien MLAV, Wightman RM. Clin. Chem. 2003;49:1763–1773. doi: 10.1373/49.10.1763. [DOI] [PubMed] [Google Scholar]
- 10.Bard AJ, Faulkner LR. Electrochemical Methods: Fundamentals and Applications. 2001;677:833. [Google Scholar]
- 11.Wiedemann DJ, Basse-Tomusk A, Wilson RL, Rebec GV, Wightman RM. J. Neurosci. Methods. 1990;35:9–18. doi: 10.1016/0165-0270(90)90089-x. [DOI] [PubMed] [Google Scholar]
- 12.Takmakov P, Zachek MK, Keithley RB, Bucher ES, McCarty GS, Wightman RM. Anal. Chem. 2010;82:9892–9900. doi: 10.1021/ac102399n. [DOI] [PMC free article] [PubMed] [Google Scholar]
- 13.Brazell MP, Kasser RJ, Renner KJ, Feng J, Moghaddam B, Adams RN. J. Neurosci. Methods. 1987;22:167–172. doi: 10.1016/0165-0270(87)90011-2. [DOI] [PubMed] [Google Scholar]
- 14.Capella P, Ghasemzadeh B, Mitchell K, Adams RN. Electroanalysis. 1990;2:175–182. [Google Scholar]
- 15.Gerhardt GA, Oke AF, Nagy G, Moghaddam B, Adams RN. Brain Res. 1984;290:390–395. doi: 10.1016/0006-8993(84)90963-6. [DOI] [PubMed] [Google Scholar]
- 16.Parsons LH, Justice JB. J. Neurochem. 1992;58:212–218. doi: 10.1111/j.1471-4159.1992.tb09298.x. [DOI] [PubMed] [Google Scholar]
- 17.Kreuer KD. J. Memb. Sci. 2001;185:29–39. [Google Scholar]
- 18.Mauritz KA, Moore RB. Chem. Rev. 2004;104:4535–4585. doi: 10.1021/cr0207123. [DOI] [PubMed] [Google Scholar]
- 19.Hashemi P, Dankoski EC, Petrovic J, Keithley RB, Wightman RM. Anal. Chem. 2009;81:9462–9471. doi: 10.1021/ac9018846. [DOI] [PMC free article] [PubMed] [Google Scholar]
- 20.Ross AE, Venton BJ. Analyst. 2012;137:3045. doi: 10.1039/c2an35297d. [DOI] [PMC free article] [PubMed] [Google Scholar]
- 21.Hashemi P, Walsh PL, Guillot TS, Gras-Najjar J, Takmakov P, Crews FT, Wightman RM. ACS Chem. Neurosci. 2011;2:658–666. doi: 10.1021/cn2000684. [DOI] [PMC free article] [PubMed] [Google Scholar]
- 22.Hsiao Y-S, Lin C-C, Hsieh H-J, Tsai S-M, Kuo C-W, Chu C-W, Chen P. Lab Chip. 2011;11:3674. doi: 10.1039/c1lc20675c. [DOI] [PubMed] [Google Scholar]
- 23.Larsen ST, Taboryski R. Analyst. 2012;137:5057–5061. doi: 10.1039/c2an35953g. [DOI] [PubMed] [Google Scholar]
- 24.Asplund M, Thaning E, Lundberg J, Sandberg-Nordqvist aC, Kostyszyn B, Inganäs O, von Holst H. Biomed. Mater. 2009;4:045009. doi: 10.1088/1748-6041/4/4/045009. [DOI] [PubMed] [Google Scholar]
- 25.Kim G, Kim H, Kim IJ, Kim JR, Lee JI, Ree M. J. Biomater. Sci. Polym. Ed. 2009;20:1687–1707. doi: 10.1163/156856208X386273. [DOI] [PubMed] [Google Scholar]
- 26.Lu J, Drzal LT, Worden RM, Lee I. Chem. Mater. 2007;19:6240–6246. [Google Scholar]
- 27.Gogol EV, Evtugyn GA, Marty JL, Budnikov HC, Winter VG. Talanta. 2000;53:379–389. doi: 10.1016/s0039-9140(00)00507-5. [DOI] [PubMed] [Google Scholar]
- 28.Yang L, Wang G, Liu Y. Anal. Biochem. 2013;437:144–149. doi: 10.1016/j.ab.2013.03.004. [DOI] [PubMed] [Google Scholar]
- 29.Luo S-C, Mohamed Ali E, Tansil NC, Yu H-H, Gao S, Kantchev EAB, Ying JY. Langmuir. 2008;24:8071–8077. doi: 10.1021/la800333g. [DOI] [PubMed] [Google Scholar]
- 30.Atcherley CW, Laude ND, Parent KL, Heien ML. Langmuir. 2013;29:14885–14892. doi: 10.1021/la402686s. [DOI] [PubMed] [Google Scholar]
- 31.Larsen ST, Vreeland RF, Heien ML, Taboryski R. Analyst. 2012;137:1831–1836. doi: 10.1039/c2an16288a. [DOI] [PubMed] [Google Scholar]
- 32.Winther-Jensen B, West K. Macromolecules. 2004;37:4538–4543. [Google Scholar]
- 33.Zhou C, Liu Z, Yan Y, Du X, Mai Y-W, Ringer S. Nanoscale Res. Lett. 2011;6:364. doi: 10.1186/1556-276X-6-364. [DOI] [PMC free article] [PubMed] [Google Scholar]
- 34.Cui X, Martin DC. Sensors Actuators B Chem. 2003;89:92–102. [Google Scholar]
- 35.Elschner A. PEDOT: principles and applications of an intrinsically conductive polymer. London: Boca Raton Fla: CRC Press; 2011. [Google Scholar]
- 36.Wang P, Olbricht WL. Chem. Eng. J. 2010;160:383–390. [Google Scholar]
- 37.Otero TF, De Larreta E. Synth. Met. 1988;26:79–88. [Google Scholar]
- 38.Zotti G, Zecchin S, Schiavon G, Louwet F, Groenendaal L, Crispin X, Osikowicz W, Salaneck W, Fahlman M. Macromolecules. 2003;36:3337–3344. [Google Scholar]
- 39.Arias-Pardilla J, Otero TF, Blanco R, Segura JL. Electrochim. Acta. 2010;55:1535–1542. [Google Scholar]
- 40.Velauthamurty K, Higgins SJ, Rajapakse RMG, Bacsa J, van Zalinge H, Nichols RJ, Haiss W. J. Mater. Chem. 2009;19:1850. [Google Scholar]
- 41.Atcherley CW, Vreeland RF, Monroe EB, Sanchez-Gomez E, Heien ML. Anal. Chem. 2013;85:7654–7658. doi: 10.1021/ac402037k. [DOI] [PubMed] [Google Scholar]
- 42.Venton BJ, Wightman RM. Synapse. 2007;61:37–39. doi: 10.1002/syn.20343. [DOI] [PubMed] [Google Scholar]
- 43.Takmakov P, Zachek MK, Keithley RB, Walsh PL, Donley C, McCarty GS, Wightman RM. Anal. Chem. 2010;82:2020–2028. doi: 10.1021/ac902753x. [DOI] [PMC free article] [PubMed] [Google Scholar]
- 44.Trouillon R, Cheung C, Patel BA, O’Hare D. Analyst. 2009;134:784–793. doi: 10.1039/b811958a. [DOI] [PubMed] [Google Scholar]
- 45.Singh YS, Sawarynski LE, Dabiri PD, Choi WR, Andrews AM. Anal. Chem. 2011;83:6658–6666. doi: 10.1021/ac2011729. [DOI] [PMC free article] [PubMed] [Google Scholar]
- 46.Kozai TDY, Marzullo TC, Hooi F, Langhals NB, Majewska AK, Brown EB, Kipke DR. J. Neural Eng. 2010;7:046011. doi: 10.1088/1741-2560/7/4/046011. [DOI] [PMC free article] [PubMed] [Google Scholar]
Associated Data
This section collects any data citations, data availability statements, or supplementary materials included in this article.


