Abstract
Immunoglobulin A (IgA), the major class of antibody secreted by the gut mucosa, is an important contributor to gut barrier function1–3. The repertoire of IgA bound to gut bacteria reflects both T cell-dependent and -independent pathways4,5, plus glycans present on the antibody’s secretory component6. Human gut bacterial taxa targeted by IgA in the setting of intestinal barrier dysfunction are capable of producing intestinal pathology when isolated and transferred to gnotobiotic mice7,8. A complex reorientation of gut immunity occurs as infants transition from passively acquired IgA present in breast milk to host-derived IgA9–11. How IgA responses co-develop with assembly of the microbiota during this period remains poorly understood. Here, we (i) identify a set of age-discriminatory bacterial taxa whose representations define a program of microbiota assembly/maturation during the first 2 postnatal years that is shared across 40 healthy USA twin pairs; (ii) describe a pattern of progression of gut mucosal IgA responses to bacterial members of the microbiota that is highly distinctive for family members (twin pairs) during the first several postnatal months then generalizes across pairs in the second year; and (iii) assess the effects of zygosity, birth mode and breast feeding. Age-associated differences in these IgA responses can be recapitulated in young germ-free mice, colonized with fecal microbiota obtained from two twin pairs at 6 and 18 months of age, and fed a sequence of human diets that simulate the transition from milk feeding to complementary foods. The majority of these responses were robust to diet suggesting that ‘intrinsic’ properties of community members play a dominant role in dictating IgA responses. The approach described can be used to define gut mucosal immune development in health and disease states and help discover ways for repairing or preventing perturbations in this facet of host immunity.
To define the relationship between assembly of the gut community and gut mucosal IgA responses, we collected fecal samples monthly for the first 24–36 months of postnatal life from each member of a birth cohort of 40 twin pairs (21 monozygotic) who lived in the greater metropolitan area of a single city in the USA (St. Louis, Missouri). All twins had healthy growth phenotypes as judged by serial anthropometry; 13 pairs were delivered vaginally, 24 by Caesarian section, and three pairs were discordant for mode of birth; 96% received breast milk, infant formula or a combination of the two as the predominant food source throughout the first six months of postnatal life (Supplementary Tables 1–4).
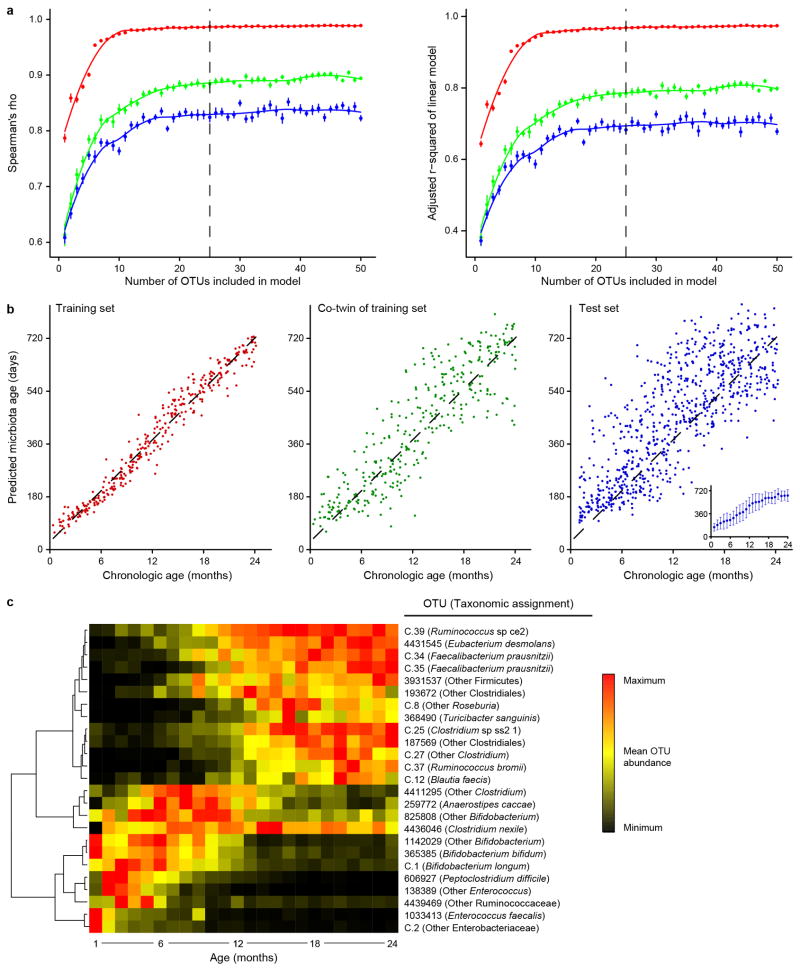
Gut microbiota assembly was defined following an approach based on our previous studies of healthy Bangladeshi and Malawian infants and children12,13. We generated a Random Forests (RF)-derived model of microbiota development from a bacterial V4-16S rRNA dataset generated from 1,670 fecal samples collected from the 40 twin pairs [20.9±6.2 samples/individual (mean±SD)]. The sparse RF-generated model, based on the relative abundances of the 25 most age discriminatory operational taxonomic units (OTUs), could predict chronological age for members of twin pairs as well as for biologically unrelated individuals (OTUs defined by mapping sequenced reads to a reference database of 16S rRNA sequences; see Methods, Extended Data Figures 1,2a-c, Supplementary Tables 5–8). We then conducted a series of reciprocal tests with the datasets we generated from the three birth cohorts. We applied each sparse model to the population of healthy infants and children from which it was generated as well as to the other two populations and found that the USA model performed consistently across the three populations (Spearman’s correlation coefficients of 0.73 and 0.78 for the Bangladeshi and Malawian datasets, respectively; see Methods and Supplementary Table 9).
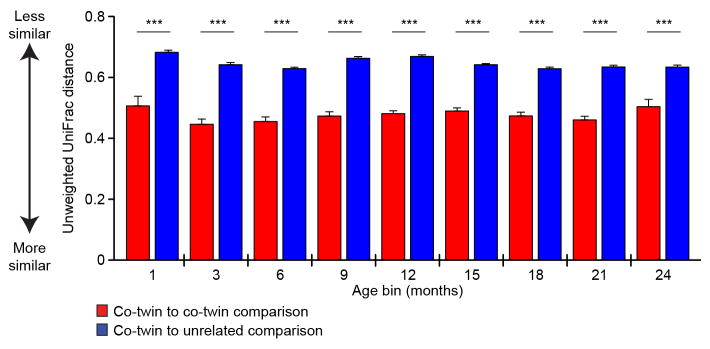
Although previous studies have identified taxa that are shared more commonly between adult monozygotic compared to dizygotic twin pairs14–15, our analysis indicated that none of the 25 age-discriminatory OTUs showed significantly greater concordance in their relative abundances in monozygotic compared to dizygotic twin pairs (Supplementary Table 10). The impact of age, family, milk feeding history, and birth mode on the overall phylogenetic configuration of the microbiota was evaluated with a PERMANOVA and the UniFrac metric. Family had the largest effect (Extended Data Figure 3), followed by age, and milk feeding (i.e., breast milk versus formula) (36%, 11%, and 1%, respectively, when considering only those samples with associated feeding data; P<0.001 for all variables except birth mode, which did not have a significant effect). A previous study, conducted in the immediate postpartum period, reported that infants born by Caesarean section have a greater representation of skin-derived taxa than those that were vaginally delivered16. A caveat to our study is that we were not able to determine the very early effects of birth mode since the median time point for first fecal sampling was postpartum day 52.
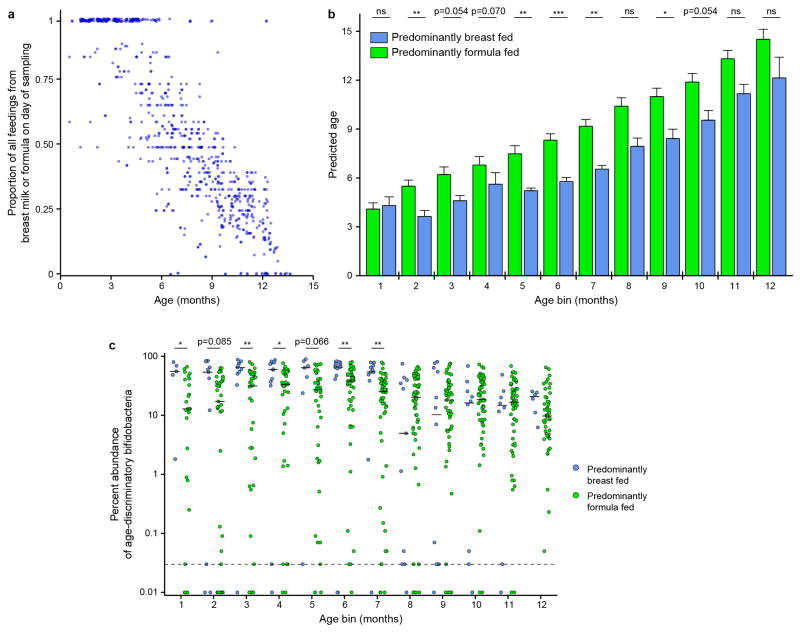
Fecal biospecimens were categorized as obtained from donors that were ‘predominantly formula fed’ or ‘predominantly breast fed’ at the time of sampling (‘predominant’ defined as comprising >50% of that individual’s total milk feedings; Extended Data Figure 4a; Supplementary Table 2). Linear mixed effects modeling disclosed that milk feeding practice had a significant effect on maturity (P<0.001, ANOVA with predicted microbiota age as the dependent variable and individual/family/chronologic age as nested effects). In a post-hoc analysis, infants receiving >50% of their milk from formula feedings had significantly accelerated development of their microbiota during the first 6–7 months of postnatal life compared to infants receiving the majority of their milk from breastfeeding (n=619 and 127 samples, respectively; Mann-Whitney U test). These differences were no longer statistically significant by 12 months (Extended Data Figure 4b). This finding can be explained in part by the significantly lower aggregate relative abundance of members of the genus Bifidobacterium represented in the RF model in the fecal microbiota of formula-fed infants (Extended Data Figure 4c; Supplementary Table 11; ref. 17).
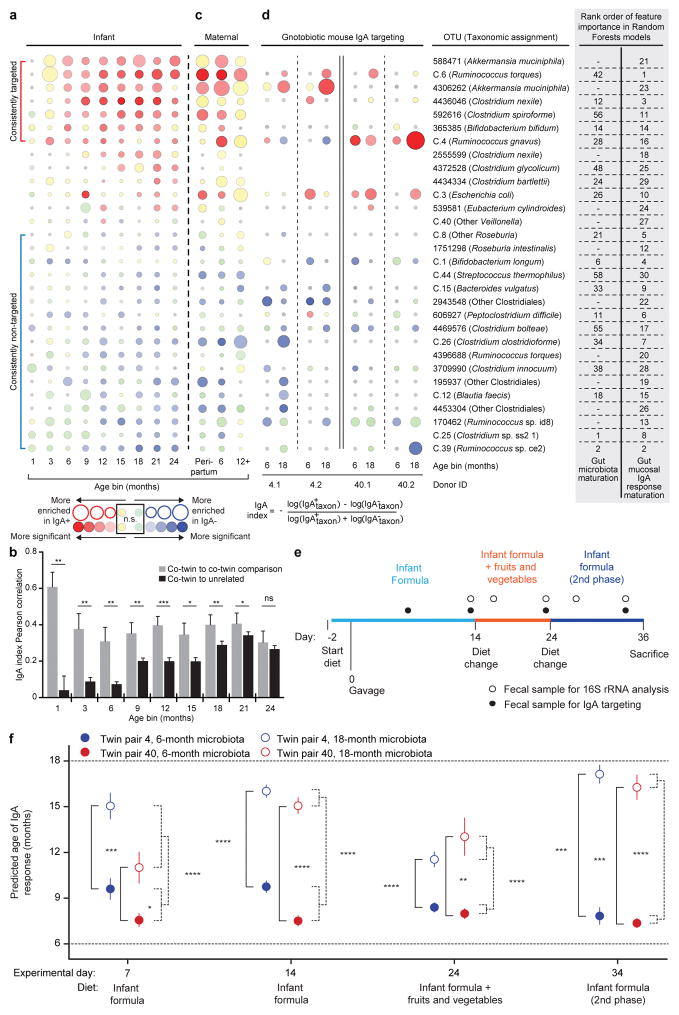
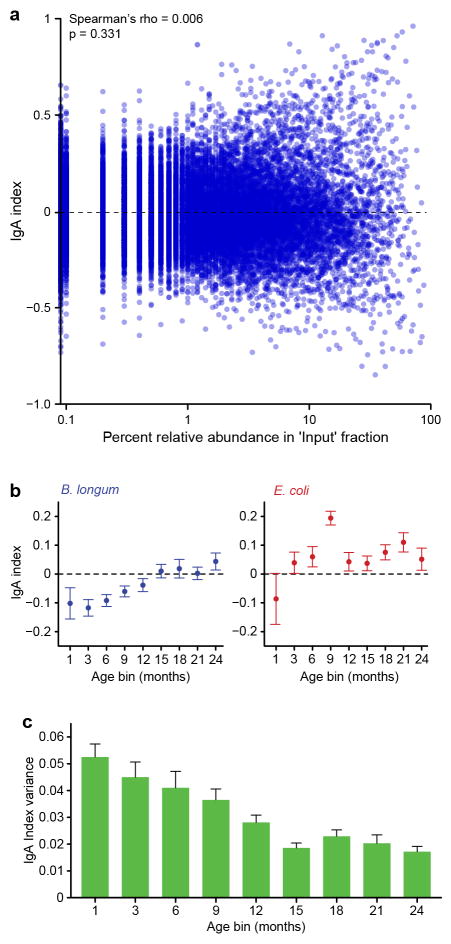
Fecal samples collected during the first postnatal month, and at 3-month intervals thereafter from each member of the 40 twin pairs were subjected to fluorescence-activated cell sorting (FACS) to characterize the patterns of IgA targeting of bacterial taxa in their developing microbiota (Supplementary Table 12; see Methods for a description of ‘BugFACS’ with anti-human IgA). V4-16S rRNA gene sequencing was performed on three fractions generated from each sample (“input”, IgA+, and IgA−). The differential representation of a given taxon between the IgA+ and IgA− fractions was expressed in the form of a log normalized ‘IgA index’ that ranges, in theory, from −1 to 1, with positive and negative values indicating enrichment in the IgA+ and IgA− fraction, respectively8 (Figure 1a). IgA indices are not a simple reflection of the relative abundances of organisms in the input fraction (Extended Data Figure 5a).
Figure 1. BugFACS-based analysis of the development of gut mucosal IgA responses in healthy USA twin pairs.
a, Bubble plots for OTUs significantly enriched in either the IgA+ or IgA− fraction across twin microbiota samples representing at least three age bins (n=534 fecal samples analyzed; 6.7±1.7 (mean±SD) samples/individual from the 1-,3-,6-,9-,12-,15-,18-,21-, and 24-month age bins). The size of the circle indicates the magnitude of enrichment (mean IgA index value) in either fraction. Color intensity indicates the statistical significance, as judged by a Wilcoxon signed-rank test. Gray indicates that a taxon was not detected in any sample at that time point. Taxa are ordered by their mean IgA indices defined across all time points. The rank order of feature importance for OTUs in the RF-derived models of ‘gut microbiota maturation’ and ‘gut mucosal IgA response maturation’ is indicated. The upper bracket to left of the figure encompasses OTUs identified as consistently IgA-targeted after the first three postnatal months, while the lower bracket highlights OTUs designated as consistently not targeted in multiple age bins after the first 3 postnatal months. b, Pearson correlation coefficients were used to compare the similarity of IgA index profiles of twins and unrelated children within a given age bin (n=9 total age bins). The correlation coefficient between members of a twin pair in a given age bin was compared to the mean of the correlations between that pair and all other age-matched unrelated children in the cohort (mean+SEM). Statistical significance was defined with the paired Wilcoxon test. *, P< 0.05; **, P< 0.01; ***, P< 0.001. c. Samples from mothers of the twin pairs were collected during the peripartum period, at 6 months after birth, and at ≥12 months after birth. Samples (n=106) were subjected to BugFACS and analyzed as above. d. Modeling development of gut IgA responses in young gnotobiotic mice colonized with the fecal microbiota from two twin pairs and fed infant formula and complementary foods. Bubble plots for OTUs shown in panel a that were present in BugFACS fractions prepared from the fecal microbiota of mice harboring transplanted fecal microbiota from 6- and 18-month old co-twins belonging to the two twin pairs (n=4–5 mice per group, total of 143 fecal samples analyzed). Data were pooled from the four indicated time points in the diet oscillation. e, Experimental design for gnotobiotic mouse experiment. f, ‘Age’ of the IgA responses documented in mice as a function of donor microbiota and diet. The RF model of human gut mucosal IgA response maturation was applied to BugFACS datasets generated from mouse samples. Data are averaged within recipients of twin pair microbiota from a given age bin (n=4–5 mice per group, 143 fecal samples analyzed). Mean values ± SEM are plotted. *, P<0.05; **, P<0.01; ***, P<0.001; ****, P<0.0001 (Mann-Whitney U test for the indicated comparisons).
We identified 30 OTUs that were significantly enriched in either the IgA+ or IgA− fraction in three or more age bins (Figure 1a). Seven OTUs exhibited consistently positive IgA indices after the third month of life, including two age-discriminatory members of the sparse RF-generated model of gut microbiota development (Clostridium nexile OTU 4436046, Bifidobacterium bifidum OTU 365385; Figure 1a). Seventeen OTUs remained untargeted throughout the first 24 months, including six OTUs in the RF-based model (Figure 1a). Two OTUs manifested significant differences in their IgA targeting during the first two postnatal years: B. longum (OTU C.1) and Escherichia coli (OTU C.3) (Extended Data Figure 5b; Supplementary Table 13).
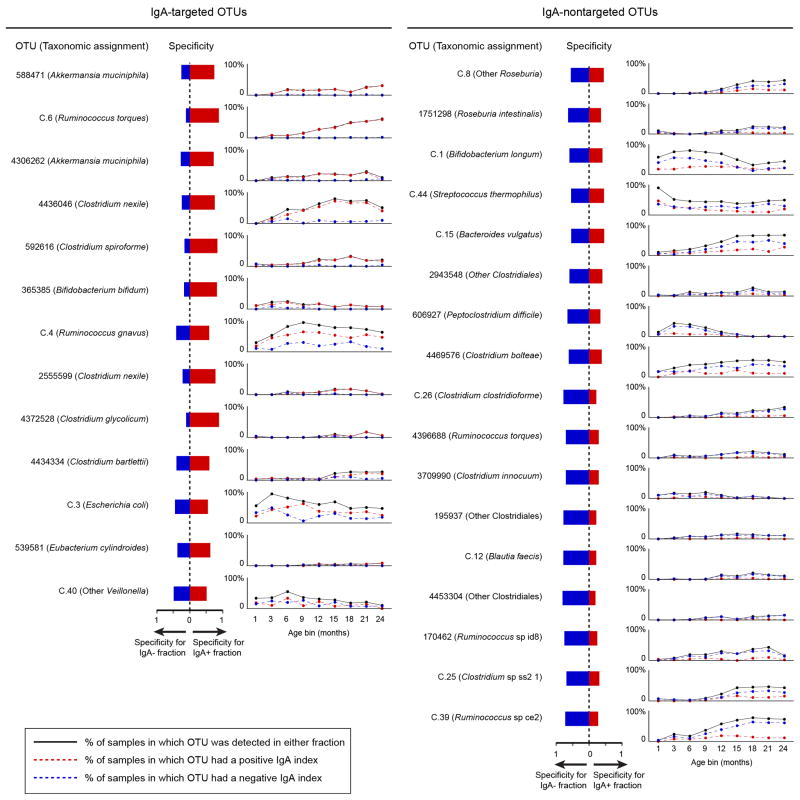
We performed an indicator species analysis18 across all time points to obtain a metric complementary to the IgA index that could describe the strength of partitioning of the 30 OTUs into the IgA+ or IgA− fraction. The results were largely concordant with those obtained from the IgA index-based analysis and provided an additional level of resolution of the temporal patterns and specificity of targeting (Supplementary Table 14, Extended Data Figure 6).
IgA indices were highly correlated within twin pairs during the first 21 months of life (Figure 1b). Indices between unrelated infants were very weakly correlated during the first 6 postnatal months, became increasingly more correlated during the second year of life, and by 24 months co-twins no longer had an IgA response that was significantly more similar to one another than to other unrelated children (Wilcoxon signed-rank test; Figure 1b). As the effects of family membership diminished, variation of the IgA index for a given taxon across the population of twins also diminished (Extended Data Figure 5c). The similarity in the IgA profiles between mothers sampled during the first 12 postpartum months [39 mothers; 3.0±1.0 (mean±SD) samples/mother) and children at 24 months of life supports the notion that development of a child’s gut mucosal IgA responses reaches a state of maturation that resembles that of adults by this age (Supplementary Tables 15–16, Figure 1c).
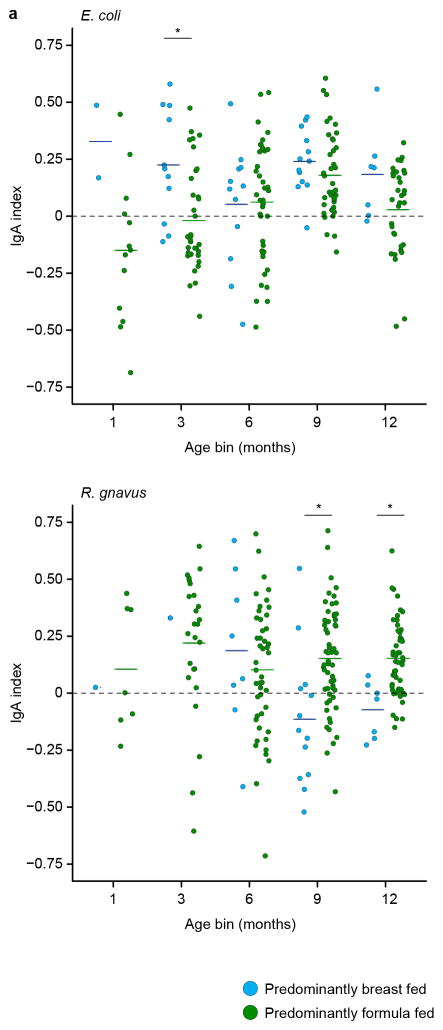
Based on Pearson correlation distance, we determined that age and family membership explained the most variance in IgA indices (25% and 19%, respectively), while zygosity and mode of delivery had small but statistically significant effects (0.6% and 0.5%, respectively; PERMANOVA with 999 permutations). Breastfeeding explained 5% of the variance in the model (P<0.001 for breast milk versus formula feeding as well as for age and family). Intriguingly, IgA targeting of two taxa, E. coli (OTU C.3) and R. gnavus (OTU C.4), varied between children who were predominantly breastfed and those who were predominantly formula-fed, with breastfed children exhibiting significantly higher IgA targeting of E. coli at three months of age and significantly lower IgA targeting of R. gnavus during the latter half of the first year of life (Extended Data Figure 7).
To quantify the stage of development of gut mucosal IgA responses, we randomly selected 20 unrelated children from the healthy twin cohort and generated a RF model based on the IgA indices to 30 taxa identified in Figure 1a. The model was then applied to unrelated children represented in the remaining 20 twin pairs (‘test set’, n=40). Even though the dataset was smaller than the one used to generate the RF model of gut microbiota development, the effort produced a model of development of IgA responses that correlated with donor chronologic age (Spearman correlation for training set and test set, 0.97, and 0.72, respectively; Supplementary Tables 13,17).
Fecal samples from two twin pairs whose pattern of gut microbiota development was well described by the RF-derived model and whose IgA responses exemplified those of the larger population were selected for transplantation into germ-free mice (pairs 4 and 40 in Supplementary Table 13). Both twin pairs were predominantly formula-fed throughout their first year of life (Supplementary Table 2). Fecal samples, collected from each of these four individuals when they were 6- and 18-months old, were introduced into separate groups of male 5-week-old C57BL/6J germ-free mice (n=4–5 mice/donor sample; 8 treatment groups). Two days prior to gavage, all mice were switched from a standard low fat, high plant polysaccharide mouse chow to a sterilized human infant formula diet (see Methods). Following gavage, animals were maintained on this diet for 14 days and then switched to a diet constructed based on a survey of fruits and vegetables most commonly consumed by infants transitioning to complementary foods19. This diet consisted of isocaloric amounts of the powdered infant formula diet and a mixture of sweet potatoes, green beans, bananas, and apples. After 10 days, animals were returned to the infant formula diet for another 10 days. Fecal samples were obtained from recipient mice at frequent intervals throughout all diet phases and subjected to 16S rRNA sequencing and/or to BugFACS (Figure 1d,e; Extended Data Figure 8a).
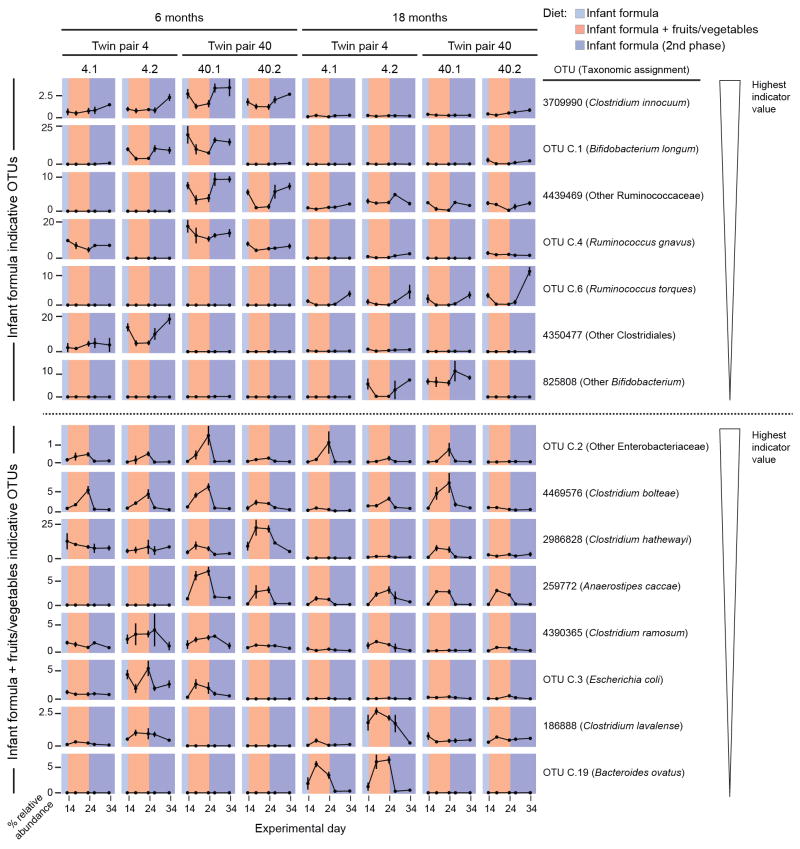
Indicator species analysis revealed that the abundances of 15 of the top 60 taxa in the RF-derived model of gut microbiota maturation varied significantly in the context of one or the other diets (FDR-corrected P<0.05 and indicator value >0.5; Supplementary Tables 18,19). Most of these taxa responded in the same direction (increased or decreased in abundance) to the different diets, independent of the microbiota donor or donor age (Extended Data Figure 8b). For example, the age-discriminatory OTU C.1 (B. longum) and OTU 4439469 (a member of Ruminococcaceae) have highest mean relative abundances during the first six months of postnatal life in members of the twin cohort (Extended Data Figure 2c); these taxa also exhibited significantly greater relative abundance in the fecal microbiota of recipient gnotobotic mice when they were consuming the infant formula diet. In contrast, Anaerostipes caccae (OTU 259772), which peaks in abundance during the latter half of the first postnatal year (the period corresponding to introduction of complementary foods in our twin study; Extended Data Figure 2c, Extended Data Figure 4a), was significantly higher in its abundance during the ‘formula plus fruits and vegetables’ diet phase (Extended Data Figure 8b).
To determine whether age-associated differences in IgA responses to components of the donors’ microbiota could be recapitulated in gnotobiotic mice, we subjected their fecal samples collected at 7, 14, 24, and 34 days after gavage to BugFACS (Supplementary Table 20). IgA responses in mice broadly mirrored those of the human donor population; taxa that were consistently not targeted across members of the twin cohort during the first two years of postnatal life (e.g., Clostridium clostridioforme OTU C.26 and C. bolteae OTU 4469576) were generally not targeted in mice colonized with the 6- and 18-month microbiota samples from the two twin pairs, while bacteria targeted in mice belonged to the set of that were consistently IgA targeted in infants/children from postnatal months 6 to 24 [e.g., Ruminococcus torques (OTU C.6) and Akkermansia muciniphila (OTU 4306262)] (Figure 1d and Supplementary Table 21).
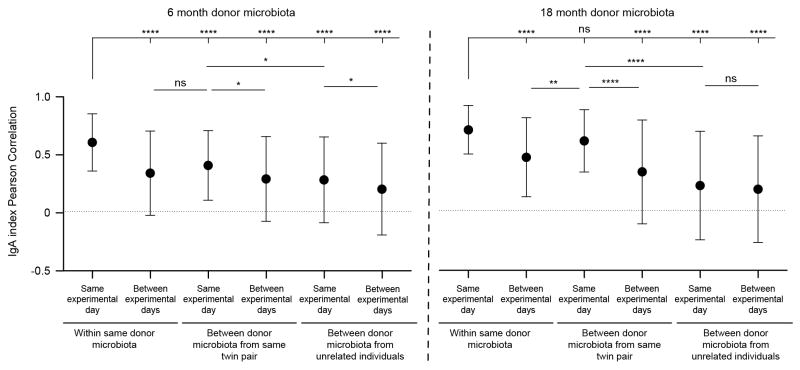
IgA-targeting of five OTUs varied significantly with the diet oscillation, whether judged by a comparison of the first and second or second and third diet phases (FDR-corrected repeated measures ANOVA): they include OTUs whose IgA targeting increased during the fruits and vegetables phase [OTUs 4306262 (A. muciniphila) and C.39 (Ruminococcus sp ce2)], and those whose targeting decreased [OTUs C.4 (R. gnavus), 4469576 (Clostridium bolteae), 4453304 (Other Clostridiales)] (Supplementary Table 22). IgA responses were most similar in mice harboring a given donor microbiota, and were more similar within members of a twin pair than between unrelated children (Extended Data Figure 9).
Applying our RF-derived model of maturation of human gut mucosal IgA responses to the mouse BugFACS dataset showed that animals recapitulated distinct age-associated differences in mucosal IgA responses to the (transplanted) human microbiota; i.e., for both twin pairs, the state of maturation of the IgA response in mice was significantly greater when animals were colonized with the 18-month compared to 6-month donors’ communities. Remarkably, this significant difference in age-associated responses for a given co-twin or twin pair microbiota was evident in both diet contexts (Figure 1e; Supplementary Table 21). We concluded that IgA responses to members of the 6-month old gut microbiota were shared across the two twin pairs and robust to the transition to complementary foods. The fact that distinctive responses to the 18-month compared to 6-month microbiota were identified in recipient mice even in the context of a milk (formula) diet supports the notion that ‘intrinsic’ properties of community members (e.g., properties not clearly related to taxonomy or obviously affected by community composition) play a dominant role in dictating the gut mucosal IgA targeting response.
Prospectus
The stability of the IgA molecule, the ease and safety of obtaining fecal samples, and the ability to sort members of a fecal microbiota sample into IgA-enriched versus non-enriched fractions provide a way to noninvasively quantify states of development of the mucosal immune system as a function of different host and environmental factors. BugFACS offers an opportunity to identify previously unappreciated ‘IgA deficiencies’ presenting not as a lack of, or reduction in, the amount of total IgA in the gut lumen, but rather as aberrant patterns of IgA targeting. The effects of such deficiencies would need to be explored with the understanding that barrier function can be affected by multiple factors besides IgA, including for example mucin20, and less well understood elements such as catecholaminergic inputs21. BugFACS also provides a way to explore the biology of IgA targeting of bacterial strains as a function of their proximity to the intestinal epithelium and their location along the length of the gut. The importance of the small intestine as a source of the T cell-independent IgA response to members of the microbiota was highlighted in a recent study by Bunker and coworkers4.
In principle, deviations from the pattern of convergence of IgA responses observed in the present study could occur in scenarios where colonization is abnormal, resulting in pathologic immune responses in anatomically distant locations, such as that observed in asthma22 or various autoimmune/immunoinflammatory disorders. One obvious next step is to assess the generalizability of the shared pattern observed in this study by characterizing healthy members of birth cohorts representing different geographic areas, distinctive cultural and dietary traditions, and living environments with varying degrees of sanitation. Gut microbiota development is impaired in children with undernutrition12. Given that undernutrition is associated with impaired gut barrier function and responses to particular vaccines23, a comparison of the development of gut mucosal IgA responses to members of the microbiota in healthy and undernourished members of birth cohorts could provide a metric for disease classification, assessment of the impact of enteropathogen infection/burden, and a means for assessing the efficacy of current or new therapeutic interventions, including approaches for oral vaccination.
The ability to re-enact and recapitulate features of the development of gut mucosal IgA responses to human donor gut microbial communities in wild-type or genetically manipulated gnotobiotic mice should help delineate the mechanisms that control the temporal evolution and specificity of IgA responses to members of the gut community, the effects of the IgA response on targeted microbes and other members of the microbiota, as well as the impact on host biology. As such, these models could be used to identify new strategies for deliberately manipulating mucosal barrier/immune function, including food-based and/or microbial interventions.
Materials and Methods
Human studies
Protocols used for recruitment of participants, obtaining informed consent, collecting and de-identifying fecal samples, and acquiring and de-identifying clinical metadata were all approved by the Human Research Protection Office of Washington University School of Medicine. A total of 40 twin pairs were included in this study; this number was not determined by a power calculation. All breast milk provided was from the mothers of the twins themselves and was not pasteurized.
Breast milk was given from the breast directly or from bottles after being expressed by the mother. Expressed milk was given immediately or stored temporarily in home freezers. In the latter case, mothers were instructed to thaw their milk in warm water.
Determination of zygosity
Zygosity testing of same gender twins was performed on residual blood samples obtained for clinical care, or samples obtained at the time of mandatory Missouri-state metabolic testing. Short tandem repeat polymorphic DNA markers were amplified from blood DNA by PCR, labeled with fluorescent markers and separated by capillary electrophoresis to distinguish different alleles at each of 10 different loci (D3S1358, vWA, FGA, Amelogenin, D8S1179, D21S11, D18S51, D5S818, D13S317 and D7S820).
V4-16S rRNA gene sequencing and data analysis
Fecal samples were quickly frozen at −20°C and subsequently stored at −80°C. Samples were pulverized in liquid nitrogen and DNA was extracted from an aliquot of the material (130 ± 36 mg; mean± SD) by bead-beating in a solution consisting of 500 μL of phenol:chloroform:isoamyl alcohol (25:24:1), 210 μL of 20% SDS and 500 μL of buffer A (200 mM NaCl, 200 mM Trizma base, 20 mM EDTA). DNA was further purified with Qiaquick columns (Qiagen), eluted in 70 μL of Tris-EDTA (TE) buffer, and quantified (Quant-iT dsDNA broad range kit; Invitrogen). The concentration of each DNA sample was normalized to 1 ng/μL and the DNA was subjected to PCR with phased, barcoded primers directed against variable region 4 of the bacterial 16S rRNA gene24. Amplicons were quantified as above, pooled and sequenced on an Illumina MiSeq instrument (paired-end 250 nt reads). Paired-end reads were merged (FLASH, version 1.2.6). De-multiplexed reads were clustered into OTUs with the 97% identity sequence set from the GreenGenes 2013 reference database and QIIME version 1.825. An ‘abundance-filtered dataset’ was generated by selecting OTUs that were detected at >0.1% relative abundance in ≥1% of the samples; only these OTUs were considered for further analysis.
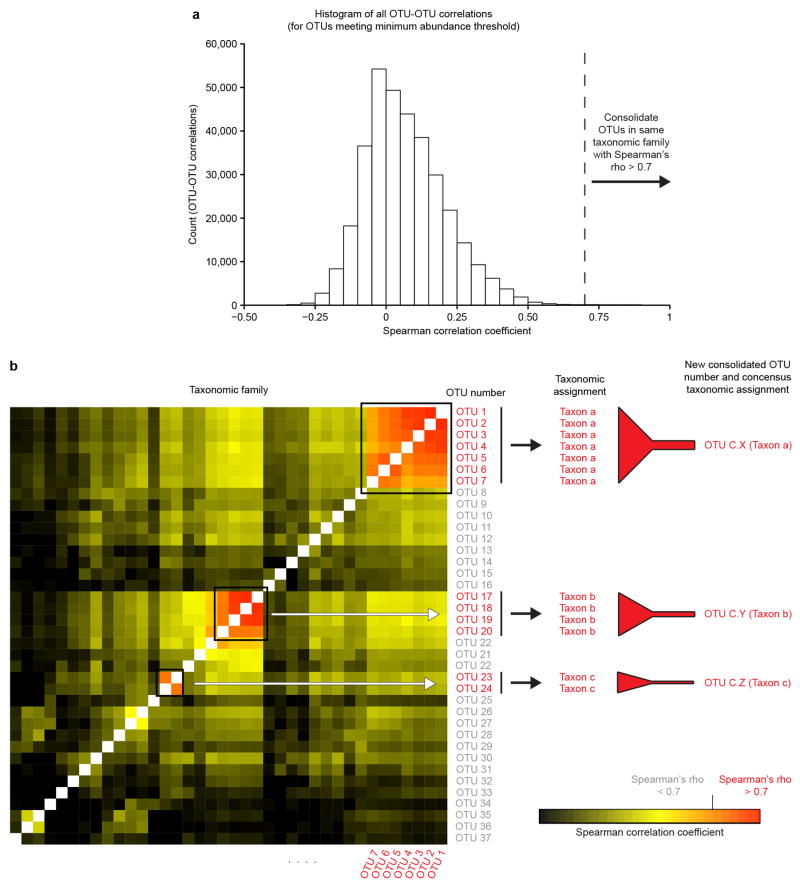
Taxonomy was assigned to 97%ID OTUs with RDP 2.4, as described previously8. Taxonomically-related OTUs that shared a high degree of rank order co-linearity of their abundance (Spearman’s rho > 0.7) were consolidated as follows: (i) for each family-level taxon that was detected in the abundance-filtered data set, a list of OTUs belonging to the family was generated; (ii) the abundances of OTUs within this family across all samples analyzed were then correlated with each other to generate Spearman correlation coefficients for each OTU-OTU comparison; and (iii) counts for OTUs that shared a high degree of co-linearity with each other were then combined to generate the consolidated OTUs according to the scheme that is illustrated in Extended Data Figure 1 (see Supplemental Table 5 for a list of OTUs that were consolidated; note that OTUs used to generate a ‘consolidated OTU’ shared on average 99.3±0.4% (mean±SD) nucleotide sequence identity in their V4-16S rRNA sequences; OTUs that did not satisfy the threshold cutoff for co-linearity in abundance were not consolidated). A new OTU table was then generated, consisting of consolidated OTUs that were assigned a new OTU ID and all other non-consolidated OTUs. These OTU tables were then rarefied to depths of 1000 reads for the BugFACS-related analyses described below, and 5000 reads for all other analyses.
BugFACS of human samples
A separate aliquot of a pulverized frozen fecal sample was transferred to a pre-weighed 1.5 mL microcentrifuge tube (Life Technologies), and processed as described previously with some minor modifications8. Samples were resuspended in 1 mL of PBS, vortexed at room temperature for 5 minutes (1500 rotations per minute), and then placed on ice for 5 minutes to allow large particulate matter to settle by gravity. A volume equivalent to 5 mg of pulverized fecal material was passed through a nylon 70 μm mesh filter (BD). One mL of ice cold PBS was added to each filtered sample, which was then centrifuged at 10,000 x g for 3 minutes (4°C). The resulting supernatant was discarded and the cell pellet was resuspended in 100 μL of a 1/50 dilution of goat anti-human IgA conjugated to DyLight 650 (Abcam; catalog number ab96998). Samples were subsequently incubated on ice in the dark for 30 minutes, washed with 1 mL of PBS, and resuspended in a 1/4000 dilution of SytoBC bacterial DNA stain [Life Technologies; prepared in HEPES-NaCl buffer (0.9% NaCl, 10 mM HEPES)], immediately prior to introduction into a FACSAria III cell sorter (Bectin Dickinson).
For each sample, 50,000 cytometer ‘events’ were recovered from the ‘Input’, ‘IgA+’, and ‘IgA−‘ gates (for details regarding the sorting protocol and gating strategies, see ref. 8). Additionally, samples of sheath fluid were collected immediately prior to and following sorting to allow assessment of any potential contaminants in fluid lines. Sorted fractions and control sheath fluid samples were frozen and stored at −20°C. Each BugFACS-sorted fraction was subjected to V4-16S rRNA gene PCR in triplicate 20 μL reactions. Each reaction contained 2 μL of 10X HiFi PCR Buffer (Invitrogen), 0.8 μL of 50 mM magnesium sulfate (Invitrogen), 0.4 μL of dNTP mix (Invitrogen), 0.16 μL of Platinum Taq (Invitrogen), 1 μL of a 5 μM stock of forward PCR primer, 1 μL of 5 μM barcoded reverse PCR primer26, 2.5 μL of BugFACS sorted cells, and 12.1 μL of water. A negative control reaction with no sorted cells was included for each barcoded primer. The following PCR conditions were used: 95°C for 10 minutes followed by 31 cycles of 95°C for 30 seconds, 53°C for 30 seconds and 68°C for 45 seconds, followed by 68°C for 2 minutes. Triplicate reactions were pooled and subjected to 1% agarose gel electrophoresis to verify the presence of a PCR product (these gels also contained negative control reactions). If any of the three sorted fractions from a given sample failed to amplify successfully, PCRs were repeated for 34 cycles for all three fractions under the same temperature cycling conditions. PCR-amplified fractions were pooled in equal proportion. Although amplicon bands were not visible for sheath fluid controls, a set volume of these reactions was also included in the sequencing pool. Pooled amplicons were purified with magnetic beads (AMPure XP, Agencourt) and subjected to multiplex sequencing (paired-end 250 nt reads) on a MiSeq instrument as above.
Following OTU picking, but prior to abundance filtering, sheath fluid-contaminating OTUs were identified as sequences that constituted >1% of the reads in both the pre- and post-sort sheath fluid samples for a given day. Contaminants that were identified on more than two days were removed from the OTU table. If multiple genera within a family-level taxon were identified as sheath contaminants, the entire family was removed from the OTU table. This list included the following families: Burkholderiaceae, Xanthomonadaceae, Comamonadaceae, Brucellaceae, Pseudomonadaceae, Xanthobacteraceae, and Alcaligenaceae. Altogether, OTUs belonging to these families accounted for less than 0.05% of all sequences in the twin pair, maternal, and mouse fecal samples, and for less than 2% of all sequences in samples subjected to BugFACS. IgA indices were subsequently calculated for a given taxon in a given sample if that taxon comprised ≥0.5% of the 16S rRNA reads in either the IgA+ or IgA− fraction.
Random Forests (RF) modeling
RF modeling of gut microbiota development was performed with the ‘randomForest’ package27 in R. Input data consisted of OTU data rarefied to a depth of 5000 V4-16S rRNA reads per fecal sample. Feature importance scores for each OTU in the data set were calculated by randomly selecting one co-twin from half of the twin pairs (n=20 individuals). A RF model was generated from this subset of data. Randomization and this process of model construction were performed 100 times (100 trees per model). Feature importance scores were extracted from each model, averaged across the 100 models, and used to rank the OTUs from highest to lowest feature importance.
To estimate the number of OTUs needed to build a sparse model, a new set of RF models was generated by selecting one co-twin from half of the twin pairs in the cohort as above, and evaluating the performance of the model (Spearman’s rho and the adjusted r-squared of a linear model as metrics) when applied to (i) the individuals used to generate the model, (ii) their co-twins, and (iii) all unrelated fecal samples (‘Training’, ‘Co-twin’, and ‘Test sets, respectively). A series of models was built with increasing numbers of OTUs, starting with the OTU assigned the highest feature importance score, and sequentially adding OTUs in decreasing order of feature importance. For each model of a different size, 10 randomizations were performed; performance of the model was averaged across the independent replicates to generate standard error measurements. The subset of 25 OTUs with highest rank order of feature importance scores was used to create a sparse model. This sparse model, generated from samples collected during the first 36 months of postnatal life, was applied to 16S rRNA datasets generated from fecal samples collected between 1 and 24 months of age to predict chronological age in members of the ‘Training’, ‘Co-twin’, and ‘Test subsets as described above. A parallel RF-derived model was generated from IgA index data for the 30 OTUs shown in Figure 1a. If a taxon was not detected in either the IgA+ or IgA− fraction, it was given a value of 0 prior to model construction. This model was applied to the ‘Training’, ‘Co-twin’ and ‘Test’ sets.
OTUs were reassigned to incorporate datasets from all three countries (USA, Bangladesh and Malawi), resulting in a second set of consolidated OTUs (see Supplementary Table 9). Feature importance scores were calculated by iteratively regressing each country’s training set of samples 100 times against chronological age (100 trees per model); OTUs were ranked by the mean values of their feature importance scores across the 100 models. The 25 most age-discriminatory OTUs were used to generate each respective country’s sparse RF model. Each model was used to predict the microbiota ages of members of that country’s corresponding test set, as well as the microbiota ages of all members of the healthy cohorts from each of the other two countries. Spearman correlation coefficients were generated by building each sparse RF model 10 times, correlating predicted microbiota ages with chronological ages, and averaging the coefficients.
Animal studies
All experiments involving mice were performed according to protocols that were in compliance with ethical regulations and approved by the Washington University Animal Studies Committee. No inclusion or exclusion criteria were established; all animals studied were included in our analyses.
Gnotobiotic mouse husbandry
Germ-free 5 week-old male C57BL/6J mice (Mus musculus) were maintained on a strict 12 h light cycle (lights on at 0600) in flexible plastic gnotobiotic isolators (Class Biologically Clean Ltd., Madison, WI). Mice were weaned onto an autoclaved, standard mouse chow diet low in fat and rich in plant polysaccharides (B&K Universal, East Yorkshire, U.K; diet 7378000). Two days before introduction of human donor fecal samples by gavage, 5-week old animals were switched to the human infant formula diet.
Diets
The infant formula diet consisted of a mixture of Similac ‘Sensitive with Iron’ infant formula and unflavored whey protein powder (GNC) mixed at an 11:1 ratio (w/w). This powdered diet was reconstituted in the gnotobiotic isolator on a daily basis with sterile water. The infant formula plus fruits and vegetables diet was based on a survey of the fruits and vegetables most commonly consumed by infants transitioning to complementary foods19, and consisted of isocaloric amounts of the powdered infant formula diet and a mixture of 1:1:1:1 ratio (by mass) of sweet potatoes, green beans, bananas, and apples (Gerber 1st Foods). Formula was irradiated as a powder. Fruits and vegetables were irradiated in their original plastic containers prior to the start of the experiment [25–30 Gy; Steris Isomedix] and mixed with the irradiated formula powder. When mice were consuming infant formula diet alone, fresh food was prepared daily within the gnotobiotic isolator and presented to animals in sterile plastic trays that were changed daily. When animals were given the mixture of formula and fruits/vegetables, food was prepared every other day, and new aliquots given to animals in fresh trays daily. Bedding was changed with each phase of the diet oscillation; within a given diet phase, bedding was changed every 2–3 days.
Microbiota transplants
A given pulverized frozen human fecal sample (353±184 mg; mean±SD) was transferred to an anaerobic Coy chamber (atmosphere 75% N2, 20% CO2, 5% H2) in a 2mL Axygen screw topped tube. The tube was then opened and its contents were transferred to a 50 mL conical shaped polypropylene tube (Falcon). The fecal material was suspended in 10 mL of sterile PBS supplemented with 0.1% L-cysteine (Sigma) by vortexing with sterile 2 mm-diameter glass beads. The suspension was passed through a nylon 100 μm mesh filter (BD) and the filtrate was mixed with an equal volume of 30% glycerol in PBS/0.1% cysteine. Aliquots (1.2 mL) of this suspension were placed amber glass vials, each of which was sealed with a crimp top, and frozen at −80°C. Tubes were thawed, and transferred into gnotobiotic isolators (with surface sterilization achieved by treatment with Clidox). Aliquots (200 μL) were then introduced into each germ-free mouse in a given experimental group by oral gavage. A total of 38 animals were used for this study (n=4–5 mice/donor microbiota). This size of each treatment group was not based on a formal power calculation but was informed by our previous work described in ref. 8. There was no randomization of mice for this study; male C57BL/6J animals in each group were age- and weight-matched prior to gavage. Investigators were not blinded with respect to the donor microbiota.
BugFACS of mouse fecal samples
The protocol used was similar to that described above for human fecal samples with several modifications. Fecal pellets were resuspended in PBS, vortexed, and a volume equivalent to 5 mg of fecal material was passed through a nylon 70 μm mesh filter. After washing with PBS, cells were incubated for 30 minutes on ice in the dark with a DyLight 650-conjugated polyclonal goat antibody directed against mouse IgA [Abcam; catalog number ab97014; diluted 1/50 in PBS/0.5% (wt/vol) bovine serum albumin]. On each day that BugFACS was performed, a positive control of pooled material from all mouse fecal samples analyzed on a given day and stained with anti-mouse IgA antibody was used to verify staining, while a negative control of the same pooled fecal material stained with the anti-human IgA antibody (conjugated to DyLight 650, see above) was used as an isotype control.
Statistics
Statistical analyses, RF modeling, generation of plots, OTU consolidation, and OTU table rarefaction were performed in the R programming environment (R version 3.1.1) or Prism 6.0. For presentations of data in which group means are compared, confidence in mean values is displayed as the standard error of the mean. Mann-Whitney U tests and Student’s t-tests were all 2-tailed. False discovery rate correction of P-values was performed with the Benjamini-Hochberg procedure. Indicator species analysis was performed with the ‘indicspecies’ package in R28. PERMANOVA tests were performed with the ‘vegan’ package in R29. For PERMANOVA of IgA indices, the matrix of Pearson product moment correlation coefficients was converted to a dissimilarity matrix with the formula Xdissimilarity = (1 − Xsimilarity)/2, where X represents a given sample-to-sample comparison. Two separate analyses were performed: in the first, only the effects of zygosity, delivery mode, age bin and twin pair were considered; a second analysis was performed on the subset of samples for which feeding data was available in order to evaluate the effects of milk feeding practices, with age bin and twin pair included as covariates. In both cases, 999 permutations were performed. Linear mixed effects modeling was performed with the ‘lmerTest’ package in R30. Sex, delivery mode, zygosity, and feeding predominance were tested as fixed effects, with age bin, twin pair, and the infant/child study ID treated as nested random effects. Similar results were obtained with either the Satterthwaite or Kenward-Roger approximation for denominator degrees of freedom.
Extended Data
Extended Data Figure 1. Method used for OTU consolidation.
a, OTU consolidation was performed to limit pseudoduplication of taxa. ‘Counts’ on the y-axis refer to the number of OTU-OTU correlations falling within a given range of Spearman correlation values shown on the x-axis (n=341,640 OTU-OTU comparisons; see Methods for details). b, A subset of the matrix used to derive the distribution shown in panel a illustrates how OTUs within a single family-level taxon are consolidated. In this example, three clusters composed of OTUs with Spearman correlation coefficients of > 0.7 are identified and the abundances of their constituent OTUs are summed. Each OTU cluster is assigned an identifier number with the prefix ‘C.’ and given a consensus taxonomic assignment (see Supplementary Table 5). Note that the OTUs used to generate a given ‘consolidated OTU’ shared 99.3±0.4% (mean±SD) nucleotide sequence identity in their V4-16S rRNA nucleotide sequences.
Extended Data Figure 2. Modeling development of the gut microbiota during the first 24 months of life in healthy twins.
a, To estimate the number of OTUs needed to maximize predictive accuracy, OTUs were iteratively added to a series of Random Forests models, starting with the OTU with the highest feature importance score and adding additional OTUs in order of decreasing feature importance. To evaluate performance of the model, members of the 40 twin cohort were randomly assigned to ‘Training’, ‘Co-twin of training’, and ‘Test’ sets (red, green and blue, respectively) 10 times, and the Spearman correlation coefficient and adjusted r2 of a linear model were calculated for a given model size (n=10 models for each data point, mean±SEM values are plotted). The dashed vertical line indicates performance of a 25 OTU model across the three different sets. b, Predicted age was calculated for all fecal microbiota samples with a sparse 25 OTU Random Forests-generated model. Chronologic versus model-predicted age is plotted for each of the three data subsets (n=1,477 fecal samples). The inset shows mean±SD values for predicted microbiota age of samples in each monthly age bin. c, Heatmap of mean abundances over the first 24 months of life for the 25 OTUs used to generate the sparse model. Samples are normalized by row, with hierarchical clustering (complete linkage; n=1,477 fecal samples).
Extended Data Figure 3. Similarity of fecal microbiota composition within and between twin pairs.
Similarity in composition of the fecal microbiota within and between twin pairs was analyzed with unweighted UniFrac distance calculated prior to OTU consolidation. Statistical significance was evaluated with the paired Wilcoxon test for twin-twin versus twin-unrelated comparisons. Mean values + SEM are plotted (n=205 paired comparisons). ***, P<0.001. The results indicate that the overall phylogenetic composition of the fecal microbiota is more similar in infants/children sharing a common living environment and genetic background than between unrelated individuals; this is apparent as early as the first month of life and does not change significantly over the ensuing 23 months.
Extended Data Figure 4. Feeding status and microbiota composition during the first year of life.
a, The proportion of all feedings on the day of fecal sampling that consisted of either formula or breast milk (n=746 observations). b, Microbiota age, defined by the sparse Random Forests-derived model, compared for participants that were predominantly breast fed (≥ 50% of milk feeding) or predominantly formula fed across different age bins. Mean values + SEM are plotted (n=681 fecal samples). *, P<0.05; **, P<0.01; ***, P<0.001 (Mann-Whitney U test). c, Aggregate percent relative abundance of age-discriminatory bifidobacteria included in the sparse Random Forests-derived model; differences in their representation in the fecal microbiota as a function of breast or formula feeding evaluated in each age bin are shown. Horizontal lines within each column represent the median values; the horizontal dashed line represents the lower limit of detection. *, P<0.05; **, P<0.01; ***, P<0.001 (Mann-Whitney U test comparing samples obtained from breast versus formula fed individuals; n=681 fecal samples).
Extended Data Figure 5. Further characterization of IgA responses to members of the microbiota in the USA twin cohort.
a. Evidence that IgA indices are independent of relative abundance. IgA indices for all OTUs are plotted against their relative abundance in the ‘input fraction’ for all infant/child, maternal, and gnotobiotic mouse fecal samples analyzed by BugFACS (n=22,713 comparisons). b, Mean IgA indices ± SEM for two OTUs whose IgA targeting varied significantly with age across all 80 individuals in the twin birth cohort (FDR-corrected Kruskal-Wallis test, P < 0.05). c, Variance of IgA indices as a function of age. A total of 26 OTUs were detected in at least two individuals in all of the age bins surveyed. The variance in their IgA indices was then calculated and the nonparametric repeated measures Friedman test was used to test for statistical significance (P<0.0001). Mean values + SEM are plotted.
Extended Data Figure 6. Specificity of targeting and temporal variation in the prevalence of IgA-targeted or nontargeted taxa.
Specificity values from the indicator species analysis were calculated across all time points for the 30 OTUs identified as consistently IgA-targeted or not targeted in Figure 1a. Prevalence of the taxa, defined as detection in either the IgA+ or IgA- fraction, was plotted alongside the percentage of samples in which a given taxon had a positive or negative IgA index (n=4,186 IgA index values analyzed). The results reveal a group of OTUs that increased in prevalence over the course of the first two years of postnatal life and had very high ‘specificity’ for either the IgA+ or IgA− fraction (i.e., across the population of fecal samples, the majority of 16S rRNA reads for a given OTU were detected in one of the two fractions). This group included R. torques OTU C.6 and C. nexile OTU 4436046 that were IgA targeted in the majority of twins (when they are detectable in their microbiota), as well as Ruminococcus sp. ce2 OTU C.39 which was IgA-negative in most of the children. A second group of OTUs becomes more prevalent with age but members had much weaker, albeit statistically significant, association with one or the other sorted fraction (e.g., R. gnavus OTU C.4 and B. vulgatus OTU C.15). A third group of OTUs was highly specific for a given sorted fraction but were only detected in a minority (≤20%) of children. This latter group included two strongly IgA-targeted OTUs assigned to A. muciniphila (OTU 588471 and OTU 4306262). Intriguingly, these two OTUs co-occurred just once among the 176 BugFACS samples in which A. muciniphila was detected (P<0.0001, chi-squared test).
Extended Data Figure 7. Effects of diet on gut mucosal IgA responses to members of the microbiota.
The analysis was constrained to those fecal samples where a diet history had been collected within 10 days of procuring the specimens (n=276). After FDR-correction with the Benjamini-Hochberg procedure, IgA targeting of two of the 30 taxa identified in Figure 1a varied significantly as a function of breast vs. formula feeding. Each circle represents results from a given fecal sample. Samples are color-coded based on the type of milk diet being consumed by the donor at the time of fecal sampling. Horizontal lines in each column represent mean values. *, P<0.05 (Mann-Whitney U test of the differences between breast and formula fed).
Extended Data Figure 8. Diet-dependent changes in composition of the fecal microbiota of gnotobiotic mice.
Indicator species analysis was used to identify taxa from the Random Forests-derived model of gut microbiota maturation whose abundances varied consistently by diet treatments (n=9999 permutations with ‘mouse’ as the grouping variable). The top 60 ranked OTUs in the model (based on their feature importance scores) were included in the analysis; those OTUs with statistically significant diet-dependent partitioning (P<0.05) after FDR correction and with an indicator value > 0.5 are shown, ranked from highest to lowest indicator value for infant formula-discriminatory (upper portion of figure) and ‘infant formula plus fruits and vegetables’- discriminatory (lower portion of figure) (see Supplementary Table 19 for results of the indicator species analysis). Mean values for relative abundances in the fecal microbiota at each time point are plotted ± SD.
Extended Data Figure 9. Similarity in IgA responses as a function of microbiota donor, twin pair and time after transplantation.
Pearson correlation coefficients were calculated with IgA index data from all fecal samples collected from gnotobiotic mice that had been analyzed by BugFACS. Mean values ± SD are shown for the indicated comparisons. ****, P<0.0001; **, P<0.01; *, P<0.05 (Kruskal-Wallis test with Dunn’s correction for multiple comparisons; n=5,029 total comparisons)
Supplementary Material
Acknowledgments
We thank David O’Donnell, Maria Karlsson, Justin Serugo, and Sabrina Wagoner for their help with gnotobiotic husbandry, Su Deng, Janaki Guruge, Jessica Hoisington-Lopez and Marty Meier for technical assistance, Gautam Dantas for help with maintaining our archive of de-identified human samples, and Nicholas Griffin for his comments regarding facets of the data analysis. This work was supported by grants from the National Institutes of Health (DK30292, DK052574), the Children’s Discovery Institute, the Bill & Melinda Gates Foundation, and the Crohn’s and Colitis Foundation of America. J.D.P. is a member of the Washington University Medical Scientist Training Program (NIH GM007200).
Footnotes
Author Contributions B.B.W., P.I.T., M.I. and G.D. designed, enrolled and collected specimens from participants in the twin study. J.D.P. performed BugFACS and 16S rRNA analyses on human fecal samples. J.D.P. and J.I.G. designed the gnotobiotic mouse experiments; J.D.P. and Y.P. performed these experiments. J.D.P., A.L.K., L.V.B., Y.P., and J.I.G. analyzed the data. J.D.P. and J.I.G. wrote the paper.
Data deposition 16S rRNA sequences in raw format prior to post-processing and data analysis have been deposited at the European Nucleotide Archive (ENA) under project PRJEB11697.
Competing financial interests
J.I.G. is co-founder of Matatu, Inc., a company characterizing the role of diet-by-microbiota interactions in animal health. The other authors declare that they have no competing interests.
Supplementary Information is linked to the online version of the paper at www.nature.com/nature.
References
- 1.Suzuki K, et al. Aberrant expansion of segmented filamentous bacteria in IgA-deficient gut. Proc Natl Acad Sci USA. 2004;101:1981–1986. doi: 10.1073/pnas.0307317101. [DOI] [PMC free article] [PubMed] [Google Scholar]
- 2.Johansen FE, et al. Absence of epithelial immunoglobulin A transport, with increased mucosal leakiness, in polymeric immunoglobulin receptor/secretory component-deficient mice. J Exp Med. 1999;190:915–922. doi: 10.1084/jem.190.7.915. [DOI] [PMC free article] [PubMed] [Google Scholar]
- 3.Peterson DA, McNulty NP, Guruge JL, Gordon JI. IgA Response to symbiotic bacteria as a mediator of gut homeostasis. Cell Host Microbe. 2007;2:328–339. doi: 10.1016/j.chom.2007.09.013. [DOI] [PubMed] [Google Scholar]
- 4.Bunker JJ, et al. Innate and adaptive humoral responses coat distinct commensal bacteria with immunoglobulin A. Immunity. 2015;43:541–553. doi: 10.1016/j.immuni.2015.08.007. [DOI] [PMC free article] [PubMed] [Google Scholar]
- 5.Macpherson AJ, et al. A primitive T cell-independent mechanism of intestinal mucosal IgA responses to commensal bacteria. Science. 2000;288:2222–2226. doi: 10.1126/science.288.5474.2222. [DOI] [PubMed] [Google Scholar]
- 6.Mathias A, Corthésy B. N-Glycans on secretory component: mediators of the interaction between secretory IgA and gram-positive commensals sustaining intestinal homeostasis. Gut Microbes. 2011;2:287–293. doi: 10.4161/gmic.2.5.18269. [DOI] [PubMed] [Google Scholar]
- 7.Palm NW, et al. Immunoglobulin A coating identifies colitogenic bacteria in inflammatory bowel disease. Cell. 2014;158:1000–1010. doi: 10.1016/j.cell.2014.08.006. [DOI] [PMC free article] [PubMed] [Google Scholar]
- 8.Kau AL, et al. Functional characterization of IgA-targeted bacterial taxa from undernourished Malawian children that produce diet-dependent enteropathy. Sci Transl Med. 2015;7:276r24. doi: 10.1126/scitranslmed.aaa4877. [DOI] [PMC free article] [PubMed] [Google Scholar]
- 9.Brandtzaeg P. The mucosal immune system and its integration with the mammary glands. J Pediatr. 2010;156:S8–15. doi: 10.1016/j.jpeds.2009.11.014. [DOI] [PubMed] [Google Scholar]
- 10.Gustafson CE, et al. Limited expression of APRIL and its receptors prior to intestinal IgA plasma cell development during human infancy. Mucosal Immunol. 2014;7:467–77. doi: 10.1038/mi.2013.64. [DOI] [PMC free article] [PubMed] [Google Scholar]
- 11.Rogosch T, et al. IgA response in preterm neonates shows little evidence of antigen-driven selection. J Immunol. 2012;189:5449–5456. doi: 10.4049/jimmunol.1103347. [DOI] [PMC free article] [PubMed] [Google Scholar]
- 12.Subramanian S, et al. Persistent gut microbiota immaturity in malnourished Bangladeshi children. Nature. 2014;510:417–421. doi: 10.1038/nature13421. [DOI] [PMC free article] [PubMed] [Google Scholar]
- 13.Blanton LV, et al. Gut bacteria that prevent growth impairments transmitted by microbiota from malnourished children. Science. 2016;351:aad3311. doi: 10.1126/science.aad3311. [DOI] [PMC free article] [PubMed] [Google Scholar]
- 14.Goodrich JK, et al. Human genetics shape the gut microbiome. Cell. 2014;159:789–799. doi: 10.1016/j.cell.2014.09.053. [DOI] [PMC free article] [PubMed] [Google Scholar]
- 15.Hansen EE, et al. Pan-genome of the dominant human gut-associated archaeon, Methanobrevibacter smithii, studied in twins. Proc Natl Acad Sci USA. 2011;108:4599–4606. doi: 10.1073/pnas.1000071108. [DOI] [PMC free article] [PubMed] [Google Scholar]
- 16.Dominguez-Bello MG, et al. Delivery mode shapes the acquisition and structure of the initial microbiota across multiple body habitats in newborns. Proc Natl Acad Sci USA. 2010;107:11971–11975. doi: 10.1073/pnas.1002601107. [DOI] [PMC free article] [PubMed] [Google Scholar]
- 17.Sela DA, Mills DA. The marriage of nutrigenomics with the microbiome: the case of infant-associated bifidobacteria and milk. Am J Clin Nutr. 2014;99:697S–703S. doi: 10.3945/ajcn.113.071795. [DOI] [PMC free article] [PubMed] [Google Scholar]
- 18.Dufrêne M, Legendre P. Species assemblages and indicator species: The need for a flexible asymmetrical approach. Ecological Monographs. 1999;67:345–366. [Google Scholar]
- 19.Siega-Riz AM, et al. Food consumption patterns of infants and toddlers: where are we now? J Am Diet Assoc. 2008;110:S38–51. doi: 10.1016/j.jada.2010.09.001. [DOI] [PubMed] [Google Scholar]
- 20.Rogier EW, Frantz AL, Bruno ME, Kaetzel CS. Secretory IgA is concentrated in the outer layer of the colonic mucus along with gut bacteria. Pathogens. 2014;3:390–403. doi: 10.3390/pathogens3020390. [DOI] [PMC free article] [PubMed] [Google Scholar]
- 21.Lyte M, Vulchanova L, Brown DR. Stress at the intestinal surface: Catecholamines and mucosa-bacteria interactions. Cell Tissue Res. 2011;343:23–32. doi: 10.1007/s00441-010-1050-0. [DOI] [PubMed] [Google Scholar]
- 22.Arrieta MC, et al. Early infancy microbial and metabolic alterations affect risk of childhood asthma. Sci Trans Med. 2015;7:307ra152. doi: 10.1126/scitranslmed.aab2271. [DOI] [PubMed] [Google Scholar]
- 23.Gilmartin AA, Petri WA. Exploring the role of environmental enteropathy in malnutrition, infant development and oral vaccine response. Phil Trans R Soc Lond B Biol Sci. 2015;370 doi: 10.1098/rstb.2014.0143. pii: 20140143. [DOI] [PMC free article] [PubMed] [Google Scholar]
- 24.Faith JJ, Ahern PP, Ridaura VK, Cheng J, Gordon JI. Identifying gut microbe-host phenotype relationships using combinatorial communities in gnotobiotic mice. Sci Trans Med. 2014;6:220ra11. doi: 10.1126/scitranslmed.3008051. [DOI] [PMC free article] [PubMed] [Google Scholar]
- 25.Rideout JR, et al. Subsampled open-reference clustering creates consistent, comprehensive OTU definitions and scales to billions of sequences. PeerJ. 2014;2:e545. doi: 10.7717/peerj.545. [DOI] [PMC free article] [PubMed] [Google Scholar]
- 26.Caporaso JG, et al. Global patterns of 16S rRNA diversity at a depth of millions of sequences per sample. Proc Natl Acad Sci USA. 2011;108:4516–4522. doi: 10.1073/pnas.1000080107. [DOI] [PMC free article] [PubMed] [Google Scholar]
- 27.Liaw A, Weiner M. Classification and regression by randomForest. R package version 4.6-10 R News. 2002;2:18–22. [Google Scholar]
- 28.De Caceres M, Legendre P. Associations between species and groups of sites: indices and statistical inference. Ecology. 2009 doi: 10.1890/08-1823.1. http://sites.google.com/site/miqueldecaceres/ [DOI] [PubMed]
- 29.Oksanen J, et al. vegan: Community Ecology Package. R package version 2.2-0. 2014 http://CRAN.R-project.org/package=vegan.
- 30.Kuznetsova A, Brockhoff PB, Christensen RHB. lmerTest: tests for random and fixed effects for linear mixed effect models (lmer objects of lme4 package) 2013 http://CRAN.R-project.org/package5lmerTest.
Associated Data
This section collects any data citations, data availability statements, or supplementary materials included in this article.


