Abstract
Myopia is rapidly increasing in young populations and patients with glaucoma associated with myopia are reported to be young aged in East Asia. These young patients have a longer life expectancy, which increases their risk of end-of-life visual disabilities. There is a need to understand the clinical course of myopic glaucoma patients, which may be important for the care of these myopic populations. In this study, we evaluated the relationship between the age at presentation and the rate of glaucoma progression in the visual field (VF) according to the presence of myopia. The study was conducted as a prospective observational study including 179 patients with open-angle glaucoma who had undergone at least 5 VF examinations with a follow-up of at least 5 years. The progression rate of the mean deviation (MD) and the pattern standard deviation (PSD) are expressed as change in decibels (dB) per year. The slopes of the MD and PSD were calculated by linear regression analyses. Factors related to the slope of VF MD changes were analyzed with correlation and regression analyses. The slope of the linear fit line plotted against age at presentation and the rate of change in the VF MD was −0.026 (P < 0.001) in the myopic group and −0.008 (P = 0.167) in the nonmyopic group; the relationship was more prominent in the myopic group than the nonmyopic group. In the myopic group, age (β = −0.417; 95% confidence intervals (CI), −0.651 to −0.200; P = 0.050) and baseline untreated intraocular pressure (β = −0.179; 95% CI, −0.331 to −0.028; P = 0.022) were significantly related to the rate of change in the MD, which was only the presence of disc hemorrhage (β = −0.335; 95% CI, −0.568 to −0.018; P = 0.022) in the nonmyopic group. Age at presentation was significantly related to the rate of change in the VF in glaucomatous eyes with myopia compared to eyes without myopia. Older age was significantly related to the rate of change in the VF only in myopic glaucomatous eyes.
INTRODUCTION
Myopia, particularly high myopia, is a well-known risk factor for glaucoma.1–4 A recent meta-analysis from 11 population-based studies reported a pooled odds ratio of 2.46 for high myopia and 1.77 for low myopia, with a cutoff value of −3.0 diopters (D).5 However, the role of myopia in glaucoma progression is controversial. Many studies have proposed that myopia and high myopia are risk factors for glaucoma progression.6–9 In the Advanced Glaucoma Intervention Study, myopic eyes with > −4.0 D tended to progress faster.10 However, other studies have reported that myopia does not contribute to the progression of glaucoma and may act as a protective factor for glaucoma progression.11–14
The frequencies of myopia and high myopia are rapidly increasing in young populations.15 In East Asia, myopic glaucoma patients are significantly younger than nonmyoic glaucoma patients.16 These young patients have a longer life expectancy, which increases their risk of end-of-life visual disabilities. Older age is an important clinical risk factor for glaucoma prevalence17,18 and is positively correlated with a faster progression of glaucoma.19–21 Understanding the clinical course of myopic glaucoma patients according to age may be important to care these myopic populations.
In the present study, we analyzed the visual field (VF) progression of glaucoma according to baseline age, and the comparison was performed between myopic and nonmyopic groups. Additionally, related factors to glaucoma progression and the difference between myopic and nonmyopic groups were evaluated.
METHODS
Subjects
This study was based on the Glaucoma Progression Study at Seoul St. Mary's Hospital, an ongoing study that has been conducted since March 2009. The study was approved by the Institutional Review Board of Seoul St. Mary's Hospital, Seoul, South Korea, and followed the tenets of the Declaration of Helsinki. Written informed consent was obtained from consecutive patients who met the eligibility criteria and were willing to participate in the study.
The database of patients included in the above-mentioned study was reviewed. Patients who had undergone at least 5 VF examinations with follow-up for at least 5 years were selected. Each participant underwent a comprehensive ophthalmic assessment, including detailed glaucoma evaluation. This included measurement of best-corrected visual acuity, refraction, central corneal thickness, axial length measurement, slit-lamp biomicroscopy, gonioscopy, Goldmann applanation tonometry, dilated stereoscopic examination, color disc and red-free retinal nerve fiber layer (RNFL) photography (Canon, Tokyo, Japan), Humphrey VF examination (24–2 Swedish Interactive Threshold Algorithm Standard program; Carl Zeiss Meditec), and Cirrus optical coherence tomography (OCT) (Carl Zeiss Meditec). Cataracts were graded using the LOCS III grading system at each visit.22
For a glaucoma diagnosis, patients had to fulfill the following criteria: glaucomatous optic disc appearances (such as diffuse or localized rim thinning, a notch in the rim, or a vertical cup-to-disc ratio higher than that of the other eye by > 0.2), VF consistent with glaucoma (a cluster of ≥3 non-edge points on pattern deviation plot with a probability of < 5% of the normal population, with one of these points having the probability of < 1%, a pattern standard deviation with P < 5%, or a Glaucoma Hemifield Test result outside the normal limits in a consistent pattern on 2 qualifying VFs), confirmed by 2 glaucoma specialists (HYP and CKP), and an open angle on gonioscopy.
Patients were required to meet the following inclusion criteria: a best-corrected visual acuity of ≥20/40, mean deviation (MD) better than −12.00 decibels (dB), and consistently reliable VFs (defined as a false-negative rate of <15%, a false positive rate of <15%, and fixation losses of <20%). Patients were excluded on the basis of any of the following criteria: an axial length >30 mm; a cataract with LOCS III grade higher than grade 3 at any visit; a history of any retinal disease, including diabetic or hypertensive retinopathy or other retinal complications that accompany myopia; a history of eye trauma or surgery, including cataract surgery during the follow-up period; a glaucoma incisional surgery or laser procedure; another optic nerve disease besides glaucoma; a history of systemic or neurological diseases that might affect the VF; and progression of cataract defined as an increase in LOCS grading by >1 scale. If both eyes were eligible, 1 eye was randomly selected from each patient that met the inclusion and exclusion criteria.
Patients were classified into 2 groups according to axial length. Eyes with axial length < 24.0 mm were classified as nonmyopic and eyes with axial length ≥24.0 mm were classified as myopic.
Analysis of Change in the VF
VF testing was performed with optical correction using either trial lenses or disposable hydrophilic contact lenses in eyes with myopia. Only reliable VF test results were included in the analyses. The MD and pattern standard deviation (PSD) progression rate were expressed as change in dB per year. The slopes of the MD and PSD change were calculated by linear regression analyses. We excluded fields that showed an apparent progression because of retinal or neurological pathologies.
Statistical Analyses
An independent t-test was used to compare differences between groups. The chi-square test was used where appropriate to compare frequencies. The relationship between age at presentation and the rate of change in the VF was assessed by scatter plots and graphically fitting a linear function. Linear regression analyses were used to evaluate the influence of several factors on the rate of change in the VF, such as age, axial length, central corneal thickness, baseline untreated intraocular pressure (IOP), mean IOP during the follow-up period, baseline MD, baseline PSD, baseline average RNFL thickness, and the presence of disc hemorrhage. P values <0.05 was considered statistically significant. Variables with a significance of P < 0.20 were included in the multivariate regression analyses. Statistical analyses were performed using the SPSS statistical package (SPSS, Chicago, IL).
RESULTS
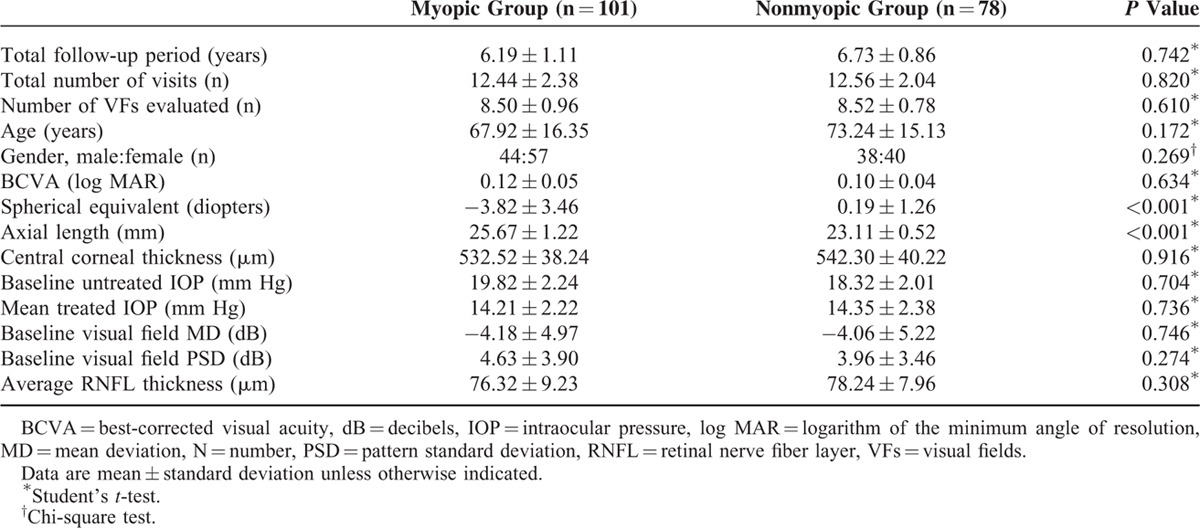
A total of 101 eyes with myopia and 78 eyes without myopia that met the inclusion and exclusion criteria were analyzed. Baseline characteristics, except for spherical equivalent and axial length, were similar between groups, as shown in Table 1. The total follow-up period and the number of VFs evaluated were similar between groups.
TABLE 1.
Baseline Demographics of Glaucoma Patients With and Without Myopia Classified as an Axial Length of 24.0 mm
The mean rate of MD change was −0.41 ± 1.20 dB/year in the nonmyopic group and −0.18 ± 1.55 dB/year in the myopic group, which did not show statistical difference (P = 0.336). The mean rate of PSD change was 0.92 ± 1.37 dB/year in the nonmyopic group and 0.71 ± 1.39 dB/year in the myopic group, which did not show statistical difference (P = 0.354). According to subgroup analyses, the rates of MD change for the age groups 40 to 60, 60 to 80, and >80 were −0.07 ± 1.71 dB/year, −0.05 ± 0.93 dB/year, and −0.49 ± 1.77 dB/year, respectively, in the myopic group. The respective values were −0.24 ± 0.14 dB/year, −0.38 ± 0.93 dB/year, and −0.52 ± 1.42 dB/year in the nonmyopic group. Figure 1 shows a scatter plot of the rates of change in the MD and PSD as a function of axial length. The slope of the linear fit line was positive for MD change and axial length and negative for PSD change and axial length.
FIGURE 1.
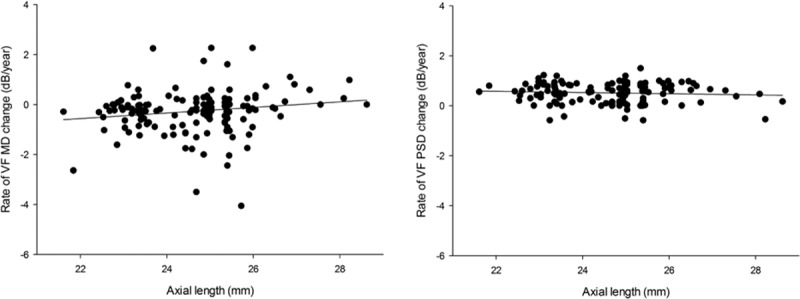
Scatter plot showing the relationships between the rate of change in visual field parameters (mean deviation [MD] and pattern standard deviation [PSD]) and axial length. MD = mean deviation, PSD = pattern standard deviation.
The relationship between age and the rates of change in MD and PSD is shown in Figure 2. The slope of the linear fit line was negative for MD but positive for PSD against age. These relationships were more prominent in the myopic group than in the nonmyopic group. The negative slope for MD and age was −0.026 (P < 0.001) in the myopic group and −0.008 (P = 0.167) in the nonmyopic group. The positive slope for PSD and age was 0.013 (P < 0.001) in the myopic group and 0.002 (P = 0.487) in the nonmyopic group.
FIGURE 2.
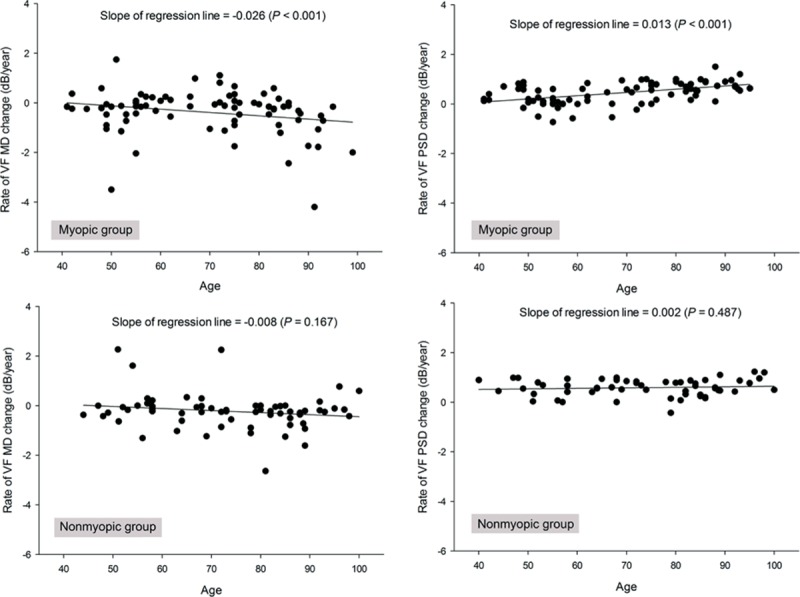
Scatter plot showing the relationships between the rate of visual field parameters (mean deviation [MD] and pattern standard deviation [PSD]) and age in myopic and nonmyopic groups classified by axial length of 24.0 mm. MD = mean deviation, PSD = pattern standard deviation.
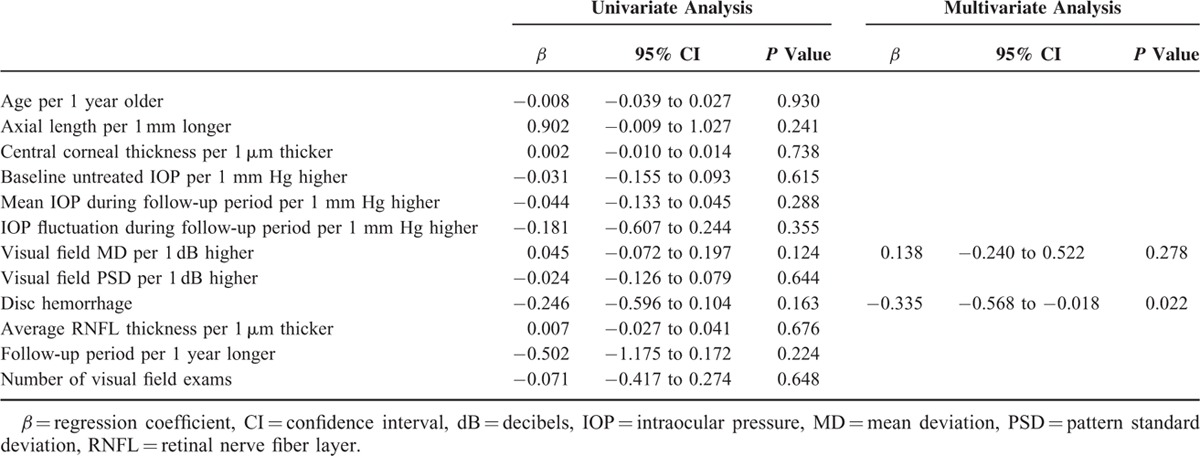
Parameters related to the rate of MD change were evaluated by regression analyses. For the entire group, the presence of disc hemorrhage (β = −0.231; 95% confidence intervals (CI), −0.373 to −0.089; P = 0.026) was the only related parameter (Table 2). In the myopic group, age (β = −0.417; 95% CI, −0.651 to −0.200; P = 0.050) and baseline untreated IOP during the follow-up period (β = −0.179; 95% CI, −0.331 to −0.028; P = 0.022) were significantly related to the rate of MD change, based on multivariate analyses (Table 3). In the nonmyopic group, only disc hemorrhage (β = −0.335; 95% CI, −0.568 to −0.018; P = 0.022) was related to the rate of MD change in the multivariate analysis (Table 4).
TABLE 2.
Factors Associated With the Rate of Visual Field Mean Deviation Slope in all Glaucoma Patients
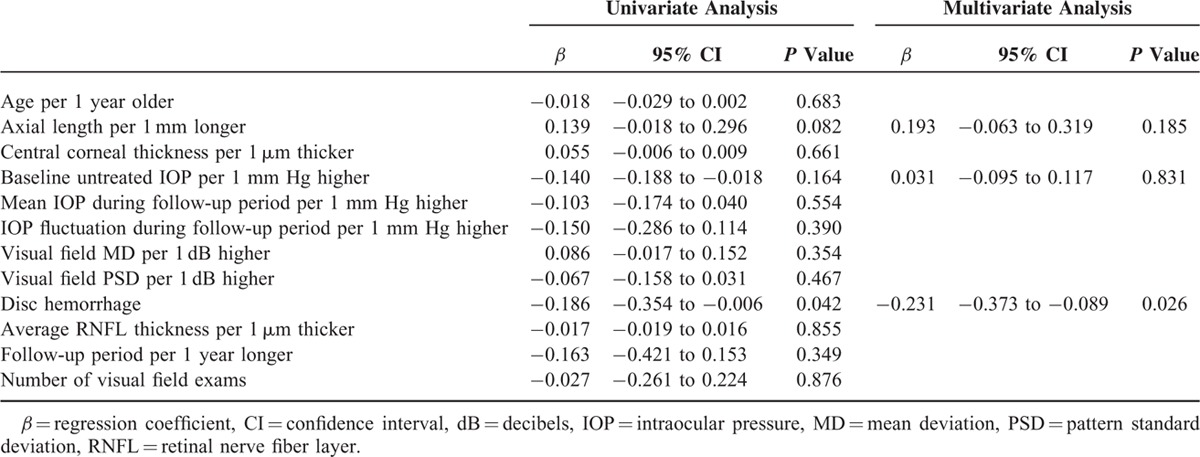
TABLE 3.
Factors Associated With the Rate of Visual Field Mean Deviation Slope in Glaucoma Patients With Myopia Defined as an Axial Length ≥24.0 mm
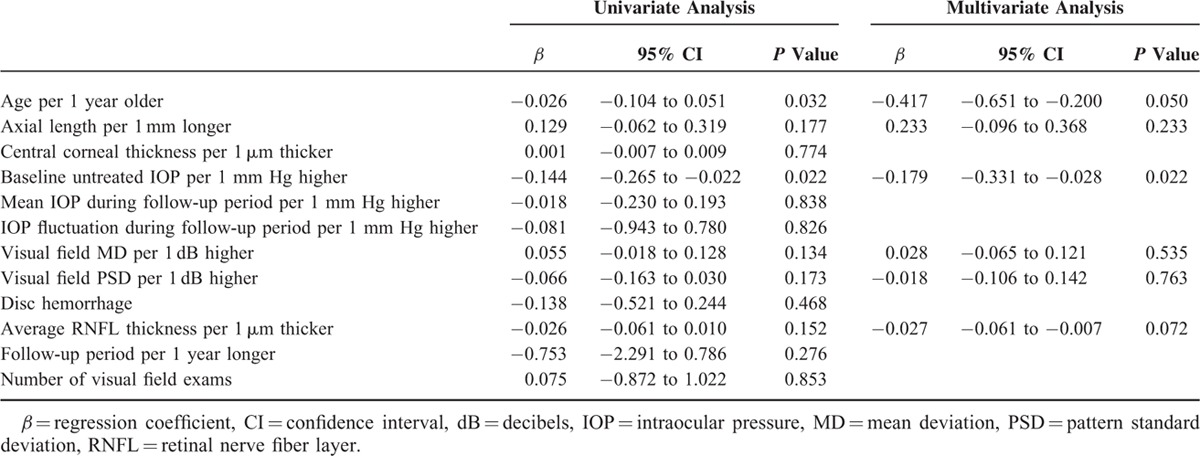
TABLE 4.
Factors Associated With the Rate of Visual Field Mean Deviation Slope in Glaucoma Patients Without Myopia Defined as an Axial Length <24.0 mm
DISCUSSION
Age at presentation was significantly related to the rates of change in MD and PSD in glaucomatous eyes with myopia, and patients with older age at presentation progressed faster which was greater in myopic eyes than in nonmyopic eyes. Regarding the relationship between the rate of change in the VF and axial length (Figure 1), the rate of change decreased as axial length increased. Previous studies have reported that glaucoma in both myopic and high myopic glaucoma patients do not progress, and that might even be protective against glaucoma progression, which was also for high myopic glaucomatous eyes.9,11,14 However, all of these studies involved relatively young subjects (mean age 40–60 years) and follow-up periods of ∼4 to 7 years. In additions, none of these studies characterized the progression rate according to age in myopic glaucomatous eyes. As shown in Figure 2, myopic eyes tended to progress faster according to age at diagnosis compared to nonmyopic eyes. This means that myopic glaucomatous eyes tend to progress faster at an older age than nonmyopic eyes, implying that glaucoma in young myopic glaucoma patients may progress faster in their later life.
Many studies have reported that increasing age is associated with the rate of progression.23–26 Many clinical trials, including the Early Manifest Glaucoma Trial, the Advanced Glaucoma Intervention Study, and the Collaborative Initial Glaucoma Treatment Study, have also reported that older age is a significant clinical predictor for glaucoma progression. The estimated average rate of change in the VF, defined as the MD rate, has reported MD rates of 0 to −1.1 dB/year in glaucoma patients. For glaucoma patients undergoing routine care, mean MD rates of −0.35 to −0.62 dB/year have been reported after adjusting for age. In our study, the mean rate of MD change was −0.41 ± 1.20 dB/year in the nonmyopic group and −0.18 ± 1.55 dB/year in the myopic group, indicating that the myopic group had a slower MD rate. This rate is also slower than those reported in previous studies. However, the mean rate of changes was −0.49 ± 1.77 dB/year in the myopic group in the >80 years age group showing a distinct increase in the MD change rate in this age group.
Loss of retinal ganglion cells is part of the normal aging process, which causes reduced visual sensitivity across the VF and thinning of the RNFL.27,28 The MD is an adjusted value according to age, because it compares the sensitivity of the VF of patients in similar age-matched groups at each location of the VF. However, changes in MD values have been consistently reported to be associated with older age. The reason for this is not well understood; however, it is possible that aging affects neuronal function, making older patients more vulnerable to glaucomatous changes. Alternatively, older patients may have a smaller neuronal reserve, allowing progressive changes to be detected earlier.29–31 Myopic changes in older patients increase their vulnerability to glaucoma. Myopic changes are usually stable after aldolescence; however, they can impact glaucoma throughout life. Myopic eyes have myopic changes in the posterior pole during eyeball elongation. We hypothesize that this may stretch and deform the axons of the retinal ganglion cells, resulting in changes in neuronal function, making eyes more vulnerable to additional insults.32 In addition, myopic changes may result in weakness of the supporting tissues around the optic nerve head. Furthermore, peripapillary atrophy could result in structural weakness of the supporting tissues of the optic nerve head, and thinning of the choriocapillaris and choroidal vessels may disturb the blood supply to the optic disc.33,34
We characterized the risk factors related to the rate of change in the MD in myopic and nonmyopic groups separately, with the assumption that the characteristics of glaucoma may differ. Other than age, few related factors have been differentially associated with the rate of change in the MD between myopic and nonmyopic glaucomatous eyes. Higher baseline untreated IOP was related to the rate of MD change in myopic eyes, whereas the presence of disc hemorrhage was related to it in nonmyopic eyes. Many studies have reported that disc hemorrhage is a risk factor for glaucoma progression.35,36 IOP has also been reported as a risk factor for glaucoma progression.25,37 However, whether the difference in significant risk factors for progression between myopic and nonmyopic eyes has important clinical implications will need further investigation.
Our study had several limitations. First, only modest sample size were included in this study and this means small effects of different variables could have not been fully apparent in the present analysis. Second, only glaucoma patients from a single ethnic group were included. Thus, these results may not be applicable to all patients with glaucoma. Third, the follow-up period was relatively short. Further investigation is needed to determine the long-term influence of age on glaucoma progression in eyes with myopia. Fourth, statistically multiple testing was not considered in the analysis. Fifth, cataract formation in the older age group may have affected the results. Cataract is a well-known factor that decreases VF sensitivities.38 However, its development may not differ between myopic and nonmyopic eyes, and comparisons between these eyes may have only minimal influence. In addition, cataract has minimal effects on the fast component of the VF rate and on the deepest part of the scotoma where progression usually occurs.39,40 To minimize the effect of cataracts, we excluded patients with a LOCS III grade higher than 3 at all visits, as well as patients who underwent cataract surgery during the follow-up period. Finally, we only included patients with typical VF defects located in the Bjerrum area in myopic eyes. Myopic eyes present with variety of stationary VF defects and sometime difficult to be differentiated with glaucomatous VF damage and there are possibilities of misclassification. We excluded all temporal field loss or others not in the Bjerrum area, which did not seem to be typical for glaucoma. Also, myopic eyes with retinal lesions were excluded with the assistance of retinal specialists.
In conclusion, age at presentation was significantly related to the rate of change in the VF in glaucomatous eyes with myopia but not in eyes without myopia. Older age and baseline untreated IOP were significant factors related to the rate of VF change in myopic glaucomatous eyes. When managing myopic glaucoma patients, it is important to consider that glaucoma in these patients may progress faster in their later life.
Footnotes
Abbreviations: IOP = intraocular pressure, MD = mean deviation, OCT = optical coherence tomography, PSD = pattern standard deviation, RNFL = retinal nerve fiber layer, VF = visual field.
Funding: this work was supported by the National Research Foundation of Korea (NRF) grant, funded by the Korean government (MSIP; No.NRF-2014R1A1A3049403).
The authors have no conflicts of interest to disclose.
Study approval: for the prospective component, ethical approval was obtained from the Institutional Review Board of Seoul St. Mary's Hospital, Seoul, South Korea. The study was conducted according to the principles set out in the Declaration of Helsinki. Written informed consent was obtained from all prospective patients before inclusion in the study, which was conducted according to the tenets of the Declaration of Helsinki.
REFERENCES
- 1.Mitchell P, Hourihan F, Sandbach J, et al. The relationship between glaucoma and myopia: the Blue Mountains Eye Study. Ophthalmology 1999; 106:2010–2015. [DOI] [PubMed] [Google Scholar]
- 2.Xu L, Wang Y, Wang S, et al. High myopia and glaucoma susceptibility the Beijing Eye Study. Ophthalmology 2007; 114:216–220. [DOI] [PubMed] [Google Scholar]
- 3.Wong TY, Klein BE, Klein R, et al. Refractive errors, intraocular pressure, and glaucoma in a white population. Ophthalmology 2003; 110:211–217. [DOI] [PubMed] [Google Scholar]
- 4.Shen L, Melles RB, Metlapally R, et al. The association of refractive error with glaucoma in a multiethnic population. Ophthalmology 2016; 123:92–101. [DOI] [PMC free article] [PubMed] [Google Scholar]
- 5.Marcus MW, Vries MM, Montolio FG, et al. Myopia as a risk factor for open-angle glaucoma: a systemic review and meta-analysis. Ophthalmology 2011; in press. [DOI] [PubMed] [Google Scholar]
- 6.Chihara E, Liu X, Dong J, et al. Severe myopia as a risk factor for progressive visual field loss in primary open-angle glaucoma. Ophthalmologica 1997; 211:66–71. [DOI] [PubMed] [Google Scholar]
- 7.Perdicchi A, Iester M, Scuderi G, et al. Visual field damage and progression in glaucomatous myopic eyes. Eur J Ophthalmol 2007; 17:534–537. [DOI] [PubMed] [Google Scholar]
- 8.Lee YA, Shih YF, Lin LL, et al. Association between high myopia and progression of visual field loss in primary open-angle glaucoma. J Formos Med Assoc 2008; 107:952–957. [DOI] [PubMed] [Google Scholar]
- 9.Sakata R, Aihara M, Murata H, et al. Contributing factors for progression of visual field loss in normal-tension glaucoma patients with medical treatment. J Glaucoma 2013; 22:250–254. [DOI] [PubMed] [Google Scholar]
- 10.VanVeldhuisen P, Ederer F, Gaasterland DE, et al. The AGIS Investigators. The advanced glaucoma intervention study (AGIS): 7. the relationship between control of intraocular pressure and visual field deterioration. Am J Ophthalmol 2000; 130:429–440. [DOI] [PubMed] [Google Scholar]
- 11.Doshi A, Kreidl KO, Lombardi L, et al. Nonprogressive glaucomatous cupping and visual field abnormalities in young Chinese males. Ophthalmology 2007; 114:472–479. [DOI] [PubMed] [Google Scholar]
- 12.Sohn SW, Song JS, Kee C. Influence of the extent of myopia on the progression of normal-tension glaucoma. Am J Ophthalmol 2010; 149:831–838. [DOI] [PubMed] [Google Scholar]
- 13.Araie M, Shirato S, Yamazaki Y, et al. Risk factors for progression of normal-tension glaucoma under beta-blocker monotherapy. Acta Ophthalmol 2012; 90:e337–e343. [DOI] [PubMed] [Google Scholar]
- 14.Lee JY, Sung KR, Han S, et al. Effect of myopia on the progression of primary open-angle glaucoma. Invest Ophthalmol Vis Sci 2015; 56:1775–1781. [DOI] [PubMed] [Google Scholar]
- 15.Kim EC, Morgan IG, Kakizaki H, et al. Prevalence and risk factors for refractive errors: Korean National Health and Nutrition Examination Survey 2008–2011. PLoS One 2013; 8:e80361. [DOI] [PMC free article] [PubMed] [Google Scholar]
- 16.Park HY, Lee K, Park CK. Optic disc torsion direction predicts the location of glaucomatous damage in normal-tension glaucoma patients with myopia. Ophthalmology 2012; 119:1844–1851. [DOI] [PubMed] [Google Scholar]
- 17.Leske MC, Connell AM, Schachat AP, et al. The Barbados Eye Study. Prevalence of open angle glaucoma. Arch Ophthalmol 1994; 112:821–829. [DOI] [PubMed] [Google Scholar]
- 18.Wensor MD, McCarty CA, Stanislavsky YL, et al. The prevalence of glaucoma in the Melbourne Visual Impairment Project. Ophthalmology 1998; 105:733–739. [DOI] [PubMed] [Google Scholar]
- 19.Ernest PJ, Schouten JS, Beckers HJ, et al. An evidence-based review of prognostic factors for glaucomatous visual field progression. Ophthalmology 2013; 120:512–519. [DOI] [PubMed] [Google Scholar]
- 20.Rossetti L, Digiuni M, Giovanni M, et al. Blindness and glaucoma: a multicenter data review from 7 academic eye clinics. PLoS One 2015; 10:e0136632. [DOI] [PMC free article] [PubMed] [Google Scholar]
- 21.Prata TS, De Moraes CG, Teng CC, et al. Factors affecting rates of visual field progression in glaucoma patients with optic disc hemorrhage. Ophthalmology 2010; 117:24–29. [DOI] [PubMed] [Google Scholar]
- 22.Chylack LT, Jr, Wolfe JK, Singer DM, et al. The lens opacities classification system III. The longitudinal study of Cataract Study Group. Arch Ophthalmol 1993; 111:831–836. [DOI] [PubMed] [Google Scholar]
- 23.Nouri-Mahdavi K, Hoffman D, Coleman AL, et al. Predictive factors for glaucomatous visual field progression in the Advanced Glaucoma Intervention Study. Ophthalmology 2004; 111:1627–1635. [DOI] [PubMed] [Google Scholar]
- 24.Leske MC, Heijl A, Hussein M, et al. Factors for glaucoma progression and the effect of treatment: the early manifest glaucoma trial. Arch Ophthalmol 2003; 121:48–56. [DOI] [PubMed] [Google Scholar]
- 25.Leske MC, Heijl A, Hyman L, et al. Predictors of long-term progression in the early manifest glaucoma trial. Ophthalmology 2007; 114:1965–1972. [DOI] [PubMed] [Google Scholar]
- 26.Stewart WC, Kolker AE, Sharpe ED, et al. Factors associated with long-term progression or stability in primary open-angle glaucoma. Am J Ophthalmol 2000; 130:274–279. [DOI] [PubMed] [Google Scholar]
- 27.Heijl A, Lindgren G, Olsson J. Perimetric threshold variability and age. Arch Ophthalmol 1988; 106:450–452. [DOI] [PubMed] [Google Scholar]
- 28.Gardiner SK, Johnson CA, Spry PG. Normal age-related sensitivity loss for a variety of visual functions throughout the visual field. Optom Vis Sci 2006; 83:438–443. [DOI] [PubMed] [Google Scholar]
- 29.Harwerth RS, Wheat JL, Rangaswamy NV. Age-related losses of retinal ganglion cells and axons. Invest Ophthalmol Vis Sci 2008; 49:4437–4443. [DOI] [PubMed] [Google Scholar]
- 30.Szabadfi K, Estrada C, Fernandez-Villalba E, et al. Retinal aging in the diurnal Chilean rodent (Octodon degus): histological, ultrastructural and neurochemical alterations of the vertical information processing pathway. Front Cell Neurosci 2015; 9:126. [DOI] [PMC free article] [PubMed] [Google Scholar]
- 31.Tan C, Hu T, Peng MC, et al. Age of rats seriously affects the degree of retinal damage induced by acute high intraocular pressure. Curr Eye Res 2015; 40:300–306. [DOI] [PubMed] [Google Scholar]
- 32.Ohno-Matsui K, Shimada N, Yasuzumi K, et al. Long-term development of significant visual field defects in highly myopic eyes. Am J Ophthalmol 2011; 152:256–265.e1. [DOI] [PubMed] [Google Scholar]
- 33.Jonas JB, Nguyen XN, Gusek GC, et al. Parapapillary chorioretinal atrophy in normal and glaucoma eyes. I. Morphometric data. Invest Ophthalmol Vis Sci 1989; 30:908–918. [PubMed] [Google Scholar]
- 34.Hayreh SS. Blood supply of the optic nerve head and its role in optic atrophy, glaucoma, and oedema of the optic disc. Br J Ophthalmol 1969; 53:721–748. [DOI] [PMC free article] [PubMed] [Google Scholar]
- 35.Heijl A, Leske MC, Bengtsson B, et al. Reduction of intraocular pressure and glaucoma progression: results from the Early Manifest Glaucoma Trial. Arch Ophthalmol 2002; 120:1268–1279. [DOI] [PubMed] [Google Scholar]
- 36.Drance S, Anderson DR, Schulzer M. Risk factors for progression of visual field abnormalities in normal-tension glaucoma. Am J Ophthalmol 2001; 131:699–708. [DOI] [PubMed] [Google Scholar]
- 37.Bengtsson B, Heijl A. A long-term prospective study of risk factors for glaucomatous visual field loss in patients with ocular hypertension. J Glaucoma 2005; 14:135–138. [DOI] [PubMed] [Google Scholar]
- 38.Budenz DL, Feuer WJ, Anderson DR. The effect of simulated cataract on the glaucomatous visual field. Ophthalmology 1993; 100:511–517. [DOI] [PubMed] [Google Scholar]
- 39.Lee JW, Morales E, Yu F, et al. Effect of cataract extraction on the visual field decay rate in patients with glaucoma. JAMA Ophthalmol 2014; 132:1296–1302. [DOI] [PubMed] [Google Scholar]
- 40.Koucheki B, Nouri-Mahdavi K, Patel G, et al. Visual field changes after cataract extraction: the AGIS experience. Am J Ophthalmol 2004; 138:1022–1028. [DOI] [PubMed] [Google Scholar]


