Abstract
Health-related quality of life (HRQOL) is an important clinical outcome for dialysis patients. However, relative superiority in HRQOL between automated peritoneal dialysis (APD) and continuous ambulatory peritoneal dialysis (CAPD) are not clearly known. We compared HRQOL over time between APD and CAPD patients and evaluated factors associated with HRQOL.
All 260 incident patients initiating APD or CAPD at multiple centers throughout Korea were prospectively enrolled in this study between October 2010 and February 2013. HRQOL, depressive symptoms, and renal treatment satisfaction were assessed 1 and 12 months after the start of dialysis by the Kidney Disease Quality of Life Short Form 36 (KDQOL-36), the Beck Depression Inventory (BDI), and the Renal Treatment Satisfaction Questionnaire (RTSQ), respectively.
Of 196 patients who completed all questionnaires and did not change the peritoneal dialysis (PD) modality during the 1-year follow-up period, 160 were matched. APD patients showed better baseline HRQOL than CAPD patients for the symptoms, patient satisfaction, pain, and social function domains. There were no differences in HRQOL between the 2 groups at 12 months, and CAPD patients had significantly greater improvements in symptoms (P = 0.02), the mental composite summary (P = 0.03), and health status domains (P = 0.03) than APD patients. There were similar improvements in depressive symptoms (P = 0.01) and patient satisfaction with treatment (P = 0.01) in CAPD and APD patients. Interestingly, depressive symptoms, not PD modality, was the most influential and consistent factor for HRQOL. Despite the spontaneous improvement of depressive symptoms, considerable PD patients still had depressive symptoms at the 1-year appointment.
APD has no advantage over CAPD for HRQOL. Considering the substantial negative effect of depressive symptoms on HRQOL, it is important to evaluate PD patients for depression and to treat those with depression to improve their HRQOL.
INTRODUCTION
Although technical advances in dialysis treatment have improved survival, patients with end-stage renal disease (ESRD) still have markedly impaired health-related quality of life (HRQOL) compared with the general population1 and a large proportion of dialysis patients experience depression.2 In addition, impaired HRQOL and depression are associated with mortality in dialysis patients.3,4 Therefore, it is important to take HRQOL and psychological issues into consideration when treating patients with ESRD.
HRQOL encompasses the physical, psychological, and social domains of health and can be interpreted in diverse ways according to the subjective perception of each patient, and a variety of factors can influence HRQOL.5 The variables associated with the HRQOL of dialysis patients include age,6,7 sex,6,7 race,8 comorbidities,7 anemia,9 nutrition,6 social factors,7 lower residual renal function,10 prior transplant failure,7,11 physical exercise,12 depression,13–15 and dialysis modality.1,16–20
In general, HRQOL differs according to the type of renal replacement therapy. Many studies have investigated differences in HRQOL across renal replacement therapy modalities, but few have compared HRQOL between automated peritoneal dialysis (APD) and continuous ambulatory peritoneal dialysis (CAPD) patients. APD has been expected to ensure better HRQOL compared to CAPD because APD assists patients with peritoneal dialysis (PD) exchanges during the nighttime and is more convenient for patients with less or no exchange during the daytime. However, there is no consensus about whether HRQOL is better for 1 of these 2 PD modalities.1,17–19 More insight into HRQOL of patients undergoing APD or CAPD is required to provide advice to patients selecting PD modality as well as to offer appropriate treatment according to PD modality.
We performed a prospective nationwide multicenter study in incident patients starting APD or CAPD to compare HRQOL, depressive symptoms, and satisfaction with renal treatment over time and to evaluate the association between patient variables and HRQOL assessment outcomes.
MATERIALS AND METHODS
Study Design and Participants
The comparison of quality of life on APD and CAPD (EQILPS) study was a prospective multicenter study of incident patients starting APD or CAPD at 11 centers in Korea that compared HRQOL, depressive symptoms, and renal treatment satisfaction over time according to PD modality (NCT01209273).
Between October 2010 and February 2013, we enrolled consecutive incident patients with ESRD who were receiving either APD or CAPD, and who were aged 20 years and above. Exclusion criteria were abdominal surgery within the last 30 days, any major medical event in the previous 3 months, malignancy, psychiatric illness and pregnancy or lactation. The patient's preference was the crucial determinant for the initial PD modality. All patients provided written informed consent before inclusion, and the Institutional Review Board of Kyungpook National University Hospital approved the study protocol. All clinical investigations were conducted in accordance with the guidelines of the 2008 Declaration of Helsinki.
Data Collection, Follow-Up, and Outcome Determination
We obtained baseline sociodemographic information, as well as clinical and biochemical data, at the time the PD catheter was inserted. Follow-up visits were scheduled 1, 6, and 12 months after enrollment. During the follow-up period, residual renal function and dialysis adequacy (Kt/V) were evaluated, and laboratory values were reassessed. Questionnaires related to HRQOL, depressive symptoms, and patient satisfaction with treatment were filled out at the 1- and 12-month follow-up appointments. The clinical events, including peritonitis episodes, hospitalizations, deaths, and the development of cancer, were also reported.
The primary outcomes were the mean change in questionnaires scores and the relationship between HRQOL assessment outcomes and background variables. The KDQOL-SF™ version 1.3 is a self-reported measure combining the kidney disease-specific instrument and the SF-36 instrument.21 We used the Korean version of the Kidney Disease Quality of Life Short Form 36 (KDQOL-36), which has been translated and validated.22 This questionnaire consists of 80 items divided into 19 domains plus 1 separate item that compares current health status with health status 1 year ago. The final separate item is the overall health item. Each domain is rated on a scale from 0 to 100, with higher scores reflecting better HRQOL. The scores of the kidney disease-targeted items are aggregated into the kidney disease composite summary (KDCS) score. The scores of the SF-36 are also classified into a physical composite summary (PCS) score that includes items related to physical function, physical roles, pain, and general health, plus a mental composite summary (MCS) score that includes items related to emotional roles, emotional well-being, emotional energy, and social functioning. The total SF-36 score was calculated as the sum of the PCS and MCS. The Beck Depression Inventory (BDI)-II consists of 21 self-reported items; each item is scored from 0 to 3, with the total score ranging from 0 to 63. The scores are then categorized as follows: 0 to 13, no-to-mild; 14 to 19, mild-to-moderate; 20 to 28, moderate-to-severe; and 29 to 63, severe-depressive symptoms.23 The Korean version of the BDI-II which has been translated and validated was used.24 The Renal Treatment Satisfaction Questionnaire (RTSQ) includes 11 items, and each item is scored from 0 to 6, with higher scores indicating better satisfaction with treatment.25 We used the translated and validated Korean version of RTSQ.22
The secondary outcome was the incidence of peritonitis episodes, hospitalizations, deaths, and the development of cancer.
Statistical Analysis
Sociodemographic, clinical, and biochemical data were compared using Pearson Chi-square test or Fisher exact test for categorical variables and using the Student t test for continuous variables. Continuous variables are expressed as mean ± standard deviation. Statistical analysis was performed using the SAS system for Windows, version 9.2 (SAS Institute, Inc., Cary, NC) and R (R Foundation for Statistical Computing, Vienna, Austria; www.r-project.org). We performed a propensity-matched analysis wherein the model was reconstructed using age, sex, presence of diabetes, and the Davies comorbidity index. The propensity score matching was conducted using a 1:1 matching procedure, whereby each patient on APD was matched with the patient on CAPD who had the smallest difference in propensity scores. The SAS macro used for this analysis was a modified version of the %OneToManyMTCH. To determine the effects of PD modality (APD vs CAPD) and time, as well as the interaction between both, we used repeated-measures ANOVA. Specifically, we compared the mean scores on the questionnaires, as well as the mean 1-year changes in every domain of the questionnaires, between patients receiving APD and those receiving CAPD. Multivariate linear regression analysis was used to investigate the association between questionnaire scores and background variables. P values <0.05 were considered statistically significant.
RESULTS
Patients and Baseline Characteristics
A total of 260 incident patients starting APD or CAPD at 11 centers were enrolled in this study. From a total of 260 patients, 64 were excluded: 52 patients did not complete the questionnaires at 12 months, and 12 patients changed PD modality during the 1-year follow-up period (APD > CAPD: n = 1, CAPD > APD: n = 10, CAPD > APD > CAPD: n = 1). For propensity score matching, 160 patients (APD: 80 patients, CAPD: 80 patients) were selected on the basis of PD modality from among the 196 patients who completed the study.
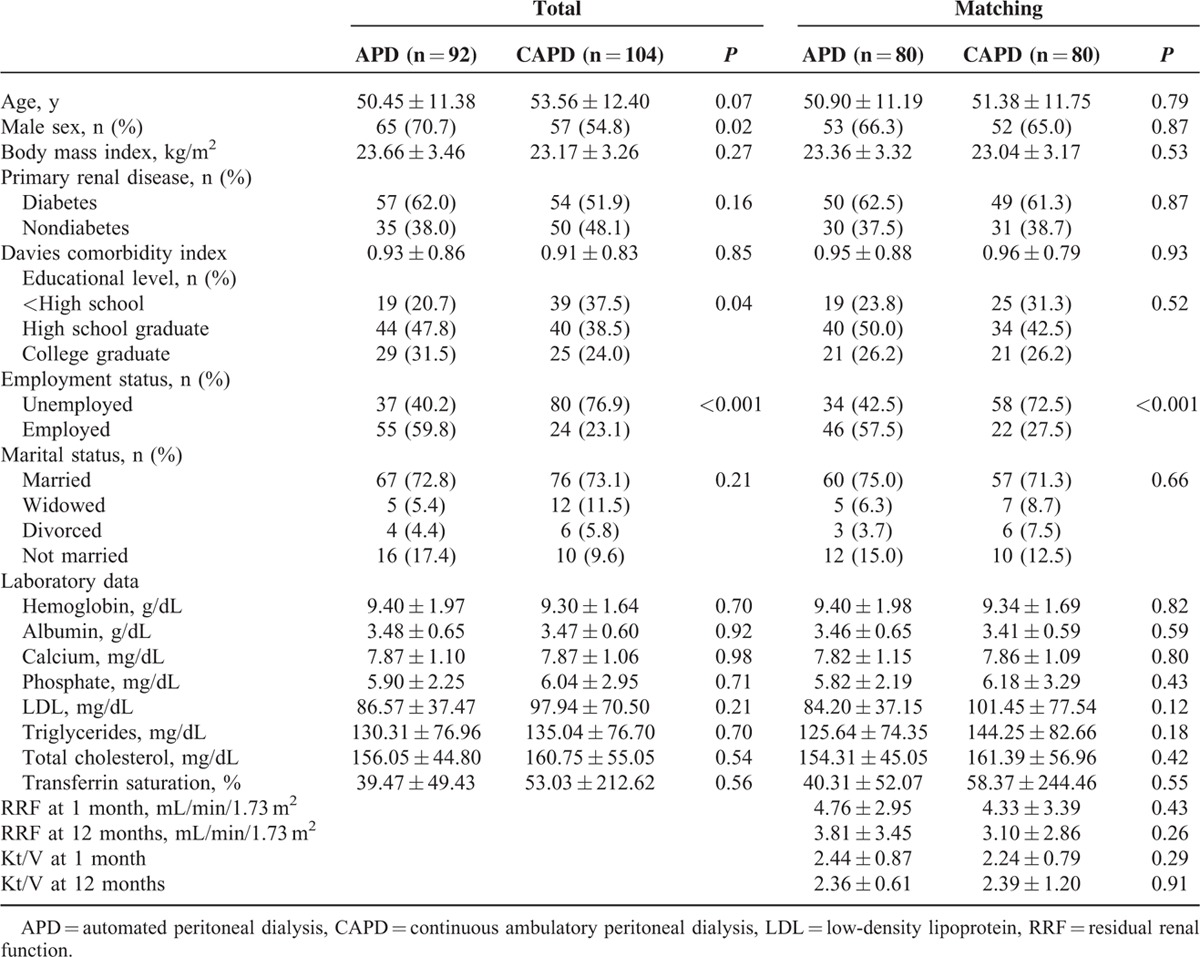
Among the entire study population (n = 196), patients receiving APD (n = 92) were significantly more often men, educated, and employed than patients receiving CAPD (n = 104). The patient characteristics did not differ according to PD modality in the propensity score-matched population (n = 160), except for employment status, which was not used as a matching variable (Table 1).
TABLE 1.
Baseline Sociodemographic, Clinical, and Biochemical Characteristics of the Study Participants According to Peritoneal Dialysis Modality
Comparison of HRQOL Scores and the Mean Changes Over 1 Year Between APD and CAPD
At baseline, both the KDCS scores and the SF-36 scores were significantly lower in CAPD patients than in APD patients (APD vs CAPD: 68.43 ± 12.32 vs 63.25 ± 12.00, P = 0.01 and 54.64 ± 18.20 vs 48.11 ± 20.39, P = 0.03, respectively; Table 2). The mean scores of the PCS and the MCS at baseline for APD patients were 58.13 and 53.25 and those for CAPD patients were 52.05 and 46.51, respectively. Compared with CAPD patients, APD patients had significantly higher scores at baseline in the domains of symptoms (P = 0.03), work status (P < 0.001), patient satisfaction (P = 0.01), pain (P = 0.03), and social function (P = 0.04).
TABLE 2.
Quality of Life Scores 1 and 12 Months After Starting Therapy According to Peritoneal Dialysis Modality in Propensity Score-Matched Peritoneal Dialysis Patients
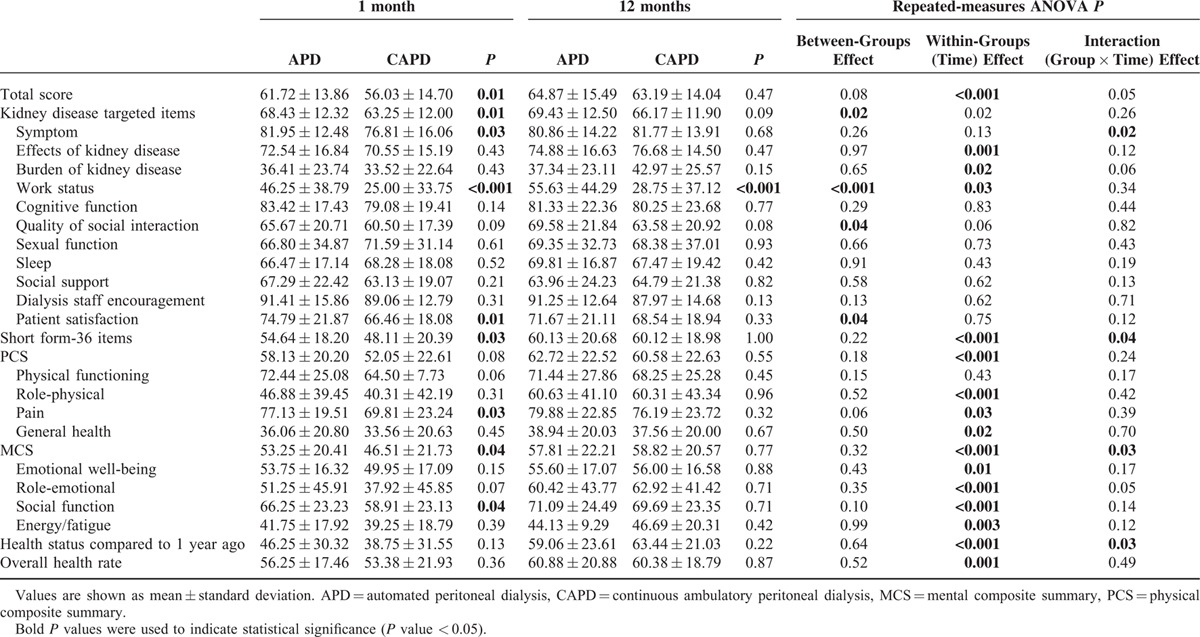
However, there were no significant differences between APD and CAPD patients in the KDCS scores or in the SF-36 scores 1 year later. The follow-up PCS scores in APD and CAPD patients were 62.72 and 60.58, and the MCS scores were 57.81 and 58.82, respectively (Table 2). When the mean changes in HRQOL scores from 1 to 12 months were compared between APD and CAPD patients, CAPD patients showed significantly greater improvement in the SF-36 scores (a mean of 6.52 points greater improvement, P = 0.04), especially in the MCS scores (a mean of 7.76 points greater improvement, P = 0.03), in the symptoms domain (a mean of 6.05 points greater improvement, P = 0.01), and in self-assessment regarding health status compared to 1 year ago (a mean of 11.88 points greater improvement, P = 0.03, Figure 1).
FIGURE 1.
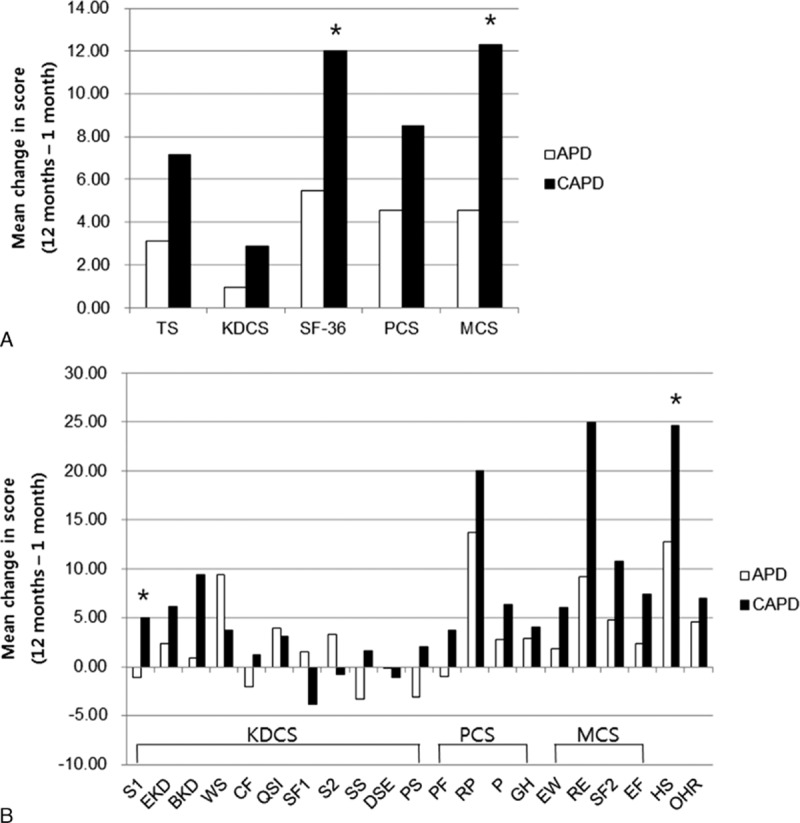
Mean changes in health-related quality of life scores from 1 to 12 months after starting therapy in propensity score-matched peritoneal dialysis patients. CAPD patients showed significantly greater improvement over time than APD patients in SF-36 scores, especially in MCS (A) and in the domains “symptoms” and “self-assessment regarding health status compared to 1 year ago” (b). APD = automated peritoneal dialysis, BKD = burden of kidney disease, CAPD = continuous ambulatory peritoneal dialysis, CF = cognitive function, DSE = dialysis staff, EF = energy/fatigue, EKD = effects of kidney disease, EW = emotional well-being, GH = general health, HS = health status compared to 1-year ago, KDCS = kidney disease composite summary; encouragement, MCS = mental composite summary, OHR = overall health rate, P = pain, PCS = physical composite summary, PF = physical functioning, PS = patient satisfaction, QSI = quality of social interaction, RE = role-emotional, RP = role-physical, S1 = symptom, S2 = sleep, SF1 = sexual function, SF2 = social function, SF-36 = short form-36, SS = social support, TS = total scores, WS = work status. ∗P < 0.05 vs APD in the mean change of score.
Comparison of BDI Scores and the Mean Changes Over 1 Year Between APD and CAPD
The BDI scores at 1 month were significantly lower in APD patients compared with CAPD patients (APD vs CAPD: 15.35 ± 10.02 vs 19.03 ± 9.24, P = 0.02). However, there was no difference in the BDI scores between the 2 groups 1 year later (Table 3). The incidence of moderate-to-severe depressive symptoms tended to be higher in patients receiving CAPD than in those receiving APD at 1 month, although this difference was not significant (APD vs CAPD: 32.5% vs 47.5%; P = 0.05); there was no difference at 12 months (Figure 2). CAPD patients showed significantly greater decreases in BDI scores than APD patients at 1 year (a mean of 3.75 points greater improvement, P = 0.01, Figure 3).
TABLE 3.
The Beck Depression Inventory (BDI) and Renal Treatment Satisfaction Questionnaire (RTSQ) Scores 1 and 12 Months After Starting Therapy According to Peritoneal Dialysis Modality in Propensity Score-Matched Peritoneal Dialysis Patients
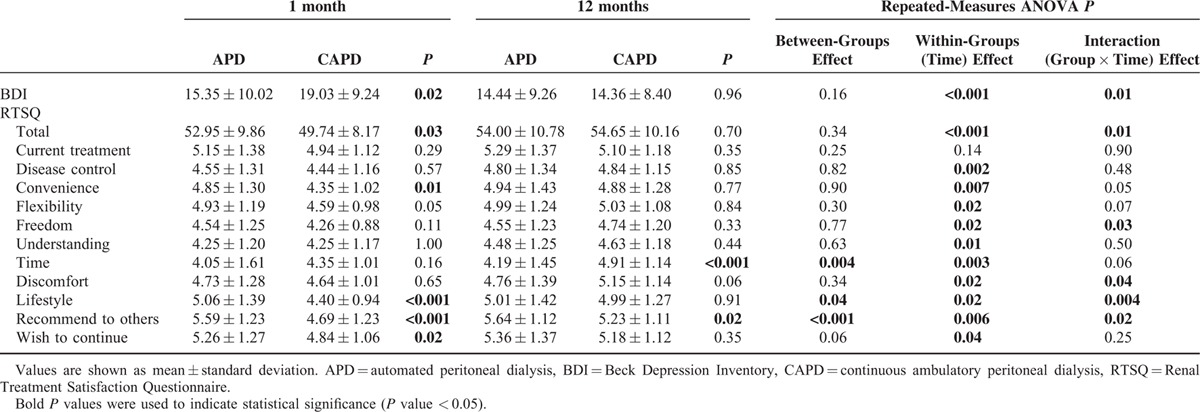
FIGURE 2.
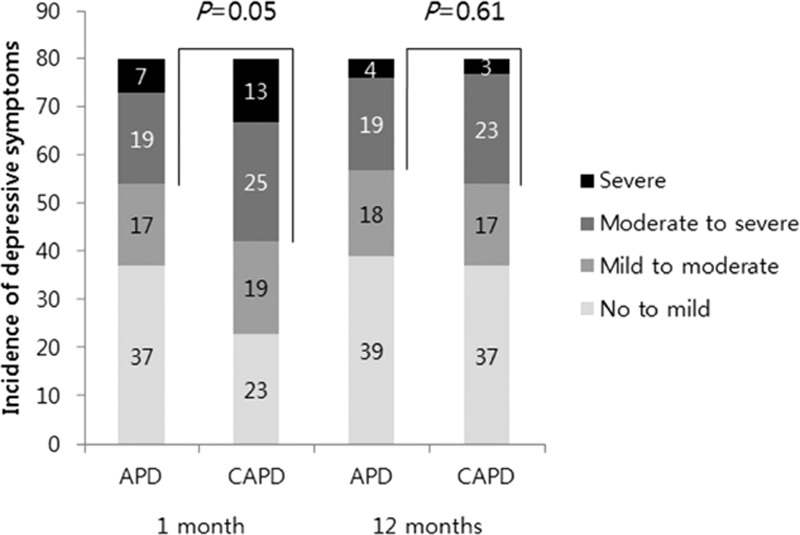
Incidence of depressive symptoms according to severity in propensity score-matched peritoneal dialysis patients. CAPD patients showed a higher incidence of at least a moderate degree of depressive symptoms at 1 month than APD patients but this difference was not observed at 12 months. APD = automated peritoneal dialysis, CAPD = continuous ambulatory peritoneal dialysis. P-value, APD vs CAPD in the incidence of moderate to severe depressive symptoms (BDI scores ≥20).
FIGURE 3.
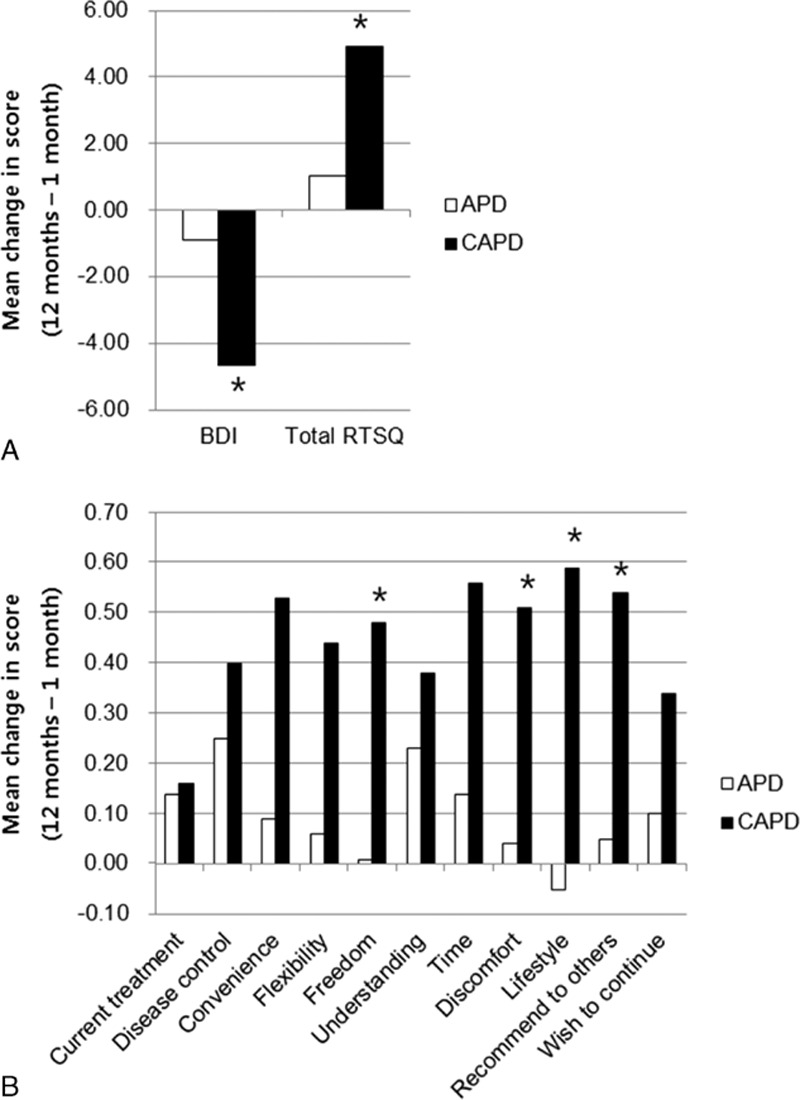
Mean changes in the Beck Depression Inventory (BDI) and Renal Treatment Satisfaction Questionnaire (RTSQ) scores 1 to 12 months after starting therapy in propensity score-matched peritoneal dialysis patients. CAPD patients showed significantly greater decreased BDI scores and greater improvement in patient satisfaction with treatment at 1 year later than APD patients (A). The items which showed significantly greater improvement in CAPD patients compared with APD included satisfaction with freedom afforded by treatment, discomfort or pain involved with treatment, how well treatment fits in with lifestyle, and recommendation this treatment to others (B). APD = automated peritoneal dialysis, CAPD = continuous ambulatory peritoneal dialysis. ∗P < 0.05 vs APD in the mean change of score.
Comparison of RTSQ Scores and the Mean Changes Over 1 Year Between APD and CAPD
APD patients showed significantly higher satisfaction than CAPD patients with renal treatment 1 month after staring treatment (APD vs CAPD: 52.95 ± 9.86 vs 49.74 ± 8.17, P = 0.03). However, there was no difference in the total scores at 12 months between the 2 groups (Table 3). Satisfaction with treatment duration was higher in CAPD patients than in APD patients at 12 months (P < 0.001), and CAPD patients showed significantly greater improvement in satisfaction with treatment (a mean of 3.86 points greater improvement, P = 0.01, Figure 3). The items for which CAPD patients showed significantly greater improvement than APD patients included satisfaction with the freedom afforded by treatment (a mean of 0.47 points greater improvement, P = 0.03); discomfort or pain associated with treatment (a mean of 0.47 points greater improvement, P = 0.04); how well treatment fit into their lifestyle (a mean of 0.64 points greater improvement, P = 0.01); and recommending this treatment to others (a mean of 0.49 points greater improvement, P = 0.02).
Analysis of Factors associated With HRQOL Scores
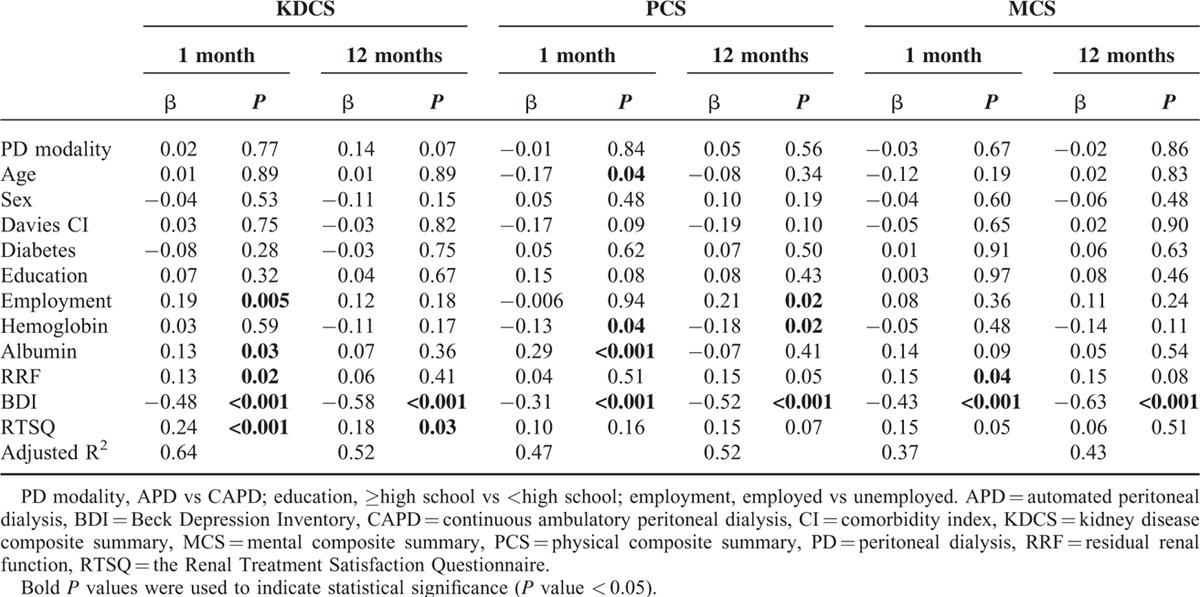
In multivariate linear regression analysis (Table 4), the BDI score was the one factor that was inversely associated with KDCS, PCS, and MCS scores at 1 and 12 months after starting therapy (KDCS vs PCS vs MCS at 1 month: β = −0.48 vs −0.31 vs −0.43, all P < 0.001; KDCS vs PCS vs MCS at 12 months: β = −0.58 vs −0.52 vs −0.63, all P < 0.001). The RTSQ score was significantly associated with the KDCS score at 1 month (β = 0.24, P < 0.001) and 12 months (β = 0.18, P = 0.03) but not with the PCS and MCS scores. Residual renal function showed a positive correlation with the KDCS score at 1 month (β = 0.13, P = 0.02) but not with the PCS and MCS scores. Although serum hemoglobin and albumin were not associated with MCS, both were significantly associated with PCS at 1 month (β = −0.13, P = 0.04 vs β = 0.29, P < 0.001). PD modality was not associated with HRQOL even after adjusting for possible confounding variables such as age, sex, Davies comorbidity index, the presence of diabetes, educational level, employment status, serum hemoglobin, serum albumin, residual renal function, BDI, and RTSQ scores.
TABLE 4.
Multivariate Linear Regression Analysis of Factors Associated With Total Scores of Peritoneal Dialysis Patients on Quality of Life Questionnaires Completed 1 and 12 Months After Starting Therapy
Clinical Outcomes
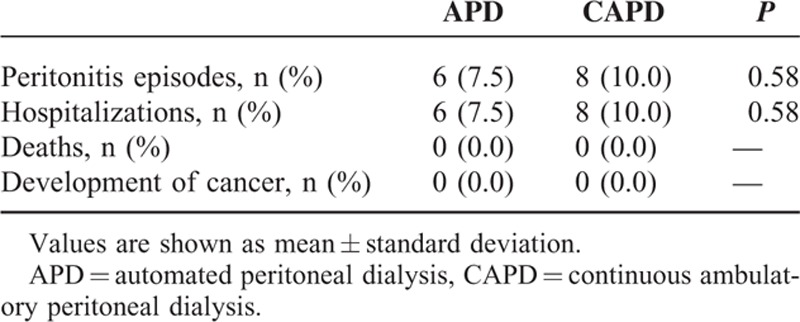
During the 12-month follow-up period, 6 (7.5%) of the APD patients and 8 (10.0%) of the CAPD patients experienced a peritonitis episode and hospitalization. There were no differences in the incidence of peritonitis episodes and hospitalization between APD and CAPD, and neither group had any deaths or cancer (Table 5).
TABLE 5.
Clinical Outcomes According to Peritoneal Dialysis Modality in Propensity Score-Matched Peritoneal Dialysis Patients
DISCUSSION
This prospective multicenter propensity-matched study investigated in detail the changes in HRQOL over time. It also investigated factors that might be associated with the HRQOL of patients starting APD and CAPD. Although the baseline HRQOL of APD patients was better than that of CAPD patients, no differences in HRQOL were observed 12 months later between the 2 groups. Multivariate linear regression analysis confirmed the crucial impact of depressive symptoms rather than the PD modality itself on HRQOL in PD patients. Accordingly, significantly greater improvements in depressive symptoms resulted in greater improvements in HRQOL in CAPD patients compared to APD patients.
Clinical outcomes can be important variables in selecting the PD modality as well as being crucial factors that can influence HRQOL. However, there is no consensus regarding which PD modality results in better clinical outcomes. Retrospective observational studies from the United States26 and Mexico27 show that APD is better than CAPD in terms of patient survival and technique survival. However, another retrospective observational study that included 194 APD patients and 178 CAPD patients reported that APD did not have any advantage in terms of technique survival after adjusting for possible confounding factors including comorbidities during the approximately 2.2-year period.19 Similar results regarding death and technique failure were obtained in a retrospective study of 66,381 incident PD patients over a 9-year period28 as well as in two large cohorts, the NECOSAD29 and USRDS cohorts.30 In accordance with earlier findings, the present prospective study also showed no differences in deaths, peritonitis episodes, or hospitalization between the 2 PD modalities, even after propensity-matching analysis. A long-term follow-up study is needed to demonstrate patient survival results and to confirm previous results.
Assuming that the 2 PD modalities have similar clinical outcomes, HRQOL can be a crucial outcome parameter when advising patients about PD modality selection. Few studies have assessed the impact of PD modality on HRQOL, and neither modality is clearly better in terms of HRQOL. In our study, the overall HRQOL scores in both the APD and CAPD groups improved over time, with a greater degree of improvement in CAPD patients. APD patients had higher scores than CAPD patients for the KDCS domains “symptoms” and “patient satisfaction with dialysis staff” at 1 month, but these differences disappeared at 12 months. Contrary to our expectations, there were no differences between the 2 groups regarding sleep. On the PCS and MCS, APD patients reported less pain and better social relationships than CAPD patients at 1 month, but these differences were not observed at 12 months. One prospective randomized study of 34 patients that compared HRQOL between APD and CAPD17 showed that APD patients had significantly more time for work, family, and social activities but also more marked sleep problems. A small-sized (25 patients), randomized trial showed that PD modality has a direct impact on HRQOL. Although our study was not randomized, we estimated that the propensity score matching balanced the baseline characteristics of APD and CAPD patients in order to overcome the nonrandomized study design. However, employment status was not used as a propensity-matching variable. APD patients tended to be more employed and relatively wealthier than CAPD patients because APD is more expensive than CAPD in Korea. Therefore, to include more eligible PD patients, even after propensity score matching, we could not adjust for employment status due to underlying socioeconomic differences between the 2 groups. In multivariate linear regression analysis of factors associated with HRQOL, no significant association was observed between employment status and MCS, and inconsistent associations were observed between employment status and PCS or KDCS, depending on the time point. These results might suggest a discontinuous and minimal impact of employment status on HRQOL in our study. Another prospective study that enrolled 18 incident PD patients did not find any difference in HRQOL at a single time point in APD versus CAPD.18 Compared with 2 previous prospective studies, our study included much higher number of patients and established changes in HRQOL over time.
A cross-sectional study that recruited 96 prevalent PD patients1 demonstrated that APD patients had better mental health than CAPD patients. A retrospective study of 224 incident patients19 revealed that CAPD patients had worse baseline HRQOL compared with APD patients, but HRQOL in APD and CAPD were similar after 1 year. The greater improvement on the PCS and MCS in CAPD patients versus APD patients correlated with their lower baseline score but not with the PD modality itself. The trend of HRQOL improving over time was similar to that in our study, but the factors associated with improved HRQOL in CAPD patients were different. In our study, depressive symptoms were inversely associated with HRQOL, and patient satisfaction with treatment was significantly associated with KDCS. This suggests that psychological well-being and high satisfaction with the PD modality may lead to increased treatment compliance and better disease management. These positive results may be directly connected to the increased HRQOL.
The notable finding in our study was that significantly greater improvement in depressive symptoms in CAPD patients, rather than the PD modality itself, resulted in a greater improvement in HRQOL in CAPD versus APD patients. Among several factors that have an effect on HRQOL, depressive symptoms can be overlooked just by measuring HRQOL. Indeed, depression is the most prevalent psychosocial problem among patients with ESRD, but it is under diagnosed and undertreated. One systematic review reported an independent association between depression and increased mortality risk in dialysis patients.4 A study noted that depression is independently correlated with peritonitis rates, and the authors speculated that this might be due to stress related to dealing with aseptic technique.31 Therefore, considering its impact on HRQOL and clinical outcomes, PD patients should be regularly evaluated for depression, just as clinical parameters such as Kt/V, residual renal function, and laboratory findings are serially measured.
Generally, about 39.0% of dialysis patients have depressive symptoms, regardless of the assessment tool.32 In our study population, 53.8% of APD patients and 71.3% of CAPD patients experienced various degrees of depressive symptoms at the time dialysis began and the overall scores of depressive symptoms had decreased in both the APD and CAPD groups after 1 year. Interestingly, our study showed that depressive symptoms were the only consistent and powerful factor that influenced HRQOL over time. This result is in accordance with the finding that a significantly greater improvement in HRQOL scores was particularly prominent in the MCS among the three HRQOL elements. The impact of depression on HRQOL has been confirmed in hemodialysis (HD) patients13,14 and in predialysis patients.15 The overall tendencies of HRQOL and depressive symptoms to improve after dialysis initiation may be due to improvements in uremia or may reflect adjustments to dialysis, even considering the burden of kidney disease and treatment time. However, the remarkable fact we have to keep in mind is that despite the spontaneous improvement of depressive symptoms, as many as 67.5% of APD and 63.8% of CAPD patients still had depressive symptoms at the 1-year appointment. Little is known about the treatment of depression in PD patients. A pilot study was designed to evaluate and treat pharmacologically PD patients with clinical depression.33 In this pilot study, 136 PD patients were screened, but only 27 patients agreed to further evaluation and just 11 patients of the 22 patients eligible for therapy completed an antidepressant medication. The BDI scores of patients receiving therapy decreased from a mean of 17.1 ± 6.9 to 8.6 ± 3.2. Even though there was no control group, a comparison of the BDI scores in that study with those in our study leads us to cautiously speculate that the efficacy of antidepressant medication might be greater than the degree of spontaneous improvement in depressive symptoms as dialysis continues. Additional definite evidence is needed through randomized control trials to verify the effects of antidepressant medication. In addition, it may be challenging to convince reluctant PD patients to be evaluated and to start treatment for depression.
This study has some limitations. Firstly, we did not refer PD patients with depressive symptoms to psychiatric physicians and could not demonstrate the impact of antidepressant treatment on overall outcomes or on HRQOL. Secondly, we could not explain why depressive symptoms improved, especially in CAPD patients, without additional treatment. Thirdly, the relationship between depressive symptoms and HRQOL may be questioned, particularly at the 12-month data collection point, because life events or stressors that may bring about depressive symptoms have not been controlled for. However, it is expected that HRQOL should be related to depressive symptoms as the HRQOL also measures depressive symptoms. Fourthly, we did not check the cognitive depression index, which would have yielded more useful results. However, our study also has strengths in that it showed detailed changes over time for HRQOL, depressive symptoms, renal treatment satisfaction, and clinical outcomes since it included much larger number of patients compared to previous prospective studies that compared HRQOL in APD and CAPD patients.
In summary, when dialysis was begun, HRQOL was more impaired in patients receiving CAPD than in those receiving APD; however, patients undergoing CAPD showed a greater improvement in HRQOL over time. CAPD patients also showed greater decreases in depressive symptoms and greater patient satisfaction with treatment. Because depressive symptoms has a bigger effect on HRQOL than the PD modality itself and because the prevalence of depressive symptoms remains high despite a tendency to improve over time, evaluating and treating depression in PD patients is our most important task. It is no longer enough for dialysis patients just to survive. The attention and efforts of nephrologists and dialysis staff to improve depression and patient satisfaction with treatment are essential for PD patients who face poor HRQOL. Regular monitoring and appropriate treatment of depression could be crucial for improving impaired HRQOL in PD patients.
Footnotes
Abbreviations: APD = automated peritoneal dialysis, BDI = Beck Depression Inventory, CAPD = continuous ambulatory peritoneal dialysis, ESRD = end-stage renal disease, HD = hemodialysis, HRQOL = health-related quality of life, KDCS = kidney disease composite summary, KDQOL-36 = Kidney Disease Quality of Life Short Form 36, MCS = mental composite summary, PCS = physical composite summary, PD = peritoneal dialysis, RTSQ = Renal Treatment Satisfaction Questionnaire.
This research was supported by a grant from the Korea Health Technology R&D Project through the Korea Health Industry Development Institute (KHIDI), which is funded by the Ministry of Health & Welfare, Republic of Korea (HI15C0001, HI13C1232).
The authors have no conflicts of interest to disclose.
REFERENCES
- 1.de Wit GA, Merkus MP, Krediet RT, et al. A comparison of quality of life of patients on automated and continuous ambulatory peritoneal dialysis. Perit Dial Int 2001; 21:306–312. [PubMed] [Google Scholar]
- 2.Cukor D, Peterson RA, Cohen SD, et al. Depression in end-stage renal disease hemodialysis patients. Nat Clin Pract Nephrol 2006; 2:678–687. [DOI] [PubMed] [Google Scholar]
- 3.Mapes DL, Lopes AA, Satayathum S, et al. Health-related quality of life as a predictor of mortality and hospitalization: The Dialysis Outcomes and Practice Patterns Study (DOPPS). Kidney Int 2003; 64:339–349. [DOI] [PubMed] [Google Scholar]
- 4.Farrokhi F, Abedi N, Beyene J, et al. Association between depression and mortality in patients receiving long-term dialysis: a systematic review and meta-analysis. Am J Kidney Dis 2014; 63:623–635. [DOI] [PubMed] [Google Scholar]
- 5.Valderrabano F, Jofre R, Lopez-Gomez JM. Quality of life in end-stage renal disease patients. Am J Kidney Dis 2001; 38:443–464. [DOI] [PubMed] [Google Scholar]
- 6.Mingardi G, Cornalba L, Cortinovis E, et al. Health-related quality of life in dialysis patients. A report from an Italian study using the SF-36 Health Survey. Nephrol Dial Transpl 1999; 14:1503–1510. [DOI] [PubMed] [Google Scholar]
- 7.Moreno F, Lopez Gomez JM, Sanz-Guajardo D, et al. Quality of life in dialysis patients. A spanish multicentre study. Spanish Cooperative Renal Patients Quality of Life Study Group. Nephrol Dial Transplant 1996; 11 suppl 2:125–129. [DOI] [PubMed] [Google Scholar]
- 8.Kutner NG, Devins GM. A comparison of the quality of life reported by elderly whites and elderly blacks on dialysis. Geriatr Nephrol Urol 1998; 8:77–83. [DOI] [PubMed] [Google Scholar]
- 9.Beusterien KM, Nissenson AR, Port FK, et al. The effects of recombinant human erythropoietin on functional health and well-being in chronic dialysis patients. J Am Soc Nephrol 1996; 7:763–773. [DOI] [PubMed] [Google Scholar]
- 10.Termorshuizen F, Korevaar JC, Dekker FW, et al. The relative importance of residual renal function compared with peritoneal clearance for patient survival and quality of life: an analysis of the Netherlands Cooperative Study on the Adequacy of Dialysis (NECOSAD)-2. Am J Kidney Dis 2003; 41:1293–1302. [DOI] [PubMed] [Google Scholar]
- 11.Bremer BA, McCauley CR, Wrona RM, et al. Quality of life in end-stage renal disease: a reexamination. Am J Kidney Dis 1989; 13:200–209. [DOI] [PubMed] [Google Scholar]
- 12.Painter P, Carlson L, Carey S, et al. Physical functioning and health-related quality-of-life changes with exercise training in hemodialysis patients. Am J Kidney Dis 2000; 35:482–492. [DOI] [PubMed] [Google Scholar]
- 13.Kimmel PL, Weihs K, Peterson RA. Survival in hemodialysis patients: the role of depression. J Am Soc Nephrol 1993; 4:12–27. [DOI] [PubMed] [Google Scholar]
- 14.Kimmel PL, Peterson RA, Weihs KL, et al. Psychologic functioning, quality of life, and behavioral compliance in patients beginning hemodialysis. J Am Soc Nephrol 1996; 7:2152–2159. [DOI] [PubMed] [Google Scholar]
- 15.Shidler NR, Peterson RA, Kimmel PL. Quality of life and psychosocial relationships in patients with chronic renal insufficiency. Am J Kidney Dis 1998; 32:557–566. [DOI] [PubMed] [Google Scholar]
- 16.Wu AW, Fink NE, Marsh-Manzi JV, et al. Changes in quality of life during hemodialysis and peritoneal dialysis treatment: generic and disease specific measures. J Am Soc Nephrol 2004; 15:743–753. [DOI] [PubMed] [Google Scholar]
- 17.Bro S, Bjorner JB, Tofte-Jensen P, et al. A prospective, randomized multicenter study comparing APD and CAPD treatment. Perit Dial Int 1999; 19:526–533. [PubMed] [Google Scholar]
- 18.Sunder S, Kalra OP, Nashine S, et al. Comparative study of adequacy of dialysis and health-related quality of life in patients on CAPD and APD. Perit Dial Int 2008; 28:542–544. [PubMed] [Google Scholar]
- 19.Balasubramanian G, McKitty K, Fan SL. Comparing automated peritoneal dialysis with continuous ambulatory peritoneal dialysis: survival and quality of life differences? Nephrol Dial Transplant 2011; 26:1702–1708. [DOI] [PubMed] [Google Scholar]
- 20.Cameron JI, Whiteside C, Katz J, et al. Differences in quality of life across renal replacement therapies: a meta-analytic comparison. Am J Kidney Dis 2000; 35:629–637. [DOI] [PubMed] [Google Scholar]
- 21.Hays RD, Kallich JD, Mapes DL, et al. Development of the kidney disease quality of life (KDQOL) instrument. Qual Life Res 1994; 3:329–338. [DOI] [PubMed] [Google Scholar]
- 22.Kim JY, Kim B, Park KS, et al. Health-related quality of life with KDQOL-36 and its association with self-efficacy and treatment satisfaction in Korean dialysis patients. Qual Life Res 2013; 22:753–758. [DOI] [PMC free article] [PubMed] [Google Scholar]
- 23.Beck AT, Steer RA, Ball R, et al. Comparison of beck depression inventories -IA and -II in psychiatric outpatients. J Pers Assess 1996; 67:588–597. [DOI] [PubMed] [Google Scholar]
- 24.Sung H, Kim J, Park Y, et al. A study on the reliability and the validity of Korean version of the Beck Depression Inventory-II (BDI-II). J Korean Soc Biol Ther Psychiatry 2008; 14:201–212. [Google Scholar]
- 25.Barendse SM, Speight J, Bradley C. The Renal Treatment Satisfaction Questionnaire (RTSQ): a measure of satisfaction with treatment for chronic kidney failure. Am J Kidney Dis 2005; 45:572–579. [DOI] [PubMed] [Google Scholar]
- 26.Guo A, Mujais S. Patient and technique survival on peritoneal dialysis in the United States: evaluation in large incident cohorts. Kidney Int Suppl 2003; 88:S3–S12. [DOI] [PubMed] [Google Scholar]
- 27.Sanchez AR, Madonia C, Rascon-Pacheco RA. Improved patient/technique survival and peritonitis rates in patients treated with automated peritoneal dialysis when compared to continuous ambulatory peritoneal dialysis in a Mexican PD center. Kidney Int 2008; 73:S76–S80. [DOI] [PubMed] [Google Scholar]
- 28.Mehrotra R, Chiu YW, Kalantar-Zadeh K, et al. The outcomes of continuous ambulatory and automated peritoneal dialysis are similar. Kidney Int 2009; 76:97–107. [DOI] [PubMed] [Google Scholar]
- 29.Michels WM, Verduijn M, Boeschoten EW, et al. Similar survival on automated peritoneal dialysis and continuous ambulatory peritoneal dialysis in a large prospective cohort. Clin J Am Soc Nephrol 2009; 4:943–949. [DOI] [PMC free article] [PubMed] [Google Scholar]
- 30.Mehrotra R. Long-term outcomes in automated peritoneal dialysis: similar or better than in continuous ambulatory peritoneal dialysis? Perit Dial Int 2009; 29 suppl 2:S111–S114. [PubMed] [Google Scholar]
- 31.Troidle L, Watnick S, Wuerth DB, et al. Depression and its association with peritonitis in long-term peritoneal dialysis patients. Am J Kidney Dis 2003; 42:350–354. [DOI] [PubMed] [Google Scholar]
- 32.Palmer S, Vecchio M, Craig JC, et al. Prevalence of depression in chronic kidney disease: systematic review and meta-analysis of observational studies. Kidney Int 2013; 84:179–191. [DOI] [PubMed] [Google Scholar]
- 33.Wuerth D, Finkelstein SH, Ciarcia J, et al. Identification and treatment of depression in a cohort of patients maintained on chronic peritoneal dialysis. Am J Kidney Dis 2001; 37:1011–1017. [DOI] [PubMed] [Google Scholar]


