Abstract
The aim of the study was to compare differences between lymphoma and inflammation as indicated by high diffuse uptake of 18F-fluorodeoxyglucose (18F-FDG) in the spleen, liver, and bone marrow without increased 18F-FDG uptake in the lymph nodes and without enlarged peripheral lymph nodes.
Eighteen lymphoma patients and 14 inflammation patients were examined with 18F-FDG positron emission tomography–computer tomography (PET-CT). All patients displayed high diffuse uptake of 18F-FDG in the spleen, liver, and bone marrow without increased 18F-FDG uptake in the lymph nodes and without enlarged peripheral lymph nodes. Our analyses compared the maximum standardized uptake values (SUVmax) of 18F-FDG uptake ratios between the spleen/liver, the spleen/bone marrow, and the liver/bone marrow and further compared spleen sizes between lymphoma and inflammation patients.
Using Student t test, no significant differences were found in the SUVmax ratios of spleen/liver and liver/bone marrow between the lymphoma and inflammation patients (t = 0.853, P = 0.401 > 0.05; t = 1.622, P = 0.115 > 0.05). However, the SUVmax ratio of the spleen/bone marrow of the lymphoma patients was significantly different from that of the inflammation patients (t = 2.426, P = 0.021 < 0.05). The spleen size between the lymphoma and inflammation patients was also significantly different (t = 2.911, P = 0.007 < 0.05).
As indicated by 18F-FDG PET-CT, our study demonstrated that lymphoma and inflammation patients displayed a few differences despite both having high diffuse uptake of 18F-FDG in the spleen, liver, and bone marrow without enlarged peripheral lymph nodes and without increased 18F-FDG uptake in lymph nodes.
INTRODUCTION
Patients with diffuse high uptake of 18F-fluorodeoxyglucose (18F-FDG) in the spleen, liver, and bone marrow but without increased 18F-FDG uptake in the lymph nodes and without enlarged peripheral lymph nodes are frequently observed in lymphoma or inflammation.1,2 However, whether these 18F-FDG uptakes reflect the involvement of inflammatory or lymphoma activation has been difficult to determine. Traditional anatomic imaging techniques computer tomography (CT) and magnetic resonance imaging (MRI) cannot be effectively utilized to correctly diagnose inflammatory or lymphomas activation because they only reveal the organ sizes. Organ sizes cannot be used to assess whether patients have lymphoma because organs may be enlarged without neoplastic involvement or may be of normal size despite tumor infiltration.3
More recently, a hybrid positron emission tomography–CT (PET-CT) imaging technique has become the standard imaging modality for the initial staging, treatment response assessment, and follow-up in patients with lymphoma and has been shown to be superior to traditional anatomic imaging (CT and MRI).4 PET with 18F-FDG has gained wide acceptance as a very useful imaging modality in evaluating a variety of inflammatory and neoplastic diseases. 18F-FDG PET presents major advantages over traditional anatomic imaging (CT and MRI) because it depicts functional and metabolic abnormalities, which often precede anatomic changes.
The spleen is the largest lymphoid organ and blood filtering unit in the body.5 The spleen has rich and diverse populations of immune cells and a specific anatomy, enabling the surveillance and phagocytosis of circulating blood elements. The spleen provides an important defensive role against pathogens, including the development of T and B lymphocytes upon antigenic challenge, the clearance of encapsulated bacteria, the release of immunoglobulins upon antigenic challenge by B lymphocytes, and the production of immune mediators involved in the clearance of bacteria.6 The affinity of glucose transporters for deoxyglucose is apparently increased in inflammation by various growth factors and cytokines.7 For this reason, increased 18F-FDG uptake of spleen may reflect spleen increased glucose usage in cases of inflammation. Moreover, diffuse increased 18F-FDG uptake of spleen could reflect lymphoma infiltration.8 However, diffuse 18F-FDG uptake of spleen could also reflect the proliferation and activation of macrophages as observed after the injection of granulocyte colony-stimulating factor (CSF) or granulocyte-macrophage CSF.9
Unfortunately, the 18F-FDG tracer is not specific for malignant lymphomas.10 Tumors and inflammatory and infective processes show increased 18F-FDG uptake. PET with 18F-FDG has great potential in the evaluation of a variety of inflammatory disorders and other benign disorders.11 Although PET with 18F-FDG is widely used for diagnosing, staging, monitoring therapy, and restaging in lymphomas, limited data are available regarding its ability to detect lymphomatous involvements of the spleen, bone marrow, and liver without apparent lymph node enlargement. In this study, we reviewed the clinical significance of the diffuse high uptake of 18F-FDG in the spleen, bone marrow, and liver in 18F-FDG PET-CT for different clinical settings without apparent lymph node enlargement and without increased 18F-FDG uptake in lymph nodes.
MATERIALS AND METHODS
Patients
Our study consisted of 32 patients (18 lymphoma patients and 14 inflammation patients) with diffuse high uptake of 18F-FDG in the spleen, liver, and bone marrow but without increased 18F-FDG uptake in lymph nodes. No enlarged peripheral lymph nodes (i.e., diameter < 10 mm) were found in any patient. All patients were subjected to 18F-FDG PET-CT before the beginning of treatment. We studied 18 lymphoma patients (8 men and 10 women; age range, 25–73 years; mean age, 49.36 years) and 14 inflammation patients (9 men and 5 women; age range, 13–75 years; mean age, 49.19 years). Patients with a history of known spleen and liver findings and pregnancy were excluded.
All patients underwent bone marrow biopsies. However, not every suspected spleen, liver, and bone lesion detected by imaging was histologically evaluated due to ethical and practical reasons. Therefore, the final diagnosis obtained for each patient was based on histology, imaging (i.e., MRI or CT for bone and bone marrow assessments) and follow-ups. The final diagnosis was confirmed by conventional imaging or PET-CT and was modified after treatment (the progression or response of initial lesion regions was confirmed in the follow-up).
The study was approved by the hospital ethics committee and each individual participating in the study gave his or her informed consent.
Detection of 18F-FDG PET-CT
PET-CT examinations were performed using a Gemini GXL 16 scanner (Philips, Amsterdam, The Netherlands) in 3-dimensional acquisition mode. For PET, this scanner selected an axial field of view (FOV) of 560 mm for whole-body scan. Full-width at half-maximum at center of the FOV, trans-axial spatial resolution was 4 mm full-width. The acquisition time was 2 min/bed position in 3D mode. Low-dose CT acquisition was performed before PET scan from the skull to the upper thigh with 120 kV, the upper limit was 100 mA (automated tube current) and transverse 2 and 5 mm section thickness.
PET was performed 60 min after an intravenous administration of 185 MBq 18F-FDG approximately. Using the line of response RAMLA algorithm reconstructed the PET images. CT data were used for attenuation correction.
STATISTICS
As semiquantitative references, maximum standardized uptake values (SUVmax) were generated using region of interests (ROIs) in the spleen, liver, and bone marrow. The ROIs were manually drawn inside the spleen, liver, and bone marrow using CT data for anatomical locations.
Comparisons of age and the 18F-FDG SUVmax ratios of the spleen/liver, spleen/bone marrow, and liver/bone marrow were performed using Student t tests between 2 groups. Genders were compared with the χ2 test. All statistical tests were 2-tailed and a P value < 0.05 was considered significant.
RESULTS
The characteristics of the 32 patients (18 lymphoma patients and 14 inflammation patients) are summarized in Table 1. In the lymphoma group, there were 8 men and 10 women. In the inflammation group, there were 9 men and 5 women. Using the chi-squared test, the genders of the 2 groups showed no significant differences (χ2 = 1.245, P = 0.265 > 0.05). We studied 18 lymphoma patients (age range, 25–73 years; mean age, 49.36 years) and 14 inflammation patients (age range, 13–75 years; mean age, 49.19 years; Figure 1). Using Student t test, the average ages of the 2 groups also showed no significant difference (t = 0.224, P = 0.823 > 0.05).
TABLE 1.
Clinical Information of Patients Detected by 18F-FDG PET-CT
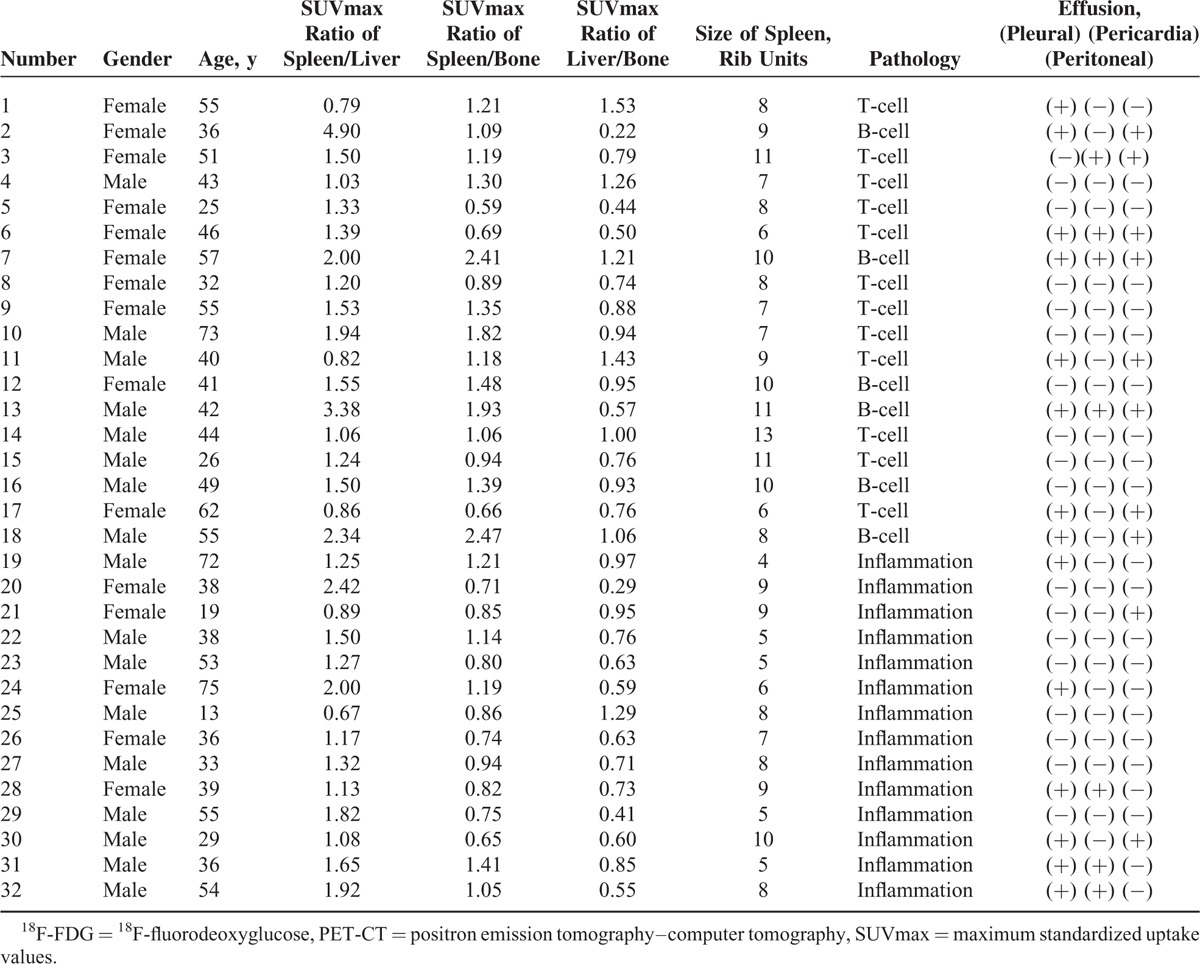
FIGURE 1.
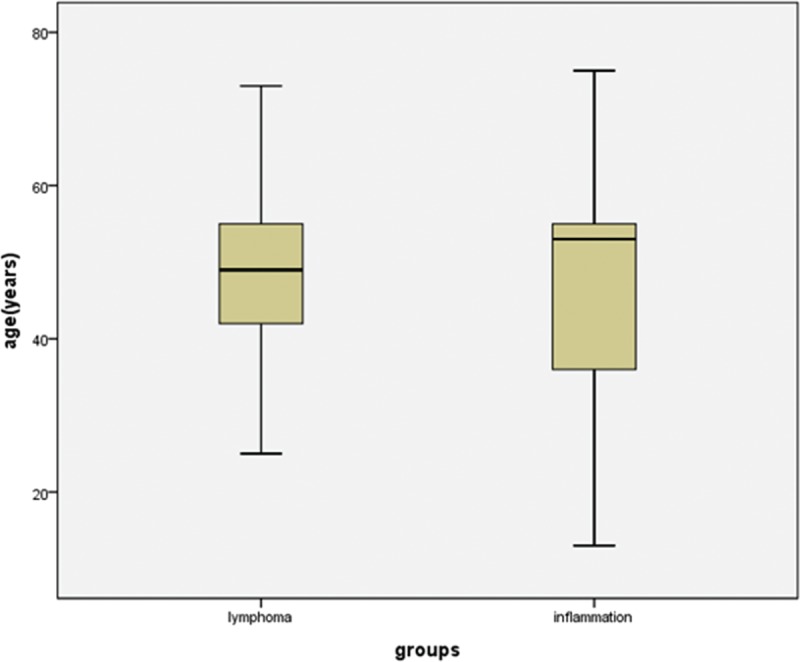
Box plots showing the distribution of ages among patients with lymphoma and inflammation. The box represents the lower and upper quartiles, and the median is marked with a horizontal line inside the box. The whiskers are the 10th and 90th percentiles.
The 18F-FDG uptake values in the spleen were greater than those in the liver for 15 of the 18 lymphoma patients (Figure 2), and the SUVmax ratio between the spleen/liver was 1.69 ± 1.02 (95% confidence interval [CI]: 1.18, 2.19; Figure 3). The 18F-FDG uptake values in the spleen were greater than those in the bone marrow in 13 of the 18 lymphoma patients, and the SUVmax ratio between the spleen/bone marrow was 1.31 ± 0.13 (95% CI: 1.25, 1.38; Figure 4). The 18F-FDG uptake values in the liver were greater than those in the bone marrow in 5 of the 18 patients. The 18F-FDG uptake value in the liver was equal to that in the bone marrow for only 1 patient, and the SUVmax ratio between the liver/bone marrow was 0.89 ± 0.34 (95% CI: 0.72, 1.06; Figure 5). The spleen sizes of all lymphoma patients were >5 rib units, and the average spleen size was 8.83 ± 1.95 rib units (95% CI: 7.86, 9.80; Figure 6).
FIGURE 2.
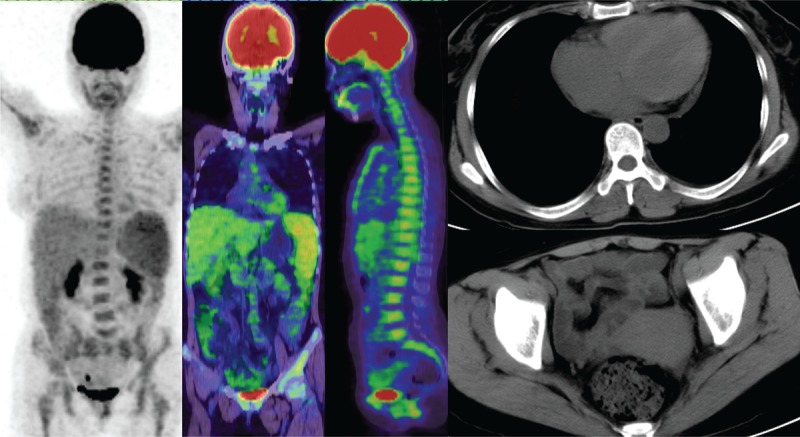
A lymphoma patient had high diffuse uptake of 18F-FDG in the spleen, liver, and bone marrow but no increased 18F-FDG uptake in the lymph nodes and no enlarged peripheral lymph node. The patient had peritoneal effusion and pericardial effusion. 18F-FDG = 18F-fluorodeoxyglucose.
FIGURE 3.
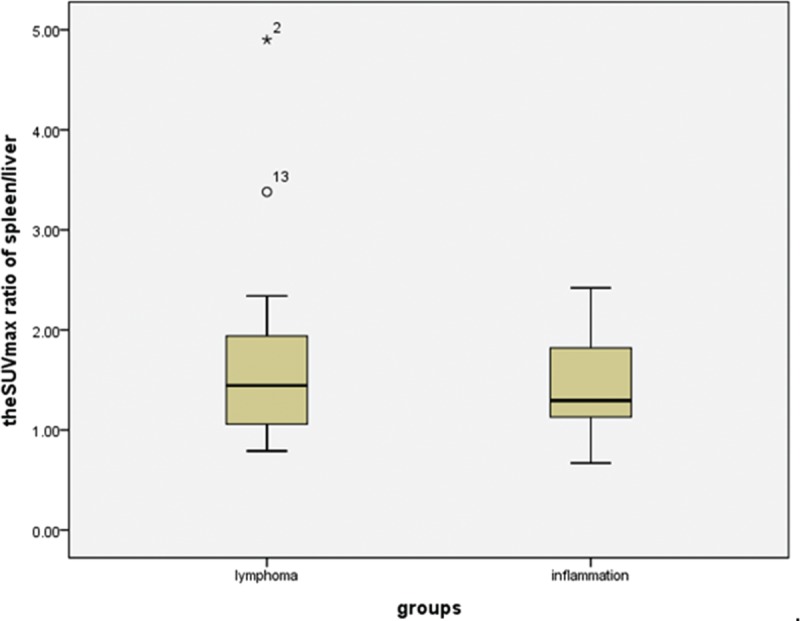
Box plots showing the distribution of the maximum SUV ratio of spleen/liver among patients with lymphoma and inflammation. The box represents the lower and upper quartiles, and the median is marked with a horizontal line inside the box. The whiskers are the 10th and 90th percentiles with outlying observations individually plotted by squares outside the whiskers. SUV = standardized uptake value.
FIGURE 4.
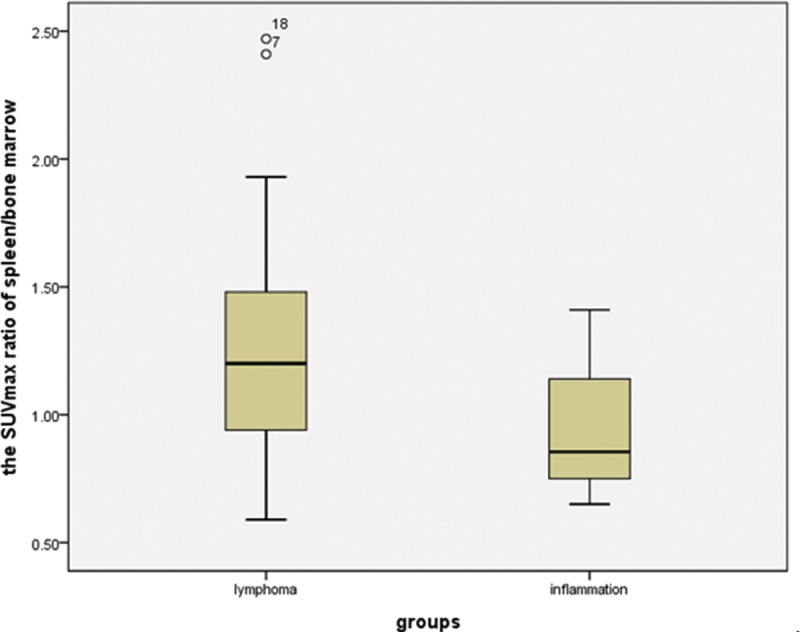
Box plots showing the distribution of the maximum SUV ratio of spleen/bone marrow among patients with lymphoma and inflammation. The box represents the lower and upper quartiles, and the median is marked with a horizontal line inside the box. The whiskers are the 10th and 90th percentiles with outlying observations individually plotted by squares outside the whiskers. SUV = standardized uptake value.
FIGURE 5.
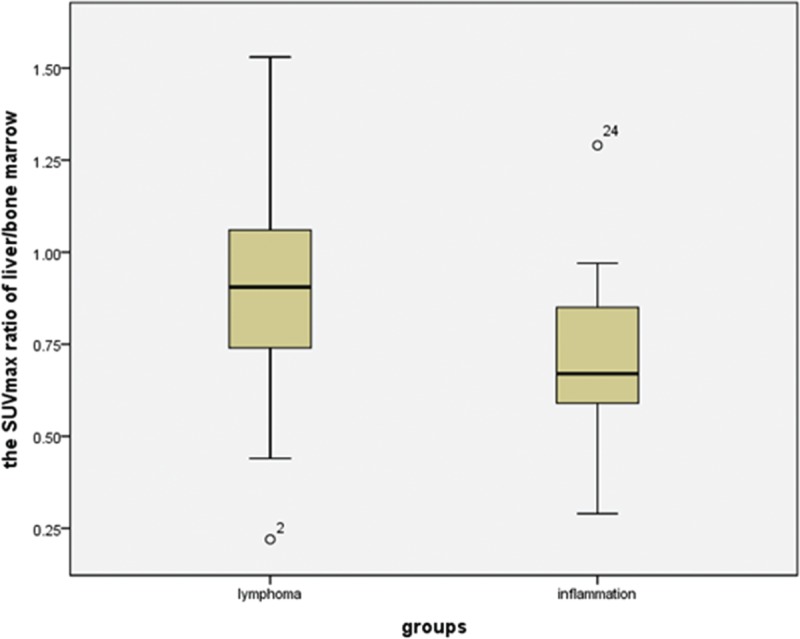
Box plots showing distribution of the maximum SUV ratio of liver/bone marrow among patients with lymphoma and inflammation. The box represents the lower and upper quartiles, and the median is marked with a horizontal line inside the box. The whiskers are the 10th and 90th percentiles with outlying observations individually plotted by squares outside the whiskers. SUV = standardized uptake value.
FIGURE 6.
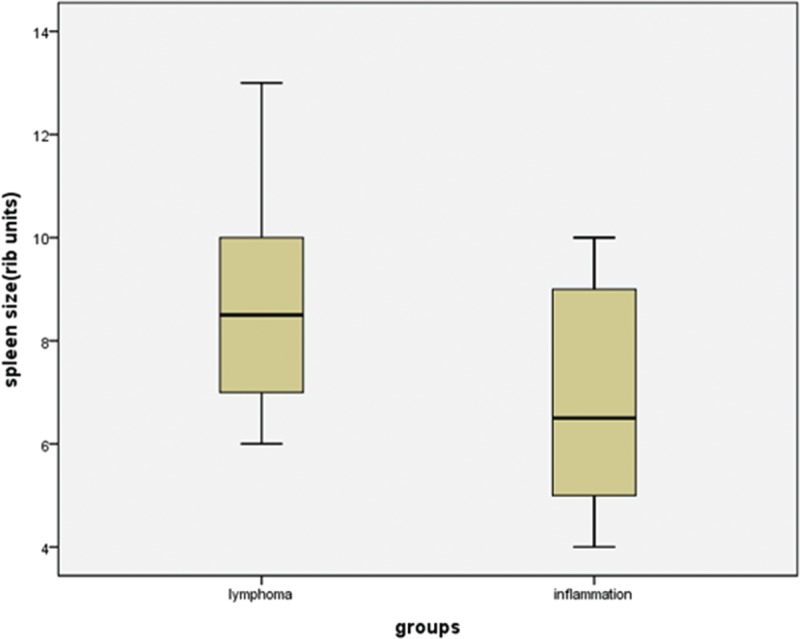
Box plots showing distribution of the spleen size among patients with lymphoma and inflammation. The box represents the lower and upper quartiles, and the median is marked with a horizontal line inside the box. The whiskers are the 10th and 90th percentiles.
The 18F-FDG uptake values in the spleen were greater than those in the liver for 12 of the 14 inflammation patients (Figure 7), and the SUVmax ratio between the spleen/liver was 1.44 ± 0.48 (95% CI: 1.16, 1.71; Figure 3). The 18F-FDG uptake values in the spleen were greater than those in the bone marrow in 5 of the 14 patients, and the SUVmax ratio between the spleen/bone marrow was 0.94 ± 0.23 (95% CI: 0.81, 1.07; Figure 4). The 18F-FDG uptake value in the liver was greater than those in the bone marrow for only 1 patient, and the SUVmax ratio of the liver/bone marrow was 0.71 ± 0.25 (95% CI: 0.57, 0.86;Figure 5). The spleen sizes of 8 inflammation patients were >5 rib units, and the average spleen size was 6.79 ± 2.01 rib units (95% CI: 5.63, 7.94; Figure 6). Using Student t test, the differences of the SUVmax ratios between the spleen/liver and the liver/bone marrow between the lymphoma and inflammation groups were not significant (t = 0.853, P = 0.401 > 0.05; t = 1.622, P = 0.115 > 0.05). Box plots for the SUVmax ratios of the spleen/bone marrow and the spleen sizes of the lymphoma and inflammation groups are shown in Figures 4 and 6. The SUVmax ratios of the spleen/bone marrow were significantly different between the 2 groups (t = 2.426, P = 0.021 < 0.05). The spleen sizes were also significantly different between the 2 groups (t = 2.911, P = 0.007 < 0.05).
FIGURE 7.
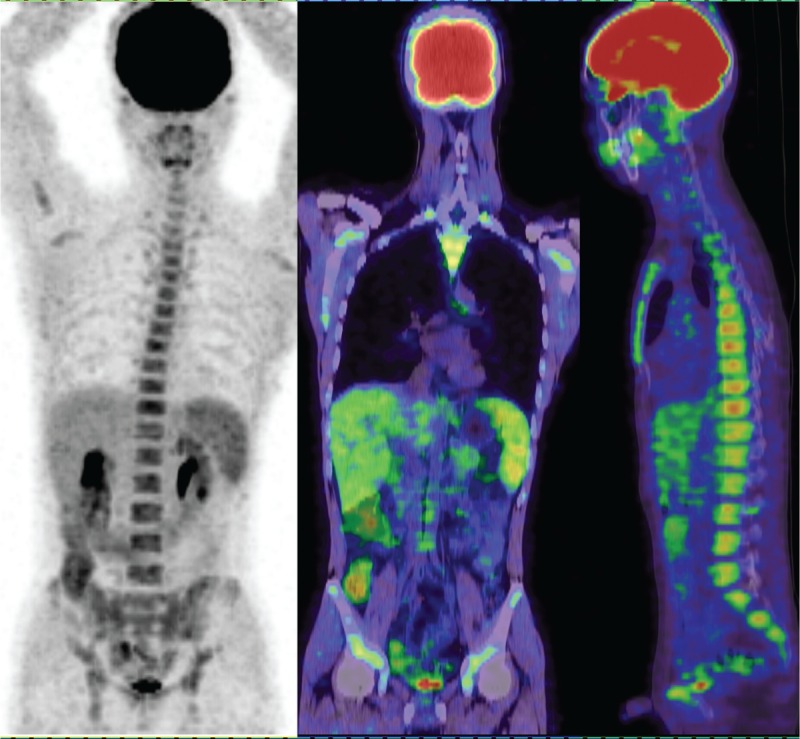
An inflammation patient had high diffuse uptake of 18F-FDG in the spleen, liver, and bone marrow but no increased 18F-FDG uptake in the lymph nodes and no enlarged peripheral lymph node. 18F-FDG = 18F-fluorodeoxyglucose.
In the 18 lymphoma patients, 12 patients had T-cell lymphoma and 6 patients had B-cell lymphoma. In all B-cell lymphoma patients, the 18F-FDG uptakes in the spleen were greater than those in the liver and bone marrow. In only 3 T-cell lymphoma patients, the 18F-FDG uptakes in the spleen were less than those in the liver. In 5 T-cell lymphoma patients, the 18F-FDG uptakes in the spleen were greater than those in the bone marrow. The minimum and maximum spleen/liver SUVmax ratios of the B-cell lymphomas were 1.50 and 4.90, respectively, and the ratio of the spleen/liver was 2.61 ± 1.31. For the T-cell lymphoma patients, the minimum and maximum spleen/liver SUVmax ratios were 0.79 and 1.94, respectively, and the SUVmax ratio of the spleen/liver was 1.22 ± 0.34. The spleen/bone marrow SUVmax ratio of the B-cell and T-cell lymphomas were 2.47 and 1.82, respectively, and the SUVmax ratios of the spleen/bone marrow were 1.80 ± 0.57 and 1.07 ± 0.35, respectively.
In the 32 patients, 9 lymphoma patients and 7 inflammation patients had effusions. In the 9 lymphoma patients, 1 patient had only pleural effusion, 4 patients had pleural and peritoneal effusions, 3 patients had pleural, peritoneal, and pericardial effusions (Figure 2), and 1 patient had pericardial effusion. For the 7 inflammation patients, 2 patients had pleural effusions, 1 patient had peritoneal effusion, 1 patient had both pleural and peritoneal effusions, and 3 patients had both pleural and pericardial effusions (Table 2).
TABLE 2.
Number of Effusions in Lymphoma Group and Inflammation Group

DISCUSSION
There was diffuse increased 18F-FDG uptake in the liver, spleen, and bone marrow, and no apparent lymph node enlargement was frequently observed in the lymphoma and inflammation patients.1,2 PET with 18F-FDG has gained wide acceptance as a very useful imaging method in evaluating a variety of inflammatory and neoplastic diseases.
18F-FDG is a nonspecific tracer for malignant lymphomas.10 Both tumors and inflammatory and infective processes show increased 18F-FDG uptake. Although patients with inflammation and lymphomas can display the diffuse increased uptake of 18F-FDG in the spleen, bone marrow, and liver without apparent lymph node enlargement, a few differences between each group of patients were evident in our study.
The spleen is the largest blood filter and lymphoid organ in the body. It also provides an important role in defense against pathogens.5,6 The increased 18F-FDG uptake of spleen may reflect increased glucose usage of spleen during inflammation. Moreover, diffuse increased 18F-FDG uptake of spleen (without focus) could also reflect lymphoma infiltration in spleen.8
The liver is a unique immunological and anatomical organ through a sinusoidal network and scanned by antigen-presenting cells and lymphocytes. The lymphocyte population of liver is enriched in natural killer T cells and natural killer cells, which play important roles in the first-line immune defense against circulating lymphocyte recruitment, liver injury, and invading pathogens.12 Overall, a diffuse increased 18F-FDG uptake of the liver can be observed in both inflammation and lymphoma. In our study, 14 inflammation patients and 18 lymphoma patients had increased 18F-FDG uptake in the spleen, liver, and bone marrow (Figures 2 and 7).
In normal individuals, the 18F-FDG uptake in the spleen is less than those in the liver and does not change significantly with age.13,14 A greater spleen 18F-FDG uptake than liver uptake considered abnormal.15 In our study, 27 of the 32 patients had greater spleen 18F-FDG uptake than liver uptake. Only 3 patients in the lymphoma group and 2 patients in the inflammation group had lower 18F-FDG uptake in the spleen than in the liver. In the 18 lymphoma patients, the SUVmax ratio between the spleen/liver was 1.69 ± 1.02 (95% CI: 1.18, 2.19; Figure 3). In the 14 inflammation patients, the SUVmax ratio between the spleen/liver was 1.44 ± 0.48 (95% CI: 1.16, 1.71; Figure 3). The SUVmax ratio between the spleen/liver was not significantly different between the 2 groups of patients (t = 0.853, P = 0.401 > 0.05). Therefore, we speculated that the diffuse and increased spleen and liver 18F-FDG uptake may be present in many inflammatory conditions due to the activation of the immune system in the spleen and liver. However, the increased spleen and liver activities in patients do not necessarily indicate the presence of infections or tumors.6
Histologic evidence of lymphomas in the bone marrow has been found in approximately 50% to 80% and 25% to 40% of patients with low-grade and high-grade Non-hodgkin lymphoma (NHL), respectively.16 The reported involvement of the spleen could be up to 44% in the lymphoma cases.17 Furthermore, for 35.4% of individuals with NHL, the spleen was the only subdiaphragmatic location affected in the early lymphoma clinical stages. The accurate staging of lymphoma is necessary or vital to best determine optimal clinical management and follow-up.
In our study, 13 of the 18 lymphoma patients had spleen uptakes of 18F-FDG that were greater than those of the bone marrow, and the SUVmax ratio of the spleen/bone marrow was 1.31 ± 0.13 (95% CI: 1.25, 1.38). However, only 5 of 14 inflammation patients had greater 18F-FDG uptakes in the spleen than in the bone marrow, with the SUVmax ratio of 0.94 ± 0.23 (95% CI: 0.81, 1.07). We found that the SUVmax ratio of the spleen/bone marrow was significantly different between the lymphoma group and the inflammation group (P = 0.021 < 0.05). For the 5 lymphoma patients with lower 18F-FDG uptake in the spleen than in the bone marrow, 4 patients had greater 18F-FDG uptake in the spleen, and only 1 patient showed the opposite result (Figure 4).
In the 18 lymphoma patients, 5 patients had SUVmax ratios of liver/bone marrow and spleen/bone marrow >1. The SUVmax ratio of liver/bone marrow was 0.89 ± 0.34 (95% CI: 0.72, 1.06; Figure 5). In the 14 inflammation patients, the SUVmax ratio of liver/bone marrow was 0.71 ± 0.25 (95% CI: 0.57, 0.86; Figure 5). Although no significant differences were observed between the SUVmax ratios of liver/bone marrow between the lymphoma and inflammation groups (P = 0.115 > 0.05), only 1 patient had an SUVmax ratio of liver/bone marrow >1 and an SUVmax ratio of spleen/bone marrow <1 in the inflammation group. Therefore, if the SUVmax ratios of spleen/bone marrow and liver/bone marrow were both >1, the possibility of lymphoma increased. However, if the SUVmax ratios of spleen/bone marrow and liver/bone marrow were <1, the possibility of lymphoma could not be entirely excluded. Five lymphoma patients had SUVmax ratios of the spleen/bone marrow and liver/bone marrow <1 in our study. The genders and average ages of the 2 groups also showed no significant difference.
Bone marrow biopsy is considered a standard diagnosis for bone marrow diseases but may be limited due to the different patterns of bone marrow involvement or technical issues. In the detection of bone marrow disease, 18F-FDG PET has been proved to be highly sensitive and has additional value over bone marrow biopsies, which can also be used to direct biopsies to focus the sampling sites of routine iliac bone marrow.17–20
The involvement of lymphoma in the spleen frequently occurs as either micronodular or microscopic.21 From CT or MRI scans, the focal hypodensity lesions of affected spleen are rarely observed but are relatively specific for lymphomatous involvement. Enlarged spleens, a more common finding, often contain no evidence of tumors, so splenomegaly is nonspecific lymphomatous involvement.22 In contrast, lymphomatous spleens are frequently found with normal in size.23 Except for the massive enlargement of the organ, the organ size is a poor predictor of tumor involvement. In approximately 60% of all untreated lymphoma cases, benign diseases and mostly lymphocytic hepatic infiltrates have been found with enlarged livers,24 and 30% of all enlarged spleens have been found with nonmalignant causes.25 Ahmann et al26 reported a specificity of 61% and a sensitivity of 38% for the detection of spleen lymphomas on the basis of organ enlargement.
Organ size should not be used to assess whether a spleen indicates lymphoma because the spleen may be enlarged without neoplastic involvement or may be normal in size despite tumor infiltration.27 In our study, the spleen sizes of all lymphoma patients were more than 5 rib units, at 8.83 ± 1.95 rib units (95% CI: 7.86, 9.80; Figure 6). However, in the 14 inflammation patients, the size was 6.79 ± 2.01 rib units (95% CI: 5.63, 7.94); 5 patients had spleen sizes no more than 5 rib units. The maximum spleen size was 13 rib units in the lymphoma group and 10 rib units in the inflammation group. The spleen size between the lymphoma and inflammation groups was significantly different (P = 0.007 < 0.05). For spleen sizes >7.86 rib units and for an SUVmax ratio of spleen/bone marrow more than 1.25, the possibility of lymphoma increases. For spleen sizes <7.94 rib units and for an SUVmax ratio of spleen/bone marrow <1.07, the possibility of inflammation increases.
In our study, 9 lymphoma patients and 7 inflammation patients had effusions. In the 9 lymphoma patients, 1 patient only had pleural effusion; 4 patients had pleural and peritoneal effusions; 3 patients had pleural, peritoneal, and pericardial effusions; and 1 patient only had pericardial effusion. In the 7 inflammation patients, 2 patients had pleural effusion, 1 patient only had peritoneal effusion, 1 patient had pleural and peritoneal effusions, and 3 patients had pleural and pericardial effusions. These observations suggest that a patient with pericardial and pleural effusions but without peritoneal effusion could have inflammation. However, when a patient had pericardial and peritoneal effusions with or without pleural effusion, the possibility of lymphoma was increased. These observations indicate that pericardial effusion and peritoneal effusion are more common in lymphoma cases. Approximately 40% of all patients diagnosed with pneumonia have had an associated pleural effusion.28 However, the number of patients with these subtypes of lymphomas was small. Further studies are necessary to confirm these results.
In the 18 lymphoma patients, 12 patients had T-cell lymphomas and 6 patients had B-cell lymphomas. This may suggest that the diffuse uptake in the spleen and liver without apparent lymph node enlargement is more prone to take place in T-cell lymphomas. This may be due to hepatosplenic T-cell lymphomas (HSTL). These neoplasm cells are usually involved in the spleen, liver, bone marrow, and peripheral blood. In 35.4% of the patients, the spleen was the only subdiaphragmatic location affected in early clinical stages.29
HSTL is a rare form of extranodal disease. On examination, the liver and spleen are enlarged, but no enlarged peripheral lymph nodes are observed.30,31 Up to 20% of HSTL occur during chronic immune suppression, most commonly during prolonged antigenic stimulation or solid organ transplantation.32,33 Splenectomies have been the most common diagnostic procedures. However, this surgical procedure can be avoided if a confident diagnosis has already been attained by means of liver biopsy, bone marrow histology, peripheral blood cytology, or immunocytochemistry.
In our study, for all B-cell lymphoma patients, the 18F-FDG uptakes in the spleen were greater than those in the liver and in the bone marrow. For only 3 T-cell lymphoma patients, the 18F-FDG uptakes in the spleen were less than those in the liver. For 5 T-cell lymphoma patients, the 18F-FDG uptakes in the spleen were greater than those in the bone marrow. The minimum and maximum spleen/liver SUVmax ratios of B-cell lymphomas were 1.50 and 4.90, respectively, and the SUVmax ratio of the spleen/liver was 2.61 ± 1.31. However, the minimum and maximum spleen/liver SUVmax ratios of T-cell lymphoma were 0.79 and 1.94, respectively, and the SUVmax ratio of the spleen/liver was 1.22 ± 0.34. The maximum spleen/bone marrow SUVmax ratio of the B-cell lymphoma and of T-cell lymphoma patients were 2.47 and 1.82, respectively. The SUVmax ratios of the spleen/bone marrow were 1.80 ± 0.57 and 1.07 ± 0.35. Therefore, spleen/liver and spleen/bone marrow SUVmax ratios >1.94 and >1.82, respectively, the possibility of B-cell lymphoma was increased. If the minimum spleen/liver SUVmax ratio was <1.50, the possibility of B-cell lymphoma is low. However, the number of patients with these lymphoma subtypes was small. Further studies are required to confirm the results of these liver and spleen biopsies.
A limitation of this study is that study population included few patients due to the strict inclusion criteria necessary to achieve our main purpose of establishing an optimal protocol for PET-CT methods. Furthermore, we did not have histopathologic confirmations for all detected lesions. A few findings had to be evaluated on the basis of follow-up imaging and clinical data.
In conclusion, 18F-FDG PET is 1 of the most accurate tools for assessing treatment responses and prognoses in lymphomas and is more accurate than clinical indices or traditional anatomic imaging. Our study demonstrated that 18F-FDG PET-CT played a valuable role in differentiating lymphoma and inflammation patients with high diffuse uptake of 18F-FDG in the spleen, liver, and bone marrow without increased 18F-FDG uptake in nonenlarged lymph nodes. Additional attention should be directed to extranodal sites to correctly identify primary systemic (extranodal) forms of lymphomas without apparent lymph node enlargement and without metabolically active lymphadenopathy.
Footnotes
Abbreviations: 18F-FDG = 18F-fluorodeoxyglucose, CT = computer tomography, FOV = field of view, G-CSF = colony-stimulating factor, GMCSF = granulocyte-macrophage colony-stimulating factor, HSTL = hepatosplenic T-cell lymphomas, LOR = line of response, MRI = magnetic resonance imaging, PET = positron emission tomography, PET-CT = positron emission tomography–computer tomography, ROI = region of interest, SUVmax = maximum standardized uptake values.
LR, XW, and ZZ are co-first authors on this work, contributing equally to this work.
This work was supported by Science and Technology Planning Project of Guangdong Province (2012B031800381).
The authors have no conflicts of interest to disclose.
REFERENCES
- 1.Liu Y. Clinical significance of diffusely increased splenic uptake on FDG-PET. Nucl Med Commun 2009; 30:763–769. [DOI] [PubMed] [Google Scholar]
- 2.Herrinton LJ, Liu L, Abramson O, et al. The incidence of hepatosplenic T-cell lymphoma in a large managed care organization, with reference to anti-tumor necrosis factor therapy, Northern California, 2000-2006. Pharmacoepidemiol Drug Saf 2012; 21:49–52. [DOI] [PMC free article] [PubMed] [Google Scholar]
- 3.Even-Sapir E, Lievshitz G, Perry C, et al. Fluorine-18 fluorodeoxyglucose PET/CT patterns of extranodal involvement in patients with non-Hodgkin lymphoma and Hodgkin's disease. Radiol Clin North Am 2007; 45:697–709. [DOI] [PubMed] [Google Scholar]
- 4.Schaefer NG, Hany TF, Taverna C, et al. Non-Hodgkin lymphoma and Hodgkin disease: coregistered FDG PET and CT at staging and restaging—do we need contrast-enhanced CT? Radiology 2004; 232:823–829. [DOI] [PubMed] [Google Scholar]
- 5.Kraal G. Cells in the marginal zone of the spleen. Int Rev Cytol 1992; 132:31–73. [DOI] [PubMed] [Google Scholar]
- 6.De Porto AP, Lammers AJ, Bennink RJ, et al. Assessment of splenic function. Eur J Clin Microbiol Infect Dis 2010; 29:1465–1473. [DOI] [PMC free article] [PubMed] [Google Scholar]
- 7.Paik JY, Lee KH, Choe YS, et al. Augmented 18F-FDG uptake in activated monocytes occurs during the priming process and involves tyrosine kinases and protein kinase C. J Nucl Med 2004; 45:124–128. [PubMed] [Google Scholar]
- 8.Rutherford SC, Andemariam B, Philips SM, et al. FDG-PET in prediction of splenectomy findings in patients with known or suspected lymphoma. Leuk Lymphoma 2008; 49:719–726. [DOI] [PubMed] [Google Scholar]
- 9.Sugawara Y, Fisher SJ, Zasadny KR, et al. Preclinical and clinical studies of bone marrow uptake of fluorine-1-fluorodeoxyglucose with or without granulocyte colony-stimulating factor during chemotherapy. J Clin Oncol 1998; 16:173–180. [DOI] [PubMed] [Google Scholar]
- 10.Jerusalem G, Beguin Y, Fassotte MF, et al. Whole-body positron emission tomography using 18F-fluorodeoxyglucose for posttreatment evaluation in Hodgkin's disease and non-Hodgkin's lymphoma has higher diagnostic and prognostic value than classical computed tomography scan imaging. Blood 1999; 94:429–433. [PubMed] [Google Scholar]
- 11.Zhuang H, Yu JQ, Alavi A. Applications of fluorodeoxyglucose-PET imaging in the detection of infection and inflammation and other benign disorders. Radiol Clin North Am 2005; 43:121–134. [DOI] [PubMed] [Google Scholar]
- 12.Benseler V, Schlitt HJ. The liver as an immunological organ. Z Gastroenterol 2011; 49:54–62. [DOI] [PubMed] [Google Scholar]
- 13.Kotzerke J, Guhlmann A, Moog F, et al. Role of attenuation correction for fluorine-18-fluorodeoxyglucose positron emission tomography in the primary staging of malignant lymphoma. Eur J Nucl Med 1999; 26:31–38. [DOI] [PubMed] [Google Scholar]
- 14.Meier JM, Alavi A, Iruvuri S, et al. Assessment of age-related changes in abdominal organ structure and function with computed tomography and positron emission tomography. Semin Nucl Med 2007; 37:154–172. [DOI] [PubMed] [Google Scholar]
- 15.Rini J, Manalili EY, Hoffman MA, et al. F-18 FDG versus Ga-67 for detecting splenic involvement in Hodgkin's disease. Clin Nucl Med 2002; 27:572–577. [DOI] [PubMed] [Google Scholar]
- 16.Chen YK, Yeh CL, Tsui CC, et al. F-18 FDG PET for evaluation of bone marrow involvement in non-Hodgkin lymphoma: a meta-analysis. Clin Nucl Med 2011; 36:553–559. [DOI] [PubMed] [Google Scholar]
- 17.Bangerter M, Moog F, Buchmann I, et al. Whole body 2-[18F]-fluoro-2-deoxy-d-glucose positron emission tomography for accurate staging of Hodgkin's disease. Ann Oncol 1998; 9:1117–1122. [DOI] [PubMed] [Google Scholar]
- 18.Lister TA, Crowther D, Sutcliffe SB, et al. Report of a committee convened to discuss the evaluation and staging of patients with Hodgkin's disease: Cotswolds Meeting. J Clin Oncol 1989; 7:1630–1636. [DOI] [PubMed] [Google Scholar]
- 19.Pakos EE, Fotopoulos AD, Ioannidis JP. 18FFDG PET for evaluation of bone marrow infiltration in staging of lymphoma: a meta-analysis. J Nucl Med 2005; 46:958–963. [PubMed] [Google Scholar]
- 20.Pelosi E, Penna D, Douroukas A, et al. Bone marrow disease detection with FDG-PET/CT and bone marrow biopsy during the staging of malignant lymphoma: results from a large multicentre study. Q J Nucl Med Mol Imaging 2011; 55:469–475. [PubMed] [Google Scholar]
- 21.Fishman EK, Kuhlman JE, Jones RJ. CT of lymphoma: spectrum of disease. RadioGraphics 1991; 11:647–669. [DOI] [PubMed] [Google Scholar]
- 22.Castellino RA. Hodgkin's disease: practical concepts for the diagnostic radiologists. Radiology 1986; 159:305–310. [DOI] [PubMed] [Google Scholar]
- 23.Partridge S, Timothy A, O’Doherty MJ, et al. 2-Fluorine-18-fluoro-2-deoxy-d glucose positron emission tomography in the pretreatment staging of Hodgkin's disease: influence on patient management in a single institution. Ann Oncol 2000; 11:1273–1279. [DOI] [PubMed] [Google Scholar]
- 24.Skovsgaard T, Brinckmeyer LM, Vesterager L, et al. The liver in Hodgkin's disease—II. Histopathologic findings. Eur J Cancer Clin Oncol 1982; 18:429–435. [DOI] [PubMed] [Google Scholar]
- 25.Castellino RA. Imaging techniques for staging abdominal Hodgkin's disease. Cancer Treat Rep 1982; 66:697–700. [PubMed] [Google Scholar]
- 26.Ahmann DL, Kiely JM, Harrison EG, Jr, et al. Malignant lymphoma of the spleen. A review of 49 cases in which the diagnosis was made at splenectomy. Cancer 1966; 19:461–469. [DOI] [PubMed] [Google Scholar]
- 27.Warshauer DM. Splenic sarcoidosis. Semin Ultrasound CT MR 2007; 28:21–27. [DOI] [PubMed] [Google Scholar]
- 28.Chapman SJ, Davies RJ. Recent advances in parapneumonic effusion and empyema. Curr Opin Pulm Med 2004; 10:299–304. [DOI] [PubMed] [Google Scholar]
- 29.Rueffer U, Sieber M, Josting A, et al. Prognostic factors for subdiaphragmatic involvement in clinical stage I–II supradiaphragmatic Hodgkin's disease: a retrospective analysis of the GHSG. Ann Oncol 1999; 10:1343–1348. [DOI] [PubMed] [Google Scholar]
- 30.Macon WR, Levy NB, Kurtin PJ, et al. Hepatosplenic alphabeta T-cell lymphomas: a report of 14 cases and comparison with hepatosplenic gammadelta T-cell lymphomas. Am J Surg Pathol 2001; 25:285–296. [DOI] [PubMed] [Google Scholar]
- 31.Cooke CB, Krenacs L, Stetler-Stevenson M, et al. Hepatosplenic T-cell lymphoma: a distinct clinicopathologic entity of cytotoxic gamma delta T-cell origin. Blood 1996; 88:4265–4274. [PubMed] [Google Scholar]
- 32.Salhany KE, Feldman M, Peritt D, et al. Cytotoxic T-lymphocyte differentiation and cytogenetic alterations in gammadelta hepatosplenic T-cell lymphoma and posttransplant lymphoproliferative disorders. Blood 1997; 89:3490–3491. [PubMed] [Google Scholar]
- 33.Roelandt PR, Maertens J, Vandenberghe P, et al. Hepatosplenic gam-madelta T-cell lymphoma after liver transplantation: report of the first 2 cases and review of the literature. Liver Transplant 2009; 15:686–692. [DOI] [PubMed] [Google Scholar]


