Abstract
This study evaluated the frequency, timing, and characteristics of flares in a large cohort of Italian patients with biopsy-proven giant cell arteritis (GCA) and to identify factors at diagnosis able to predict the occurrence of flares. We evaluated 157 patients with biopsy-proven transmural GCA diagnosed and followed at the Rheumatology Unit of Reggio Emilia Hospital (Italy) for whom sufficient information was available from the time of diagnosis until at least 4 years of follow-up. Fifty-seven patients (36.5%) experienced ≥1 flares. Fifty-one (46.4%) of the 110 total flares (88 relapses and 22 recurrences) were experienced during the first 2 years after diagnosis. The majority of relapses occurred with doses of prednisone ≤ 10 mg/day (82.9%), whereas only 3.4% of relapses occurred for doses ≥ 25 mg/day. Polymyalgia rheumatica (46.5%) and cranial symptoms (41.9%) were the most frequent manifestations at the time of the first relapse. Cumulative prednisone dose during the first year and total cumulative prednisone dose were significantly higher in flaring patients compared with those without flares (7.8 ± 2.4 vs 6.7 ± 2.4 g, P = 0.02; 15.5 ± 8.9 vs 10.0 ± 9.2 g, P = 0.0001, respectively). The total duration of prednisone treatment was longer in flaring patients (58 ± 44 vs 30 ± 30 months, P = 0.0001).
Patients with disease flares had at diagnosis more frequently systemic manifestations (P = 0.02) and fever ≥ 38°C (P = 0.02), significantly lower hemoglobin levels (P = 0.05), more frequent presence at temporal artery biopsy (TAB) specimens of giant cells (P = 0.04) and intraluminal acute thrombosis (P = 0.007), and more moderate/severe arterial inflammation (P = 0.009) compared with those without flares. In the multivariate model fever ≥ 38 °C (hazard ratio 2.14; 95% confidence interval, 1.06–4.32, P = 0.03) and the severity of inflammatory infiltrate (moderate/severe versus mild) (hazard ratio 5.41; 95% confidence interval, 1.64–17.87, P = 0.006) were significantly associated with an increased risk of flares. In conclusion, a flaring course is common in GCA and it is associated with prolonged GC requirements. Fever at diagnosis and severity of inflammation at TAB appear to predict the development of disease flares.
INTRODUCTION
Giant cell arteritis (GCA) is a large- and medium-vessel vasculitis that mainly involves the thoracic aorta and its branches.1–3 Glucocorticoids (GCs) are the treatment of choice; adequate doses quickly suppress clinical manifestations of GCA and mostly prevent ischemic complications. The duration of GC therapy is variable: in some patients, it can be discontinued within 1 to 2 years, whereas other patients have a chronic relapsing course requiring GCs up to several years.4 Clinical flares have been reported in observational studies as occurring in 34% to 74.5% of the patients and are strictly related to the duration of GC treatment.5–14 Flares are more frequent during the first 2 years of treatment when prednisone dose is reduced to about 5 to 10 mg/day.5,6 GC-related side effects were commonly observed in GCA long-term studies and were associated with the intensity and duration of GC therapy.5,6,8 Identification of predictors of flares can aid to optimize therapeutic strategies, minimizing disease flares and reducing the cumulative GC dose, which is an important risk factor for GC-related side effects. There are limited observations on predictors of disease flares in GCA.5,6,9,10,12 Some studies suggested that a strong systemic inflammatory response at the time of disease diagnosis may predict the development of disease flares in GCA.5,6,10,12
The aim of this study was to evaluate the frequency, timing, and characteristics of flares (relapses and recurrences) in a large cohort of Italian patients with biopsy-proven GCA diagnosed between 1986 and 2007 and followed up for at least 4 years. In addition, we evaluated the usefulness of clinical, laboratory parameters, and comorbidities at diagnosis, as well as temporal artery histopatological findings as predictors of flares.
PATIENTS AND METHODS
Patients
We reviewed the computerized pathology laboratory's register, which keeps a record of all temporal artery biopsies (TABs) performed in Reggio Emilia (Italy) at the Arcispedale Santa Maria Nuova Hospital between January 1, 1986 and December 31, 2007. The positive specimens were reviewed by a pathologist (AC) with expertise in vasculitis.
Patients were diagnosed as having biopsy-proven GCA if the histological examination of the TAB showed transmural infiltration of mononuclear cells in the arterial wall with or without giant cells. TAB procedures in Reggio Emilia have been described elsewhere.15,16 TAB was routinely performed in all patients with clinical manifestations of GCA. The length of TAB was ≥0.5 cm in all cases. We included only those patients diagnosed and followed by our Department of Rheumatology for whom sufficient information was available from the time of diagnosis until at least 4 years of follow-up. A total of 157 patients satisfied the inclusion criteria and were included in the study. Although this study is retrospective, all patients were uniformly evaluated and treated. In this cohort study, we followed the Strengthening the Reporting of Observational Studies in Epidemiology (STROBE) recommendations for reporting descriptive observational studies.17 The study was approved by the local Ethics Committee.
All medical records of these 157 patients were reviewed. Besides demographic features and comorbid conditions (hypertension, diabetes mellitus, hypercholesterolemia, hypertriglyceridemia, and smoking status),15 the following clinical data at the time of diagnosis were assessed: headache, abnormal temporal arteries on physical examination, scalp tenderness, jaw claudication, carotidodynia, visual manifestations (transient visual loss including amaurosis fugax, permanent visual loss, and diplopia), cerebrovascular accidents (stroke and/or transient ischemic attack), systemic signs/symptoms (at least one of the following: asthenia, anorexia, weight loss of at least 4 kg, or fever), fever ≥ 38°C, polymyalgia rheumatica (PMR) (bilateral marked aching and stiffness without other apparent cause in at least 2 of the following regions: neck, shoulder girdle, and hip girdle), and distal musculoskeletal manifestations.
Laboratory parameters were measured before the onset of GC therapy and during the follow-up. Erythrocyte sedimentation rate (ESR) was determined using the Westergren method (since most of our patients were women older than 50 years, the upper limit of normal considered for ESR was 30 mm/h). C-reactive protein (CRP) was measured by nephelometry (NA latex CRP kit; Behringwerke, Marburg, Germany; upper limit of the normal reference range 0.5 mg/dL). Hemoglobin levels (anemia if ≤ 12 g/dL) and platelet count (elevated if ≥ 450,000 mm3) were also considered.
The pathologist (AC) evaluated the following pathological findings in temporal artery biopsy specimens: presence of giant cells, intraluminal acute thrombosis, laminar necrosis, calcifications, and intimal thickening. He also categorized the degree of inflammation present in temporal artery specimens as mild, moderate, and severe (Figure 1).18 All patients with visual loss at diagnosis or during the follow-up period were examined by an ophthalmologist (LC). Visual acuity was measured using a Snellen chart, and visual field was tested with a Goldmann perimeter.
FIGURE 1.
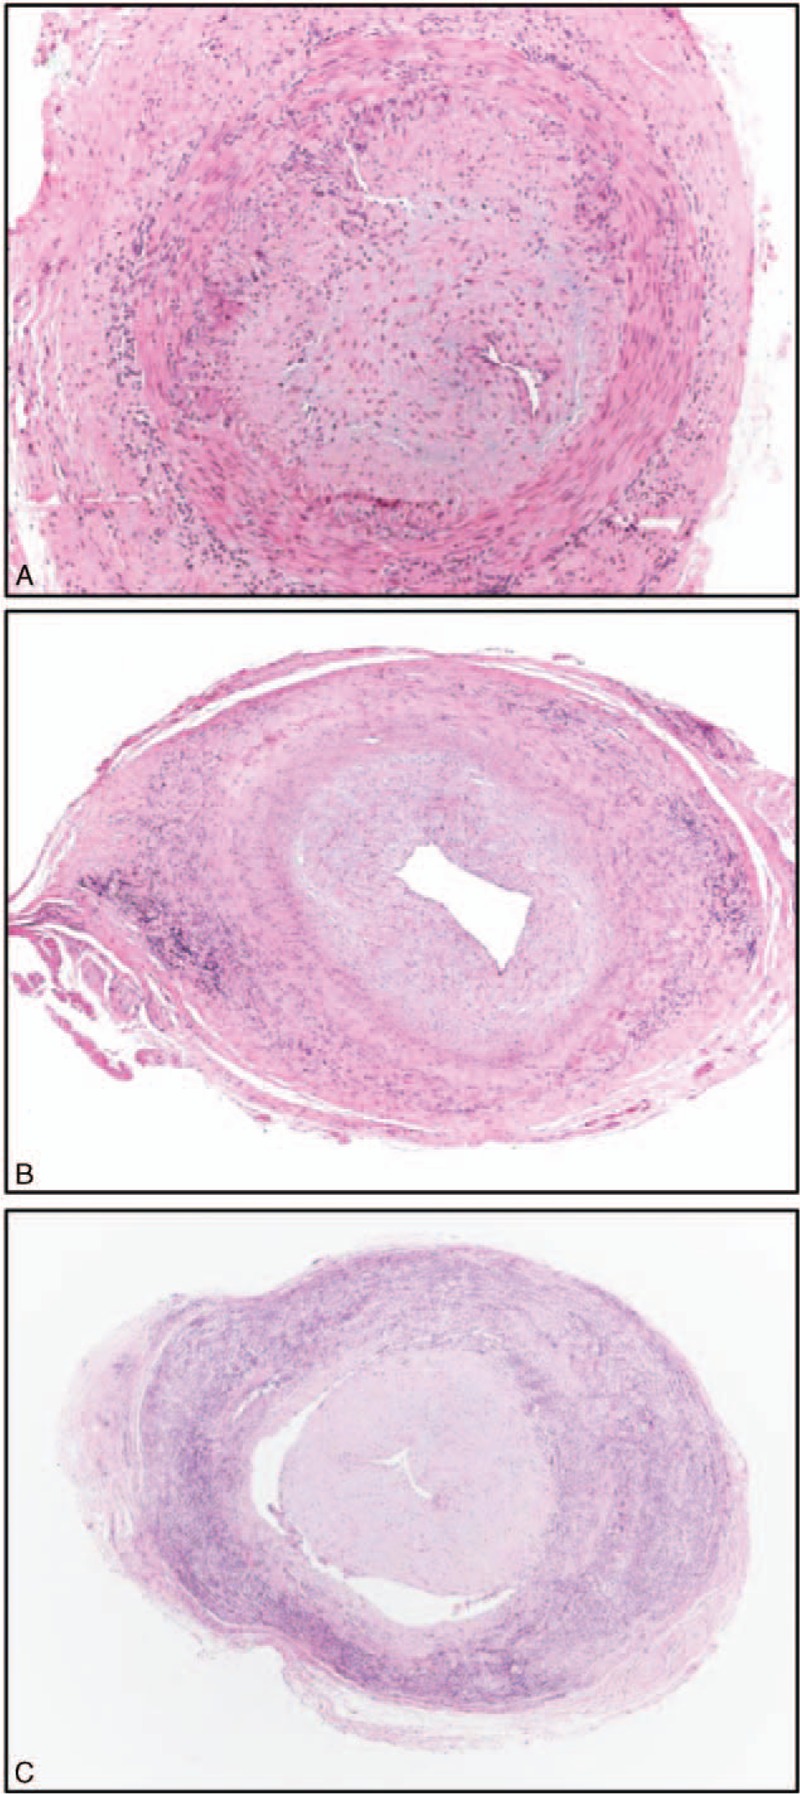
Different intensity of transmural inflammation in temporal artery biopsy specimens: mild (A), moderate (B) and severe (C). (A) Hematoxylin-Eosin, 40×; (B,C) Hematoxylin-Eosin, 20×.
All patients with GCA were initially treated with prednisone (40–60 mg/day). Some patients with visual ischemic manifestations also received intravenous pulses of methylprednisolone (1 g/day for 3 consecutive days) followed by prednisone 60 mg/day. The initial dose of prednisone was maintained for the first month, then the dosage was reduced by 5 mg every 2 to 4 weeks to 20 mg/day. Subsequently, the reduction of prednisone dose <20 mg/day was slower and individualized. Generally, prednisone was reduced by 2.5 mg every 2 to 4 weeks to 10 mg and then by 1 mg every 1 to 2 months until suspension, provided no relapses occurred. If relapses occurred, prednisone dose was increased by 10 to 15 mg/day above the previous effective dose, whereas in the event of recurrences, prednisone dosage 10 to 15 mg/day was reinitiated. If asymptomatic increases in acute-phase reactants were detected, prednisone dose was held until the next visit.
In 4 patients, methotrexate (10–15 mg/week) was associated to GCs as initial treatment.
Disease-related signs/symptoms, ESR and CRP levels, and GC dosages were recorded at every follow-up visit (scheduled in most of the patients every 3 months). Cumulative prednisone dose received after 1 year, as well as the total cumulative prednisone dose received during the entire study period, was calculated.
We diagnosed disease flares if all the following criteria were satisfied: reappearance of signs/symptoms of GCA/PMR, resolution of signs/symptoms after increasing or restarting GC, ESR ≥40 mm/h or CRP ≥0.5 mg/day, and exclusion of other causes. Flares occurring during the course of GC treatment were considered relapses, whereas flares occurring at least 1 month after GC withdrawal were considered recurrences.
In case of asymptomatic increases of ESR and/or CRP, the dosage of GC was maintained stable until the next visit, other eventual causes for such increases were investigated, and the dosage of GC was increased only if a clinical flare was documented.
Long-term remission was defined as permanent discontinuation of prednisone without recurrence of symptoms and elevation of inflammatory markers for at least 1 year.
Statistical Analysis
Continuous data were described as mean and standard deviation (mean ± SD) or median and interquartile range (IQR), and categorical variables as absolute frequencies and percentages. Continuous variables were compared by using t test or Mann-Whitney U test when the distributions were skewed. Comparison of categorical variables was performed by using χ2 or Fischer exact test. Differences in ESR, CRP values, and prednisone dose at the time of flare and time from diagnosis to flare among groups have been tested by means of analysis of variance.
Cox proportional hazards model was used to estimate potential predictors (demographic, clinical, laboratory, pathological findings, and comorbidities) of relapse/recurrence assessed at diagnosis. Hazard ratios (HRs) and 95% confidence intervals (CIs) were computed for each predictor in the univariate analysis and in the multivariate model using the backward stepwise approach (P = 0.10 for removal, P = 0.05 for addition to the model).
Probabilities of no flares (relapses or recurrences) of the disease were estimated by Kaplan-Meier survival curve, considering time at first flare as time of failure, and time at the end of study or death as time at censorship (if the patient had not suffered any relapse or recurrence of the disease).
Time required to achieve maintenance prednisone dose <10 mg/day, <5 mg/day, and time to treatment discontinuation were estimated with the Kaplan-Meier method, and log-rank test was used to compare time between patients with and without flares.
All test were 2-sided; significance was defined at P < 0.05. Statistical analysis was performed using SPSS version 22.0 (IBM Statistics, IBM Corp, Armonk, NY).
RESULTS
The study population consisted of 157 patients: 123 (78%) females and 34 (22%) males. Mean (±SD) age at diagnosis of GCA was 74 ± 7.9 years and median follow-up 80 months (range 49–125 months).
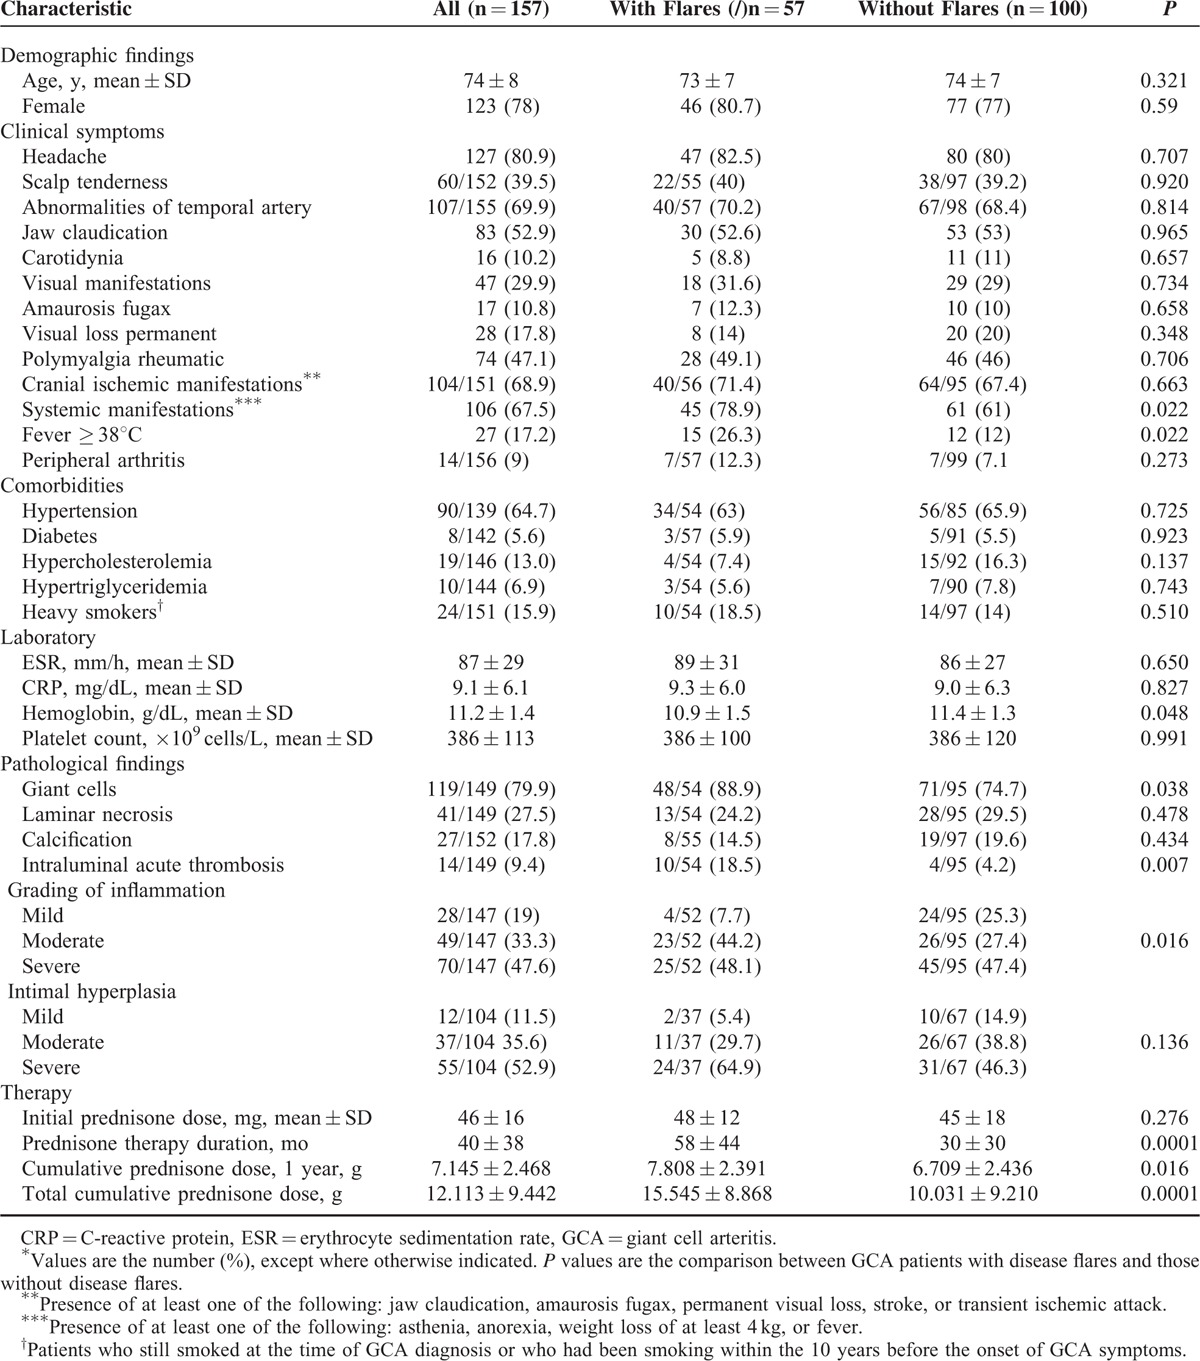
Demographic, clinical, laboratory, pathologic findings, and comorbidities at diagnosis are shown in Table 1.
TABLE 1.
Demographic, Clinical, Laboratory, and Histological Findings and Comorbidities at Diagnosis of 157 Patients With Temporal Artery Biopsy-Proven GCA and Comparisons of Findings Between Patients With and Without Disease Flares∗
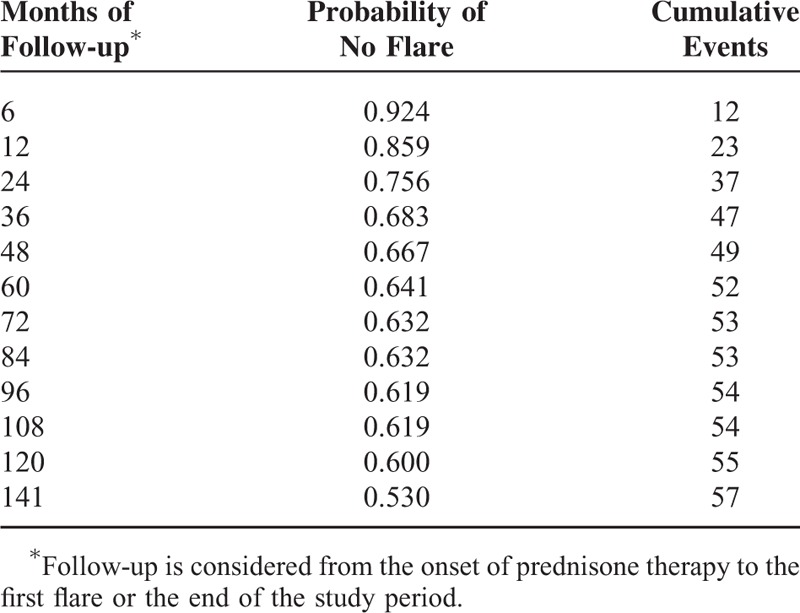
Fifty-seven patients (36.5%) had at least 1 flare (relapse and/or recurrence) during the follow-up, median 1 flare (range 1–7). Twenty-nine patients (18.4%) had at least 2 flares. Forty-one patients experienced relapses (total number of relapses: 88), whereas 16 had recurrences (total number of recurrences: 22). Thirty (27.3%) of the 110 flares were experienced during the first year after diagnosis. Figure 2 shows Kaplan-Meier estimate of the probability of flare as a function of months from diagnosis, whereas Table 2 shows Kaplan-Meier estimates for the probability of no flare.
FIGURE 2.
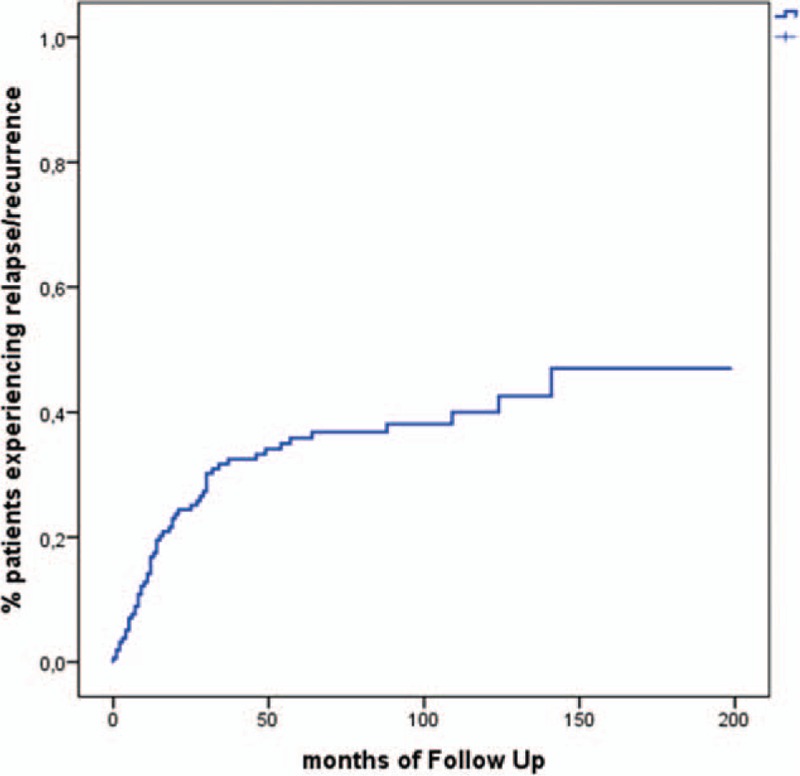
Kaplan-Meier estimate of the probability of flare (relapse or recurrence) over time.
TABLE 2.
Kaplan-Meier Estimates for the Probability of No Disease Flares (Relapses or Recurrences)
The majority of relapses occurred with prednisone dosages ≤ 10 mg/day (73/88: 82.9%), whereas the patients rarely relapsed for doses of prednisone ≥ 20 mg/day (6/88: 6.8%), and ≥ 25 mg/day (3/88: 3.4%). The most frequent clinical manifestation in the patients who relapsed at a dosage of prednisone ≤ 10 mg/day was PMR (49/73, 67.1%), followed by cranial symptoms (15/73, 20.5%), systemic symptoms (11/73, 15.1%), and large vessel vasculitis (LVV) (5/73, 6.8%). PMR was significantly more frequent in patients who relapsed at a dose of prednisone ≤ 10 mg/day compared with those who relapsed at a prednisone dose >10 mg/day) (67.1% vs 6.7%, P = 0.0001), whereas cranial symptoms were statistically less frequent in patients who relapsed at a prednisone dose ≤ 10 mg/day (20.5% vs 66.7%, P = 0.001).
Table 3 shows the distribution of flare types, ESR and CRP levels at time of flare, prednisone dose at time of flare, time from diagnosis to flare, and percentage of patients flaring per year of follow-up. The main clinical manifestation observed during flares was PMR (57.3), followed by cranial symptoms (27.3%). Only 1 patient developed a severe ischemic complication (permanent visual loss because of anterior ischemic optic neuropathy) 13 months after GCA diagnosis, while she was on prednisone 12.5 mg/day. Three patients flared with symptomatic large vessel involvement: 1 developed a pulsating mass in the right parasternal area with evidence of inflammatory ascending aorta aneurysm, 1 a decreased right brachial artery pulse with evidence of right subclavian artery stenosis, and 1 right lower limb (sural) claudication with evidence of occlusion of the right superficial femoral artery. In all these 3 patients, 18F-FDG positron emission tomography (FDG-PET) showed active LVV. The patient with ascending aorta aneurysm had a second flare 22 months after the first characterized by elevated inflammatory markers and recurrence of active LVV at FDG-PET. Five other patients had evidence of LVV at FDG-PET when they flared. All these 5 patients had persistently elevated acute phase reactants and 4 associated clinical manifestations (2 headache, 1 PMR, and 1 wrist arthritis). Prednisone was increased or restarted in all 9 flares with evidence of LVV at FDG-PET. ESR and CRP were elevated before the flare and subsequently normalized.
TABLE 3.
Main Characteristics and Timing of Flares in 110 Flares (Relapses or Recurrences)∗
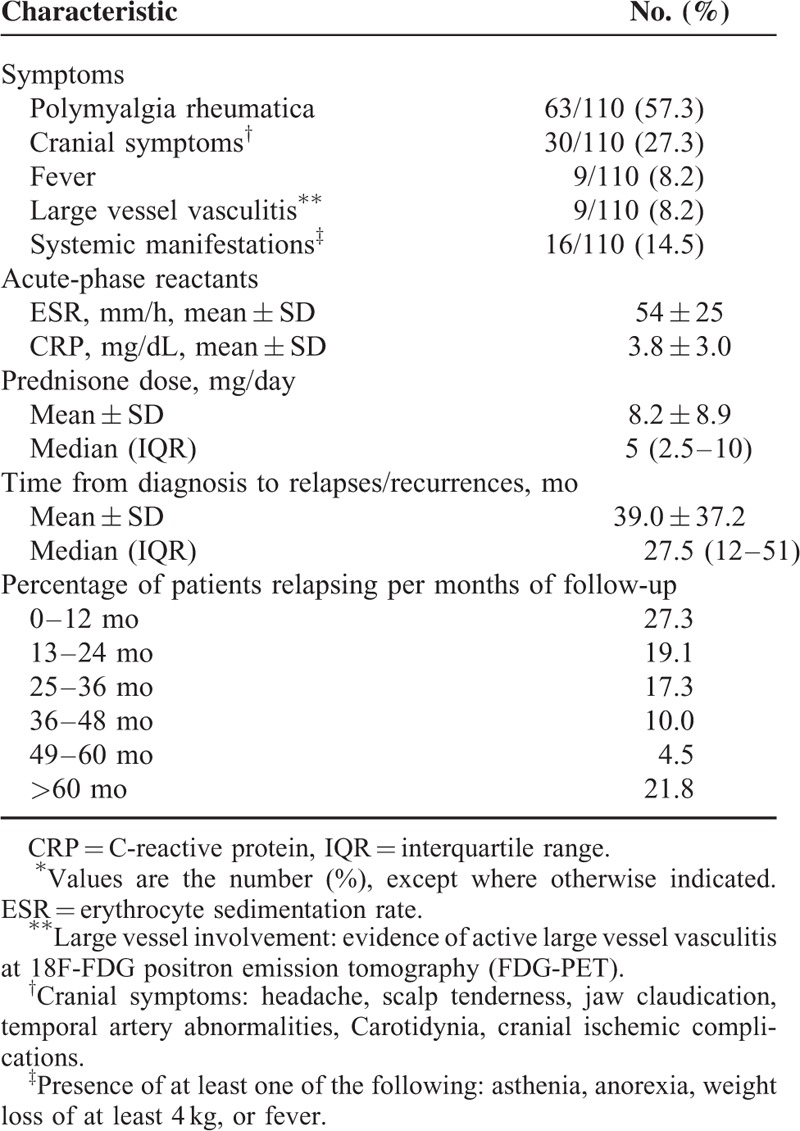
Mean ± SD of ESR and CRP at time of flare were 54 ± 25 mm/h and 3.8 ± 3 mg/dL, respectively. Mean prednisone dose at time of flare was 8.2 ± 8.9 mg/day with a median of 5 mg/day (IQR, 2.5–10 mg/day).
Table 4 shows the main clinical and laboratory data at time of the first relapse. Polymyalgia rheumatica (46.5%) was the most common finding followed by cranial symptoms (41.9%). The patient with permanent visual loss developed this complication at the first flare. One patient had LVV at FDG-PET performed for persistently elevated ESR and CRP levels. The mean ESR and CRP values at time of the first relapse were 53 ± 23 mm/h and 4.4 ± 3.0 mg/dL, the mean prednisone dose was 10.7 ± 11.4 mg/day, with a median of 8.2 mg/day (IQR, 2.8–12.5 mg. Mean time to first relapse was 14.5 ± 11.8 months with a median of 12 months (IQR, 6.0–18 months).
TABLE 4.
Main Characteristics at Time of First Relapse in 43 Patients With Biopsy-proven GCA∗
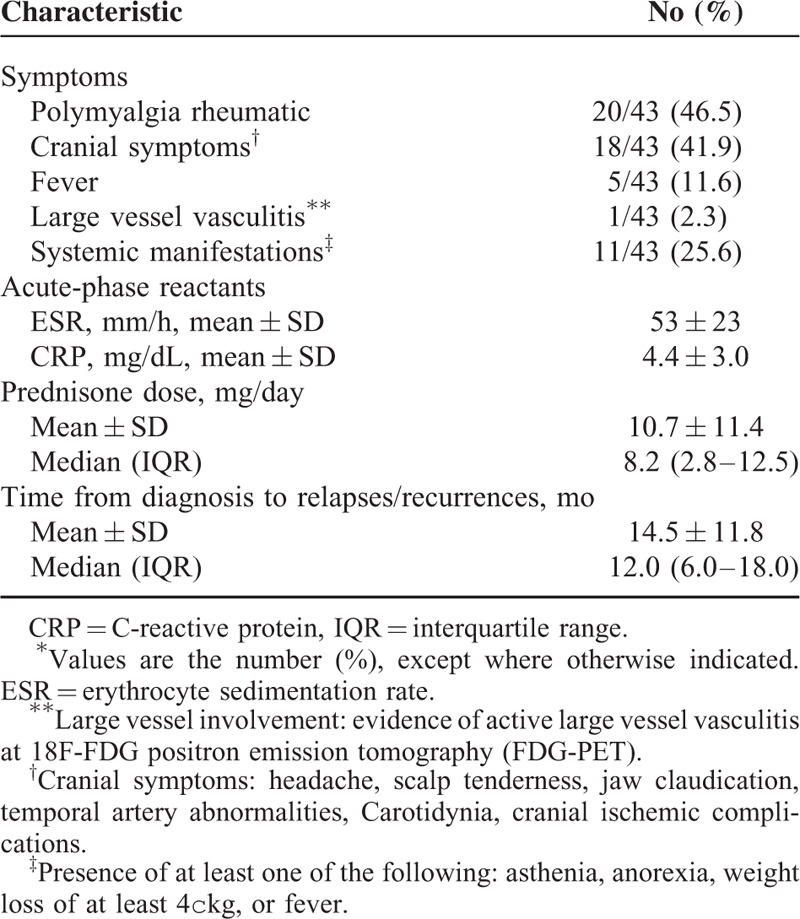
Table 5 compares the main clinical and laboratory data at time of relapse and at time of recurrence. The frequencies of the main clinical manifestations were similar, whereas the mean ESR and CRP values at time of relapse were higher compared with those observed at time of recurrence (56 ± 27 vs 49 ± 17 mm/h, and 4.0 ± 3.0 vs 2.7 ± 2.9 mg/dL, respectively), although the differences were not statistically significant.
TABLE 5.
Main Characteristics and Timing of Relapses and Recurrences in 88 Relapses and 22 Recurrences∗
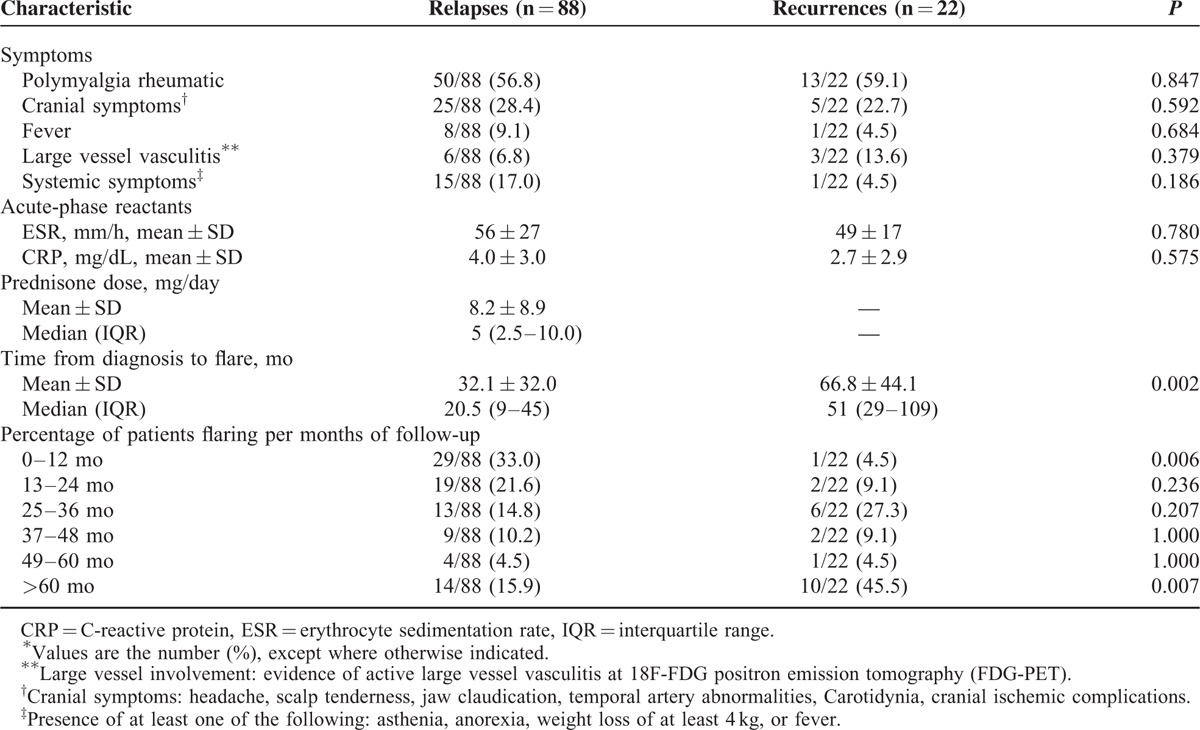
Time from diagnosis to flare was significantly higher in recurrences compared with relapses (66.8 ± 44.1 vs 32.1 ± 32.0 months, P = 0.002) because relapses occurred prevalently in the first year of follow-up (33% vs 4.5%, P = 0.006) and recurrences after 5 years of follow-up (45.5% vs 15.9%, P = 0.007).
Table 1 shows the initial prednisone dose, the therapy duration, and 1st year and total cumulative prednisone doses in patients with and without flares. The initial prednisone dosage was not different in patients with and without flares (48 ± 12 vs 45 ± 18 mg/day), whereas the therapy duration (58 ± 44 vs 30 ± 30 months, P = 0.0001), the cumulative dose at 1 year (7.808 ± 2.391 vs 6.709 ± 2.436 g, P = 0.016), and the total cumulative prednisone dose (15.545 ± 8.868 vs 10.031 ± 9.210 g, P = 0.0001) were significantly higher in patients with flares.
Table 6 shows the prednisone dose and ESR and CRP values at the time of relapse at different follow-up times. There was a progressive reduction of the prednisone dose over time (from 13.7 ± 12.0 mg/day for the relapses occurring during the first year of therapy to 2.3 ± 1.3 mg/day for the relapses occurring during the 5th year of treatment), whereas ESR and CRP values remained stable over time.
TABLE 6.
Prednisone Dose and ESR and CRP Levels at the Time of Relapse at Different Follow-Up Times∗
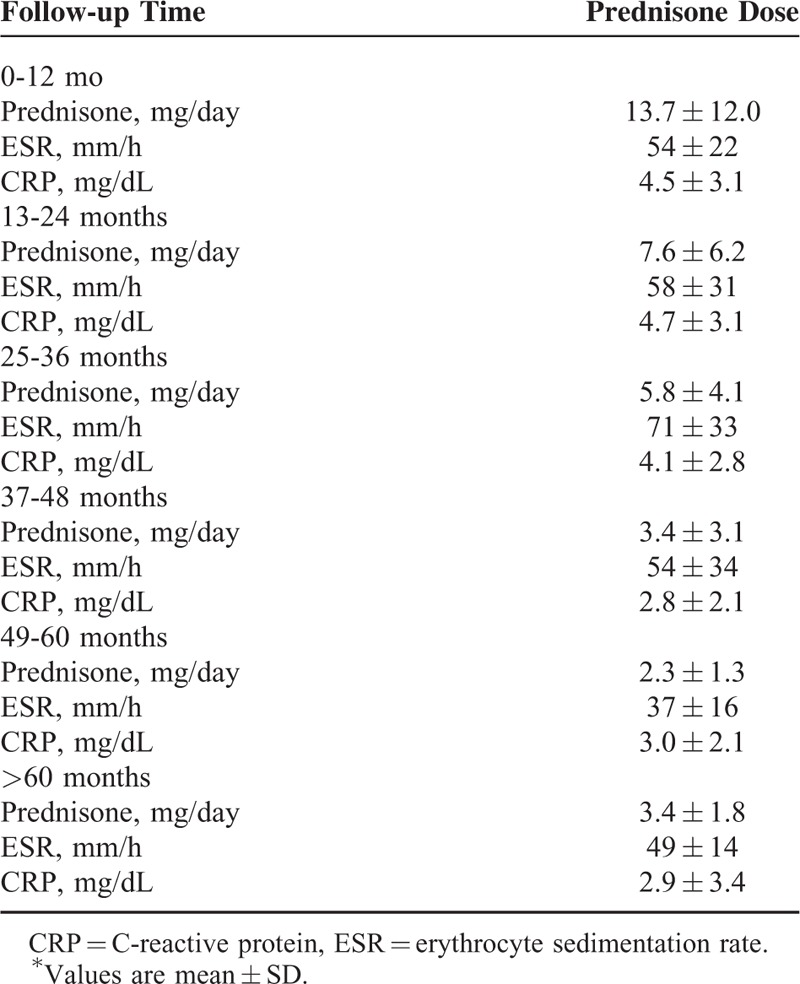
Table 7 shows the laboratory characteristics and prednisone dose at each flare type.
TABLE 7.
Laboratory Characteristics and Prednisone Dose at Each Flare Type∗
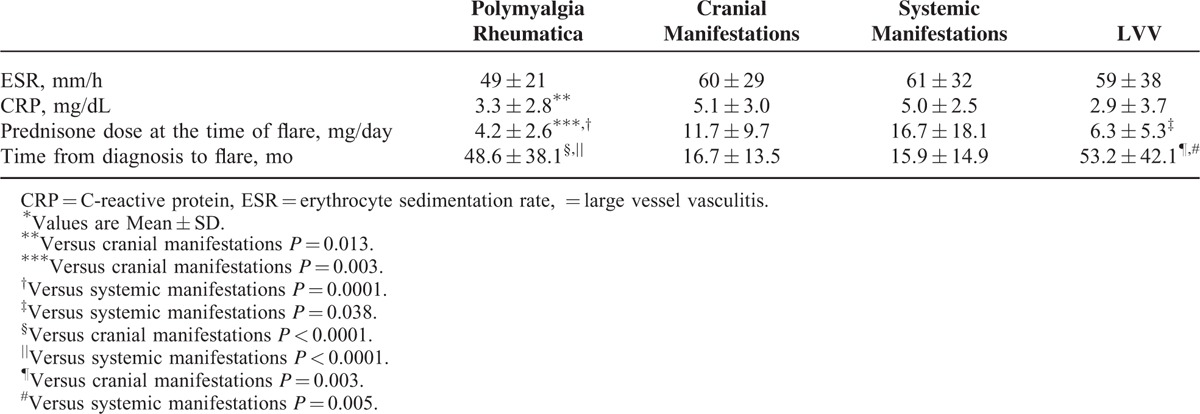
CRP levels at the time of flare were lower in PMR flares compared with the flares characterized by cranial manifestations (P = 0.013). Prednisone dose at the time of flare was significantly lower in PMR flares compared with the flares characterized by cranial symptoms (P = 0.003) or systemic manifestations (P < 0.0001), whereas flares presenting with systemic manifestations were associated with higher prednisone dose at the time of flare compared with those presenting with LVV (P = 0.038). Time from diagnosis to flare was longer in flares characterized by PMR or LVV compared with those characterized by cranial manifestations (P < 0.0001 and P = 0.003, respectively) or systemic manifestations (P < 0.0002 and P = 0.005, respectively).
Time required to achieve a maintenance prednisone dose <10 mg/day, <5 mg/day and time to treatment suspension were compared between patients with and without flares using the Kaplan-Meier survival analysis method (Figure 3).
FIGURE 3.
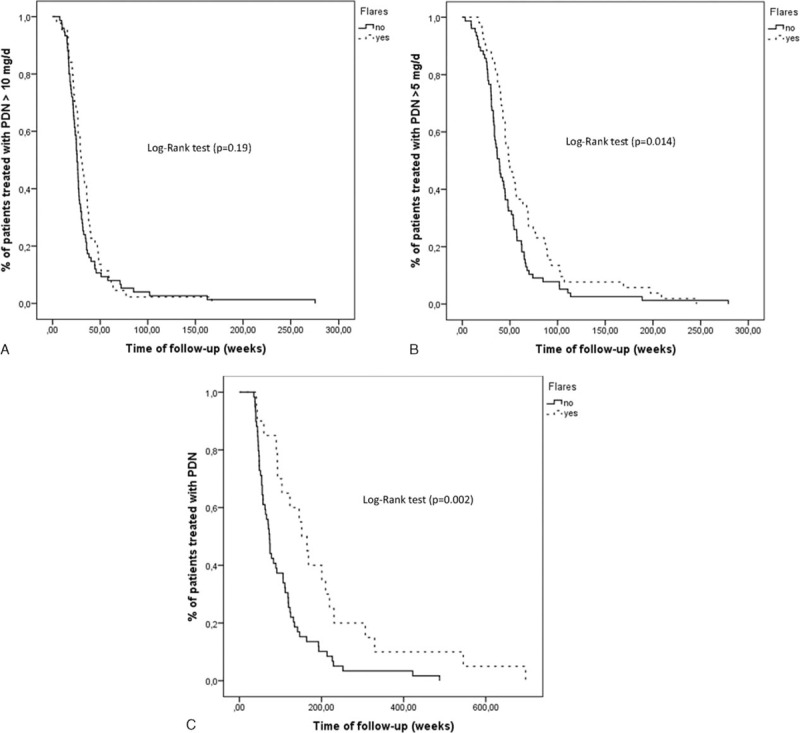
(A) Survival curve showing the time required to reach a maintenance prednisone dose <10 mg/day in patients with (broken line) and without (solid line) flares. The median time in patients with flares was 30 weeks (95% confidence interval [CI]: 25.7–34.3 weeks), whereas in patients without flares was 25.7 weeks (95% CI: 24.0–27.5 weeks) (P = 0.19). (B) Survival curve showing the time required to reach a maintenance prednisone dose <5 mg/day in patients with (broken line) and without (solid line) flares. The median time in patients with flares was 48 weeks (95% CI: 40.6–56.8 weeks), whereas in patients without flares was 38.9 weeks (95% CI: 33.7–44.0 weeks) (P = 0.014). (C) Survival curve showing the time required to reach a stable dose of prednisone 0 mg/day in patients with (broken line) and without (solid line) flares. The median time in patients with flares was 151.9 weeks (95% CI: 109.9–193.8 weeks), whereas in patients without flares was 73.3 weeks (95% CI: 64.2–82.3 weeks) (P = 0.002).
Patients with flares required significantly longer periods of time to reach a maintenance dose of prednisone <5 mg/day (P = 0.014) (Figure 3B) and to completely suspend prednisone therapy (P = 0.002) (Figure 3C).
Predictive Factors of Flare
Table 1 compares the demographic, clinical, laboratory, histological findings, and comorbidities between patients with and without flares.
At disease onset, fever ≥ 38°C and systemic manifestations were more frequently observed in flaring patients (P = 0.022). No differences in the 2 groups were observed for the considered comorbidities. Acute-phase reactants levels at diagnosis were similar in patients with or without flare, whereas hemoglobin levels were significantly lower in patients with flares (P = 0.048). The TAB specimens of the patients with flares had a significantly higher frequency of giant cells (P = 0.038) and intraluminal acute thrombosis (P = 0.007) and they were more inflamed compared with those of patients without flares (P = 0.016). A moderate/severe inflammation in temporal artery was present in 48 of 52 (92.3%) of patients with flares and in 71 of 95 (74.7%) of patients without flares. The difference was statistically significant (P = 0.009). A univariate Cox proportional hazards model was used to assess the association between increased risk of flare and findings at diagnosis (Table 8).
TABLE 8.
Predictive Variables of Flares (Relapses or Recurrences)

The presence of fever (>38°C) (HR 2.02, 95% CI 1.12–3.65), giant cells (HR 2.58, 95% CI 1.10–6.04), intraluminal acute thrombosis (HR 2.54, 95% CI 1.28–5.06), and the severity of inflammatory infiltrate (moderate/severe vs mild) (HR 3.47, 95% CI 1.25–9.65) were significantly associated with an increased risk to develop flares, whereas low hemoglobin levels (HR 0.77, 95% CI 0.62–0.96) were associated with a reduced risk to develop flares. In the multivariate model, only fever ≥ 38°C (HR 2.14, 95% CI 1.06–4.32) and the severity of inflammatory infiltrate (moderate/severe vs mild) (HR 5.41, 95% CI 1.64–17.87) were significantly associated with increased risk of flare.
DISCUSSION
In our study, 36.5% of our patients followed for at least 4 years after the diagnosis of GCA had ≥1 flares. The frequency of flares was overall similar to that reported by Martinez-Lado et al,5 Kermani et al,11 and Liozon et al7 (40.8%, 34%, and 36.2%, respectively), but lower than that reported in 2 other studies.6,8 Alba et al6 and Proven et al8 in their cohorts of patients evaluated a frequency of flares of 64% and 48%, respectively.
These differences are partially related to the different definition of flare. We used a strict definition, considering flare as reappearance of GCA-related clinical manifestations accompanied by elevated ESR and/or CRP that required treatment adjustment. In a recent study from Mayo Clinic, the authors found flares in 74.5% of patients with biopsy-proven GCA; however, 28.6% of flares were related to increased serum inflammatory markers only.9 When flares were identified by the combination of symptoms and abnormal acute-phase reactants, the frequency of flares dropped to 47.2%. In agreement with other observational studies5,6,9 the more frequent clinical manifestations at the time of flare were PMR, headache, and systemic manifestations, whereas symptomatic large-vessel involvement was rarely observed (only 3 patients). We also confirmed previous observations that permanent visual loss is usually observed at diagnosis and very rarely occurs as disease flare after starting GC treatment.5,6,16
Our study also confirmed that flares may occur at any time during the follow-up; however, they were more frequent during the first 2 years (46.4%) after the diagnosis and subsequently became less frequent except after 5 years when most exacerbations were recurrences.5,6 Most flares of GCA (78.2%) occurred within the first 5 years from the diagnosis, as also observed in other observational follow-up studies. Labarca et al9 observed that 79% of first relapses occurred during the first 5 years, whereas in Alba et al's study,6 92% of flares occurred in the first 5 years of follow-up. In keeping with Alba et al's observations,6 we found that over the years, relapses occurred at lower prednisone doses, however, although ESR and CRP values during relapses were lower compared with those observed at disease onset, and the values of acute-phase reactants at the time of relapse over time were stable. Similarly to other studies,5,6 mean time to first relapse was 14.5 ± 11.8 months with median 12 months (IQR, 6–18 months) and first relapses occurred when patients were receiving a mean prednisone dose of 10.7 ± 11.4 mg/day with a median dose of 8.2 mg/day (IQR, 2.8–12.5 mg/day). Previous studies showed that disease flares were rare on prednisone doses >20 mg/day.5,6,11 Kermani et al11 observed that 54% of relapses occurred on daily prednisone dose of 1 to 10 mg. In agreement with these results, we observed that the majority of relapses occurred with prednisone dosages ≤ 10 mg/day (82.9%), whereas only 3 patients relapsed while receiving ≥ 25 mg/day.
We did not find differences in clinical manifestations and acute-phase reactants between relapses and recurrences. We observed that patients with recurrences had a significantly longer time from diagnosis to flare because most of recurrences occurred 5 years after the diagnosis, whereas most of relapses occurred within the first year. As expected, we observed that patients with relapses or recurrences had a longer duration of therapy and a higher cumulative prednisone dose than those who did not have GCA flares. We also evaluated the laboratory characteristics and prednisone dose for each type of flare. Confirming the observations of Alba et al,6 inflammation markers were higher in flares characterized by systemic manifestations, particularly compared with those presenting with PMR. However, we also observed that the prednisone dose at the time of flare was lower in patients flaring with PMR or LVV compared with those flaring with cranial manifestations or systemic disease, whereas the time from diagnosis to flare was longer. These findings indicate that PMR or LVV flares occur later when disease activity progressively decreases and lower prednisone doses are required to maintain remission. Adrenal insufficiency causing PMR-like myalgia has been reported after long-standing GC therapy in GCA, but unlike true flares is not associated with elevated serum inflammatory markers.19,20 Therefore, we emphasize the importance of a strict definition of flares, particularly those characterized by PMR manifestations, because in the absence of an increase in inflammatory markers, the distinction at low GC dosages between symptoms of hypoadrenalism and mild disease activity, especially in retrospective studies, may be difficult.
A major issue in the treatment of patients with GCA is to define predictors that at the time of GCA diagnosis may identify patients at increased risk of flaring. As evidenced by other authors,5,6 we observed that the mean duration of prednisone treatment was longer and 1-year and total cumulative GC doses were higher in patients with flares compared with those without flares. Proven et al8 in a population-based study showed that adverse events associated with GCs occurred in 86% of patients and that a higher cumulative dose of GCs was associated with the development of GC side effects.
Identification of reliable predictors of flares is an important part of the research agenda of GCA because defining optimal treatment strategies may shorten the treatment duration and minimize the cumulative GC burden. Other studies have found that a strong initial systemic inflammatory response and anemia at diagnosis were associated with relapsing disease and prolonged GC therapy.5,6,10,12 In our study, systemic manifestations, fever, and lower hemoglobin levels at diagnosis were significantly more frequent in the patients with flares compared with those without flares. No studies have evaluated the role of pathological findings of TAB as predictors of future flares. We observed that giant cells, intraluminal acute thrombosis, and severity of transmural inflammation were more frequent in patients with flares. In the multivariate model, only fever ≥ 38°C and the severity of inflammation observed at TAB (moderate/severe vs mild) remained significantly associated with an increased risk of flares. Our findings are consistent with previous observations that a strong initial inflammatory response is associated with a flaring disease course and prolonged requirements of GCs.5,6,10,12 Temporal artery biopsy remains the criterion standard for the diagnosis of GCA; however, our data showed that this procedure may also identify patients at diagnosis with more severe disease. Further studies need to confirm our observation.
Our study has several limitations. First, as in all retrospective studies, incomplete datasets may have influenced the findings. Other limitation includes the possibility of referral bias. Strength of the study was the long follow-up duration. Furthermore, selecting only patients diagnosed and treated in the Department of Rheumatology, patients included in the study were uniformly evaluated and treated.
In conclusion, this study confirms that flares are frequent in an Italian cohort of patients with biopsy-proven GCA. Fever and severity of inflammation at TAB examination at diagnosis predict the development of disease flares.
Footnotes
Abbreviations: ANOVA = analysis of variance, CI = confidence interval, CRP = C-reactive protein, ESR = erythrocyte sedimentation rate, FDG-PET = 18F-FDG positron emission tomography, GCA = giant cell arteritis, HR = Hazard Ratio, IQR = interquartile range, LVV = large vessel vasculitis, PMR = polymyalgia rheumatica, TAB = temporal artery biopsy.
GR and LB contributed equally to the project.
The authors report no conflicts of interest.
REFERENCES
- 1.Salvarani C, Cantini F, Boiardi L, et al. Polymyalgia rheumatica and giant-cell arteritis. N Engl J Med 2002; 347:261–271. [DOI] [PubMed] [Google Scholar]
- 2.Salvarani C, Cantini F, Hunder GG. Polymyalgia rheumatica and giant-cell arteritis. Lancet 2008; 372:234–245. [DOI] [PubMed] [Google Scholar]
- 3.Weyand CM, Goronzy JJ. Giant-cell arteritis and polymyalgia rheumatica. N Engl J Med 2014; 371:50–57. [DOI] [PMC free article] [PubMed] [Google Scholar]
- 4.Andersson R, Malmvall BE, Bengtsson BA. Long-term corticosteroid treatment in giant cell arteritis. Acta Med Scand 1986; 220:465–469. [DOI] [PubMed] [Google Scholar]
- 5.Martinez-Lado L, Calvino-Diaz C, Pineiro A, et al. Relapses and recurrences in giant cell arteritis: a population-based study of patients with biopsy-proven disease from northwestern Spain. Medicine (Baltimore) 2011; 90:186–193. [DOI] [PubMed] [Google Scholar]
- 6.Alba MA, García-Martínez A, Prieto-González S, et al. Relapses in patients with giant cell arteritis: prevalence, characteristics, and associated clinical findings in a longitudinally followed cohort of 106 patients. Medicine (Baltimore) 2014; 93:194–201. [DOI] [PMC free article] [PubMed] [Google Scholar]
- 7.Liozon E, Roblot P, Paire D, et al. Anticardiolipin antibody levels predict flares and relapses in patients with giant-cell (temporal) arteritis. A longitudinal study of 58 biopsy-proven cases. Rheumatology 2000; 39:1089–1094. [DOI] [PubMed] [Google Scholar]
- 8.Proven A, Gabriel SE, Orces C, et al. Glucocorticoid therapy in giant cell arteritis: duration and adverse outcomes. Arthritis Rheum 2003; 49:703–708. [DOI] [PubMed] [Google Scholar]
- 9.Labarca C, Koster MJ, Crowson C, et al. Relapse rates and characteristics in biopsy-proven giant cell arteritis: a single-institution cohort study. Ann Rheum Dis 2015; 74 Suppl 2:517. [Google Scholar]
- 10.Nesher G, Nesher R, Mates M, et al. Giant cell arteritis: intensity of the initial systemic inflammatory response and the course of the disease. Clin Exp Rheumatol 2008; 26 (3 Suppl 49):S30–534. [PubMed] [Google Scholar]
- 11.Kermani TA, Warrington KJ, Cuthbertson D, et al. Disease Relapses among Patients with Giant Cell Arteritis: A Prospective, Longitudinal Cohort Study. J Rheumatol 2015; 42:1213–1217. [DOI] [PMC free article] [PubMed] [Google Scholar]
- 12.Hernandez-Rodriguez J, Garcia-Martinez A, Casademont J, et al. A strong initial systemic inflammatory response is associated with higher corticosteroid requirements and longer duration of therapy in patients with giant-cell arteritis. Arthritis Rheum 2002; 47:29–35. [DOI] [PubMed] [Google Scholar]
- 13.Hachulla E, Boivin V, Pasturel-Michon U, et al. Prognostic factors and long-term evolution in a cohort of 133 patients with giant cell arteritis. Clin Exp Rheumatol 2001; 19:171–176. [PubMed] [Google Scholar]
- 14.Graham E, Holland A, Avery A, et al. Prognosis in giant-cell arteritis. Br Med J (Clin Res Ed) 1981; 282:269–271. [DOI] [PMC free article] [PubMed] [Google Scholar]
- 15.Salvarani C, Della Bella C, Cimino L, et al. Risk factors for severe cranial ischaemic events in an Italian population-based cohort of patients with giant cell arteritis. Rheumatology (Oxford) 2009; 48:250–253.Epub 2008 Dec 24. [DOI] [PubMed] [Google Scholar]
- 16.Salvarani C, Cimino L, Macchioni P, et al. Risk factors for visual loss in an Italian population-based cohort of patients with giant cell arteritis. Arthritis Rheum 2005; 53:293–297. [DOI] [PubMed] [Google Scholar]
- 17.von Elm E, Altman DG, Egger M, et al. STROBE Initiative. The Strengthening the Reporting of Observational Studies in Epidemiology (STROBE) statement: guidelines for reporting observational studies. Ann Intern Med 2007; 147:573–577. [DOI] [PubMed] [Google Scholar]
- 18.Cavazza A, Muratore F, Boiardi L, et al. Inflamed temporal artery: histologic findings in 354 biopsies, with clinical correlations. Am J Surg Pathol 2014; 38:1360–1370. [DOI] [PubMed] [Google Scholar]
- 19.Muratore F, Pipitone N, Hunder GG, et al. Discontinuation of therapies in polymyalgia rheumatica and giant cell arteritis. Clin Exp Rheumatol 2013; 31 (4 Suppl 78):S86–92. [PubMed] [Google Scholar]
- 20.Jamilloux Y, Liozon E, Pugnet G, et al. Recovery of adrenal function after long-term glucocorticoid therapy for giant cell arteritis: a cohort study. PLoS One 2013; 8:e68713. [DOI] [PMC free article] [PubMed] [Google Scholar]


