Abstract
To evaluate the utility of blood pressure variability (BPV) calculated using previously published and newly introduced indices using the variables falls and age as comparators.
While postural hypotension has long been considered a risk factor for falls, there is currently no documented evidence on the relationship between BPV and falls.
A case-controlled study involving 25 fallers and 25 nonfallers was conducted. Systolic (SBPV) and diastolic blood pressure variability (DBPV) were assessed using 5 indices: standard deviation (SD), standard deviation of most stable continuous 120 beats (staSD), average real variability (ARV), root mean square of real variability (RMSRV), and standard deviation of real variability (SDRV). Continuous beat-to-beat blood pressure was recorded during 10 minutes’ supine rest and 3 minutes’ standing.
Standing SBPV was significantly higher than supine SBPV using 4 indices in both groups. The standing-to-supine-BPV ratio (SSR) was then computed for each subject (staSD, ARV, RMSRV, and SDRV). Standing-to-supine ratio for SBPV was significantly higher among fallers compared to nonfallers using RMSRV and SDRV (P = 0.034 and P = 0.025). Using linear discriminant analysis (LDA), 3 indices (ARV, RMSRV, and SDRV) of SSR SBPV provided accuracies of 61.6%, 61.2%, and 60.0% for the prediction of falls which is comparable with timed-up and go (TUG), 64.4%.
This study suggests that SSR SBPV using RMSRV and SDRV is a potential predictor for falls among older patients, and deserves further evaluation in larger prospective studies.
INTRODUCTION
Fluctuations of blood pressure, also known as blood pressure variability (BPV), is an area which is attracting increasing interest in cardiovascular research.1 Increased visit-to-visit blood pressure variability has been found to be associated with increased risk of stroke.2 A study evaluating short-term BPV using 24-hour ambulatory measurements has linked increased BPV with all-cause mortality.3 Increased BPV has also been associated with increased cardiovascular events and target organ damage among patients with hypertension.4–8 Since the discovery of the mercury sphygmomanometer by Samuel Siegfried Karl Ritter von Basch in 1881, various other methods to measure blood pressure have been invented. More recent methods to assess blood pressure include noninvasive continuous beat-to-beat BP recording and 24-hour ambulatory blood pressure monitoring.1,4,9 Studies evaluating BPV have either employed 24-hour ambulatory blood pressure monitoring devices to calculate short-term BPV 4–7,10 or long-term blood pressure variations using limited measurements obtained from clinic visits.1–3 Presently, there is a limited number of studies evaluating beat-to-beat blood pressure recordings to determine very short-term BPV.
Blood pressure variability can be classified into short-term BPV and long-term BPV. Short-term BPV is measured within a 24-hour period (beat-to-beat, minute-to-minute, hour-to-hour, and day to night changes) while long-term BPV is measured over a longer period of time (days, weeks, months, seasons, and even years).9 Various indices have been employed to determine BPV. The most commonly employed index is the standard deviation (SD) of BP values.1,4,5,7,9–11 However, a new index, the average real variability (ARV) has been proposed to resolve the conflicting results sometimes observed with SD.12 The ARV index is the mean of the absolute difference between adjacent blood pressure values. It reduces the error produced by signal noise which is inevitable with the use of highly sensitive noninvasive measurement methods.12 This new index was inspired by the concept of real analysis of total variability in mathematics. The true variability of BP signals is defined using the difference between adjacent BP values, instead of using the assumption that the mean of absolute difference is representative of BPV. We would like to propose the use of the root mean square and the standard deviation of absolute difference in BP values to calculate BPV as a further improvement on the ARV index.
Falls are common among older individuals, and has been reported to occur in over 30% of individuals aged 65 years and over annually.13 Multiple risk factors have been associated with falls including impaired sensorimotor function, muscle weakening, environmental factors, medications, visual limitations, and cardiovascular disorders.14,15 While an observed reduction in blood pressure with posture change or orthostatic hypotension (OH), is an established risk factor for falls,9,16 there is currently no documented evidence on BPV and falls in older persons. This is likely to be because existing falls databases are insufficiently robust to observe long-term BPV and appropriate equipment and algorithms had not been readily available previously.
We hypothesize that our new indices for the calculation of very short-term BPV will produce more precise assessments of BPV, and that fallers have significantly larger postural changes in BPV. We, therefore, used the presence and absence of a history of falls to evaluate the changes in BPV from the supine to the standing posture using existing and new indices for the calculation of BPV.
METHODS
Study Population
This was a case-controlled study involving 25 fallers and 25 nonfallers, recruited between January and March 2014. Fallers were recruited from patients aged 65 years and above attending the emergency department, primary care clinics and geriatric outpatients as well as referrals from other specialties. Only individuals with 2 or more falls or one injurious fall in the past 1 year were included.17 Falls were defined as “unintentionally coming to rest on the ground, floor or other lower level.”18 Aged matched healthy volunteers with no history of falls were obtained from the Malaysian Elders Longitudinal Research (MELoR) research database. Any conditions associated with changes in autonomic nervous systems activity may potentially influence BPV. Therefore, we retrospectively excluded individuals with a history of uncontrolled hypertension, heart disease, stroke, diabetes, and neurodegenerative disorders.
Baseline characteristics including age, gender, characteristics of falls, and the past medical history were obtained from all subjects on the day of blood pressure assessment. Anthropometric measurements (height and weight) were also obtained, and balance and gait were assessed with the timed-up and go (TUG) test. Informed consent was obtained from each subject, and the study protocol was approved by the University of Malaya Medical Ethics Committee (MEC Ref No: 925.4).
Active Stand Beat-to-Beat Blood Pressure Test
All subjects were assessed using continuous noninvasive beat-to-beat blood pressure monitoring using the vascular unloading method (Task Force, CNSystems, Austria).19 Following 10 minutes of supine rest, subjects were asked to stand for 3 minutes during which beat-to-beat blood pressure data was continuously recorded throughout 13 minutes. Assistance was provided whenever required to ensure that the transition from supine to standing occurred smoothly and swiftly. Subjects were instructed not to move their hands fitted with the finger cuff during the data collection periods to prevent any motion artifacts, and the finger cuffs were maintained at heart level throughout measurements using a specially designed sling.20 The presence of any symptoms of dizziness during and immediately after the active stand procedure was recorded for all subjects.
Timed-up and Go Test
The TUG test was obtained from each subject as a previously established marker of falls due to gait or balance problems.21 The subject was asked to stand up from a chair with armrest, walk using their normal walking speed for 3 meters before returning to the chair. The time in seconds between the subject's back leaving the back of the chair and when the subject's back touches the back of the chair again is considered the TUG time.
Signal Processing Methods
Continuous blood pressure and ECG signals were collected throughout the active stand test and then exported to a MATLAB file with sampling frequencies of 100 Hz and 1000 Hz, respectively. The continuous signals were broken down into three segments; supine, transition, and erect segments. Time domain BPV for the supine and standing (first and third) data segments was determined for systolic (SBPV) and diastolic (DBPV) measurements using 5 different indices. Table 1 details a complete list of BPV indices with their brief descriptions. Index 1 was obtained by calculating the SD for the entire segment of interest,1,4,5,7,9–11 whereas index 2 was obtained by calculating the standard deviation for the most stable continuous 120 beats (staSD) 22,23 for each segment by using moving average method. The ARV method used in index 3 is calculated using the average of the absolute difference between adjacent beats within each segment.12 Index 4 was obtained using the root mean square of real variability (RMSRV), which involved calculating the square root of the mean for the squares of absolute difference between adjacent beats.24 Finally, index 5 employed the standard deviation of real variability (SDRV) method, which involved calculation of the standard deviation for the absolute difference between adjacent beats.24
TABLE 1.
Detailed Description of Variability Indices
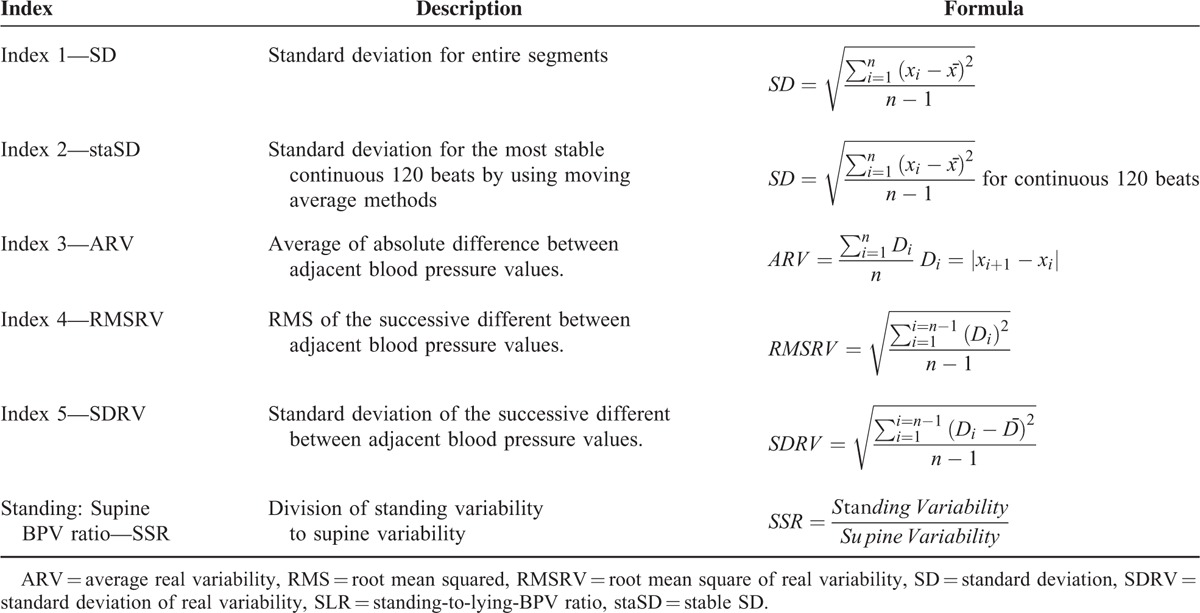
The ratio of standing BPV to supine BPV (SSR) was then computed for each subject. This derived measure represents the change in variability from the supine position to the standing position. As the 5 different methods were employed for both systolic and diastolic BPV, 10 BPV indices were produced; 5 indices from systolic BPV and another 5 indices from diastolic BPV.
Statistical Methods and Classifier
We employed both statistical and classifier methods to separate the data into 2 groups.
Statistical Method
Statistical analysis was conducted using SPSS 22.0 statistical software. Continuous variables were expressed as mean ± standard deviation, whereas discrete variables were expressed as frequencies with percentages in parenthesis. Differences between groups were determined using the independent t-test for continuous parametric variables, and the Fisher exact test for categorical variables.
Further statistical analyses were conducted by determining potential differences in SSR with a history of falls in the past year, increasing age, and the symptoms of dizziness during standing. Subjects were divided into 2 age categories: 65 to 74 and 75 years and above, to obtain a dichotomous variable for age.
CLASSIFIER
Linear discriminant analysis (LDA) is a widely used computation dependent classifier. LDA implements the concept of searching for a linear combination of variables (predictors) that best separates 2 classes (targets). In this study, 80% of the data were used to train the model whereas the remaining 20% of the data were used to test the accuracy of the model. The experiment was performed using a 5 × 5-fold cross-validation on all of the BPV indices, TUG, age, and gender factors. The sensitivity, specificity, and accuracy for each variable were then determined.
RESULTS
Baseline Demographic Data
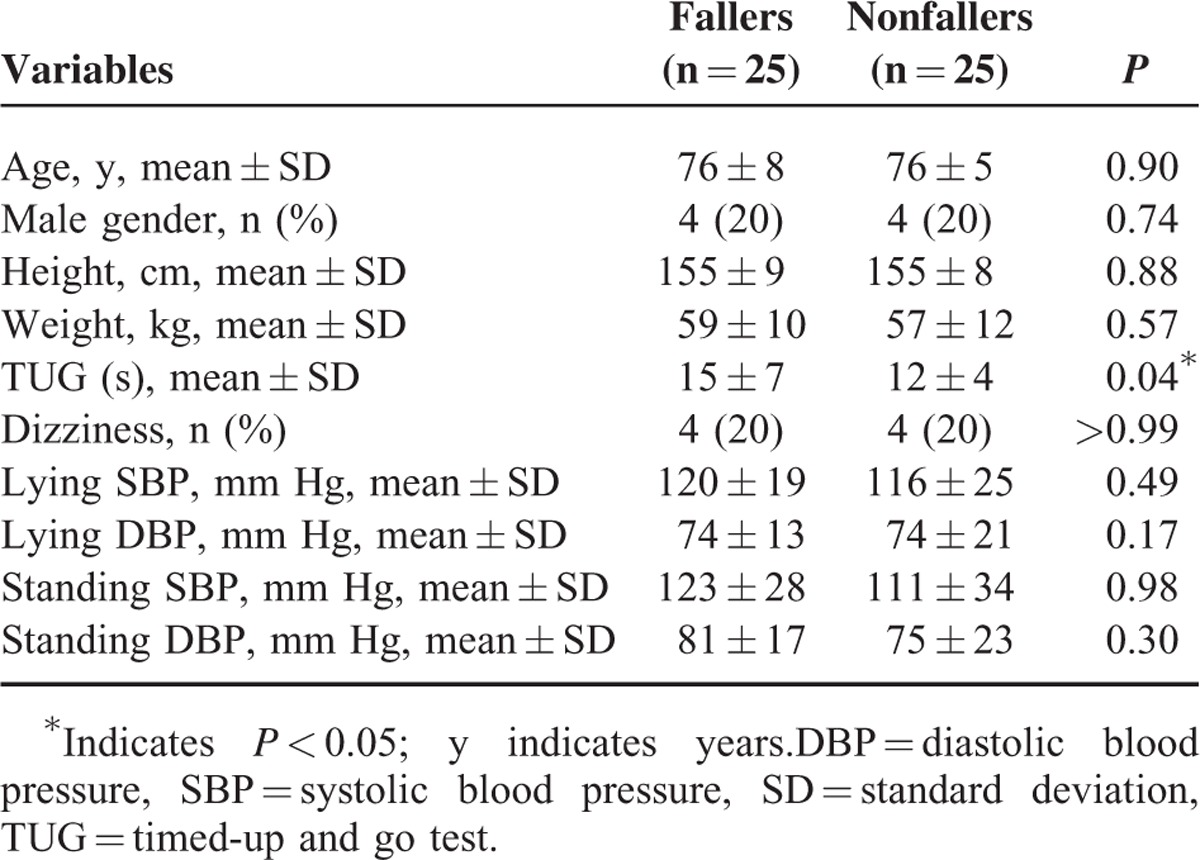
From a total of 50 subjects, aged (mean ± SD) 76 ± 7 years, 20% men (Table 2), there was no significant age difference between the 2 groups of fallers and nonfallers. Only the completion time for TUG shown significant between fallers and nonfallers (P = 0.04).
TABLE 2.
Baseline Demographic Data
Blood Pressure Variability
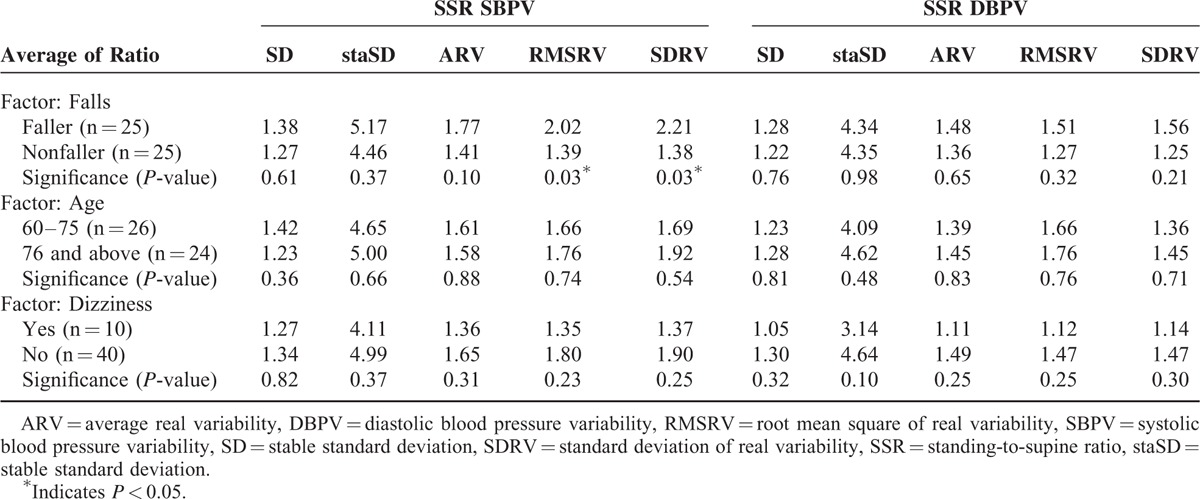
Systolic blood pressure variability of fallers computed from all 5 indices showed a significant increase due to the posture change from supine to standing (Table 3). Whereas for the nonfallers, only 4 indices of SBPV (Index 2–Index 5) showed a significant increase. The SSR for BPV is categorized according to 3 factors: falls, age, and dizziness (Table 4). There were statistically significant differences in SSR SBPV between fallers and nonfallers using index 4 (RMSRV) and index 5 (SDRV), with trends to increased SSR SBPV for the remaining 3 indices. There were nonsignificant trends to higher SSR SBPV and SSR DBPV for those with age 76 and above. There were also nonsignificant trends to higher SSR SBPV and SSR DBPV for those who report symptoms of dizziness while standing.
TABLE 3.
Supine and Standing Blood Pressure Variability in Fallers and Nonfallers
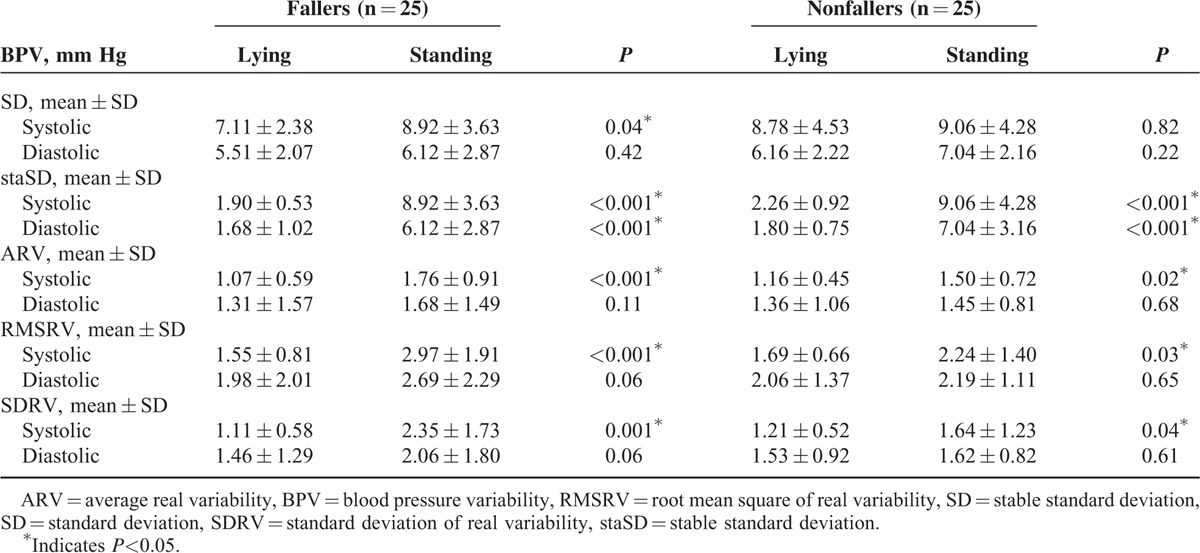
TABLE 4.
Differences in Standing to Supine Blood Pressure Variability Ratio According to Falls History, Age, and Symptoms of Dizziness
Performance of Individual Indices in LDA
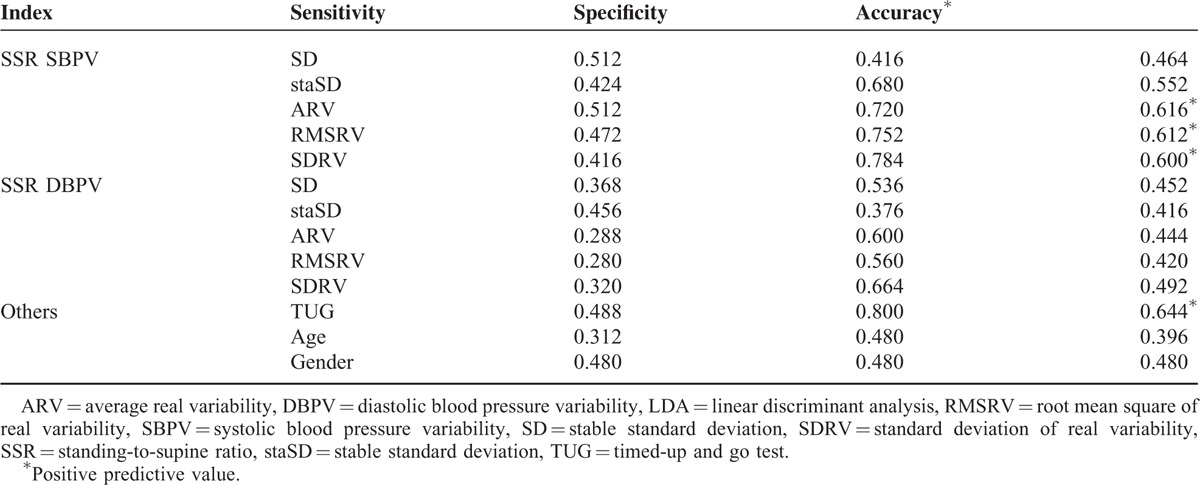
The TUG provided accuracy or a positive predictive value of 64.4% in predicting the risk of falls. Thus, a cut-off of 60% was selected. Using the variable SSR SBPV, the 3 indices of ARV, RMSRV, and SDRV (indices 3–5) provided accuracies of over 60% for the prediction of falls. The remaining parameters of SSR DBPV, age >75 years and reported symptoms of dizziness did not produce adequate accuracy for the prediction of falls. The complete table of results is shown in Table 5.
TABLE 5.
Performance of Individual Indices in LDA
DISCUSSION
This study introduced 2 new methods of calculating blood pressure variability: RMSRV and SDRV. RMSRV and SDRV were found to be better indices for the computation of BPV compared to SD and ARV. RMSRV and SDRV also discriminated fallers and nonfallers better than the other methods for SBPV and showed acceptable accuracy for the prediction of falls using LDA compared to using SD or staSD.
Previous studies evaluating BPV have primarily used SD and frequency domain spectral analysis methods to determine very short-term SBPV and SD or coefficients of variations to determine short-term (24 hour) and long-term BPV.1 This study focused on time domain methods rather than frequency domain methods. The simplest index to calculate the blood pressure variability is the SD or the square root of variance. SD reflects all the cyclic components responsible for variability in the period of recording since variance is mathematically equal to the total power of spectral analysis.24 The authors of a recent study suggested that ARV was a more reliable index for BPV.12 This study suggests that RMSRV and SDRV may be superior to ARV and SD and should be considered in future studies of BPV.
Blood pressure values vary with each heart beat whether subjects are supine down, sitting, or standing still.19 Fluctuations in BP can be considered as the BPV of the subject for that particular position.25 As such, the SD would appear to be the best measure to determine BPV. However, when a subject changes his or her posture, there is a shift of the baseline BP value.26 For example, using sitting BP as the reference level, BP will drop and then recovers back to a new reference level with variable degrees of overshoot from baseline while standing. The speed of recovery is dependent on the sensitivity of the subject's baroreflex responses. The usage of SD is affected by this low frequency trend. However, with the absolute difference between individuals’ beats, the effect of these low frequency trends can be minimized. The newer formulae introduced in this paper employ the absolute difference of adjacent BP values to calculate BPV, which explains the better performance of ARV, RMSRV, and SDRV. In addition, SD is also influenced by measurement errors that may be present with individual blood pressure measurements; limiting its suitability for very short-term BPV calculations due to the large amount of noise associated with noninvasive beat-to-beat digital BP measurements.
Very short-term BPV was used to evaluate BPV in this study. Most studies investigating BPV have assessed mainly short-term measurements using 24-hour blood pressure measurements, and long-term BPV. The mechanism for visit-to-visit or day-to-day blood pressure variations have been linked to arterial stiffness, whereas short-term BPV is affected by humoral changes and autonomic responses.1 Very short-term BPV is likely to have minimal influence from humoral changes and is therefore likely to reflect central autonomic control, but may be influenced by the changes in intrathoracic pressure associated with respiration. The significance of very short-term BPV using beat-to-beat measurements therefore remains unclear.
Changes in BPV between supine and erect positions within subjects were measured to assess the potential differences in the effect of posture change on BPV between older individuals with and without a history of falls in the past year. Since BPV can be influenced by factors such as emotions and medications, direct comparisons between supine BPV and erect BPV between subjects may be affected by confounders such as diabetes. This study has demonstrated an increase in SBPV with standing, independent of falls status. Upon assuming an upright posture, sympathetic activity increases. This, in turn, increases peripheral vascular tone to prevent a reduction in blood pressure that would otherwise occur due to the effects of gravity. An increase in BPV with standing indicates that the gravitational reduction in blood pressure with standing does occur on a beat-to-beat level regardless of whether the older individual has previously sustained a fall, but baroreflex responses then increase the heart rate or peripheral resistance to overcome this drop.25 The standing-to-supine ratio therefore assesses the ability of the baroreflex to respond to blood pressure changes associated with posture change.
There was a significant increase in the SSR for SBPV in our older fallers compared to nonfallers using the RMSRV and SDRV methods of determining BPV, with trends to significance using the other three previously published methods. This indicates that RMSRV and SDRV are more sensitive to potential differences in BPV and also suggests that falls in older people may be associated with an impaired baroreflex response. As the SSR measures the change in BPV between the standing and supine positions, this implies that older fallers have larger increases in fluctuations in systolic blood pressure during standing compared to nonfallers. This larger change in blood pressure may potentially be associated with an increased risk of postural instability due to its effect on cerebral perfusion. To our knowledge, no previous studies have investigated the relationship between BPV and falls. Research on falls has mainly focused on the association between falls and the hypotensive disorders of orthostatic hypotension, vasovagal syncope, and carotid sinus hypersensitivity (CSH). Finucane et al evaluated BPV using frequency domain methods in older individuals with CSH, a condition characterized by bradycardic and/or hypotensive responses and associated with falls in older individuals. They found an increase in Mayer waves, which were low frequency fluctuations in blood pressure in older individuals with recurrent syncope or falls with predominant vasodepressor responses to carotid sinus massage, the diagnostic test for CSH, compared to the older patients with falls or syncope with no significant blood pressure reduction in response to carotid sinus massage.27 The above study, however, had not involved nonfallers, but further supports our hypothesis of larger blood pressure fluctuations affecting postural stability.
This study introduces 2 new indices with which to assess BPV. The new indices: RMSRV and SDRV show promise as more precise methods for determining BPV. Future studies evaluating cardiovascular endpoints associated with BPV should therefore consider including these new indices which appear to address the difficulties associated with existing indices used to determine BPV. In addition, this paper has also exposed a positive relationship between increased fluctuations in BP with posture change among older fallers with the likely underlying pathological processes being impaired baroreflex responses to posture change and subsequent reduction in cerebral perfusion affecting postural stability. A larger cohort study evaluating the relationship between variations in postural changes in BPV with the incidence of falls determined prospectively should now be considered.
Acknowledgments
We are grateful to Prof Phyo Kyaw Myint from the University of Aberdeen, United Kingdom and Dr Chin Teck Ng from the University of Malaya for their help in improving this article. The authors would like to thank the members from Malaysian Elders Longitudinal Research (MELoR), Ageing and Age-Associated Disorders Research Group, and Centre for Applied Biomechanics (CAB) for helping with patient recruitment and data collection.
Footnotes
Abbreviations: ARV = average real variability, BPV = blood pressure variability, DVPB = diastolic blood pressure variability, LDA = linear discriminant analysis, RMSRV = root mean square of real variability, SBPV = systolic blood pressure variability, SD = standard deviation, SDRV = standard deviation of real variability, SSR = standing-to-supine ratio, staSD = standard deviation of most stable continuous 120 beats, TUG = timed-up and go.
This study was funded by a Department of Higher Education High Impact Education Grant for the Malaysian Elders Longitudinal Study [UM.C/625/1/HIRMOHE/ASH/02] and Postgraduate Research Grant (PPP)—Research for the title The Cardiovascular Assessment towards Malaysian Elderly Fallers [PG017–2014B].
The authors have no conflicts of interest to disclose.
REFERENCES
- 1.Parati G, Ochoa JE, Lombardi C, et al. Assessment and management of blood-pressure variability. Nat Rev Cardiol 2013; 10:143–155. [DOI] [PubMed] [Google Scholar]
- 2.Rothwell PM, Howard SC, Dolan E, et al. Prognostic significance of visit-to-visit variability, maximum systolic blood pressure, and episodic hypertension. Lancet 2010; 375:895–905. [DOI] [PubMed] [Google Scholar]
- 3.Mancia G, Bombelli M, Facchetti R, et al. Long-term prognostic value of blood pressure variability in the general population results of the Pressioni Arteriose Monitorate e Loro Associazioni study. Hypertension 2007; 49:1265–1270. [DOI] [PubMed] [Google Scholar]
- 4.Tatasciore A, Renda G, Zimarino M, et al. Awake systolic blood pressure variability correlates with target-organ damage in hypertensive subjects. Hypertension 2007; 50:325–332. [DOI] [PubMed] [Google Scholar]
- 5.Su DF, Miao CY. Blood pressure variability and organ damage. Clin Exp Pharmacol Physiol 2001; 28:709–715. [DOI] [PubMed] [Google Scholar]
- 6.Eto M, Toba K, Akishita M, et al. Impact of blood pressure variability on cardiovascular events in elderly patients with hypertension. Hypertens Res 2005; 28:1–7. [DOI] [PubMed] [Google Scholar]
- 7.Sega R, Corrao G, Bombelli M, et al. Blood pressure variability and organ damage in a general population results from the PAMELA study. Hypertension 2002; 39:710–714. [DOI] [PubMed] [Google Scholar]
- 8.Poortvliet RK, Ford I, Lloyd SM, et al. Blood pressure variability and cardiovascular risk in the prospective study of pravastatin in the elderly at risk (PROSPER). PloS One 2012; 7:e52438. [DOI] [PMC free article] [PubMed] [Google Scholar]
- 9.Heitterachi E, Lord SR, Meyerkort P, et al. Blood pressure changes on upright tilting predict falls in older people. Age Ageing 2002; 31:181–186. [DOI] [PubMed] [Google Scholar]
- 10.Zhang Y, Agnoletti D, Blacher J, et al. Blood pressure variability in relation to autonomic nervous system dysregulation: the X-CELLENT study. Hypertens Res 2012; 35:399–403. [DOI] [PubMed] [Google Scholar]
- 11.Mancia G, Ferrari A, Gregorini L, et al. Blood pressure and heart rate variabilities in normotensive and hypertensive human beings. Circ Res 1983; 53:96–104. [DOI] [PubMed] [Google Scholar]
- 12.Mena L, Pintos S, Queipo NV, et al. A reliable index for the prognostic significance of blood pressure variability. J Hypertens 2005; 23:505–511. [DOI] [PubMed] [Google Scholar]
- 13.World Health Organization. Ageing, & Life Course Unit. WHO Global Report on Falls Prevention in Older Age. World Health Organization; 2008. [Google Scholar]
- 14.Currie L. Hughes RG. Falls and injury prevention. Patient Safety and Quality: An Evidence-Based Handbook for Nurses. United States: Agency for Healthcare Research and Quality (AHRQ); 2008. 203–258. [PubMed] [Google Scholar]
- 15.Masud T, Morris RO. Epidemiology of falls. Age Ageing 2001; 30:3–7. [DOI] [PubMed] [Google Scholar]
- 16.Caird F, Andrews G, Kennedy R. Effect of posture on blood pressure in the elderly. Br Heart J 1973; 35:527–530. [DOI] [PMC free article] [PubMed] [Google Scholar]
- 17.Tan PJ, Khoo EM, Chinna K, et al. An individually-tailored multifactorial intervention program for older fallers in a middle-income developing country: Malaysian Falls Assessment and Intervention Trial (MyFAIT). BMC Geriatr 2014; 14:78. [DOI] [PMC free article] [PubMed] [Google Scholar]
- 18.Kenny R, Rubenstein LZ, Tinetti ME, et al. Summary of the updated American Geriatrics Society/British Geriatrics Society clinical practice guideline for prevention of falls in older persons. J Am Geriatr Soc 2011; 59:148–157. [DOI] [PubMed] [Google Scholar]
- 19.Fortin J, Marte W, Grullenberger R, et al. Continuous non-invasive blood pressure monitoring using concentrically interlocking control loops. Comput Biol Med 2006; 36:941–957. [DOI] [PubMed] [Google Scholar]
- 20.Tan MP, Kenny RA. Cardiovascular assessment of falls in older people. Clin Interv Aging 2006; 1:57–66. [DOI] [PMC free article] [PubMed] [Google Scholar]
- 21.Salzman B. Gait and balance disorders in older adults. Am Fam Physician 2010; 82:61–68. [PubMed] [Google Scholar]
- 22.Mangin L, Kobeissi A, Lelouche D, et al. Simultaneous analysis of heart rate variability and myocardial contractility during head-up tilt in patients with vasovagal syncope. J Cardiovasc Electr 2001; 12:639–644. [DOI] [PubMed] [Google Scholar]
- 23.B́echir M, Binggeli C, Corti R, et al. Dysfunctional baroreflex regulation of sympathetic nerve activity in patients with vasovagal syncope. Circulation 2003; 107:1620–1625. [DOI] [PubMed] [Google Scholar]
- 24.Malik M, Bigger JT, Camm AJ, et al. Heart rate variability standards of measurement, physiological interpretation, and clinical use. Eur Heart J 1996; 17:354–381. [PubMed] [Google Scholar]
- 25.Nardo CJ, Chambless LE, Light KC, et al. Descriptive epidemiology of blood pressure response to change in body position the ARIC study. Hypertension 1999; 33:1123–1129. [DOI] [PubMed] [Google Scholar]
- 26.Murata J, Murata S, Horie J, et al. Relationship between orthostatic blood pressure changes and postural sway when standing up from a chair in older adult females. Int J Gerontol 2012; 6:182–186. [Google Scholar]
- 27.Finucane C, Boyle G, Fan CW, et al. Mayer wave activity in vasodepressor carotid sinus hypersensitivity. Europace 2010; 12:247–253. [DOI] [PubMed] [Google Scholar]


