Supplemental Digital Content is available in the text
Abstract
During acute stroke care, rehabilitation usage may be influenced by patient- and hospital-related factors. We would like to identify patient- and hospital-level determinants of population-level inpatient rehabilitation usage associated with acute stroke care.
From data obtained from the claim information from the National Health Insurance Administration (NHIA) in Taiwan (2009–2011), we enrolled 82,886 stroke patients with intracerebral hemorrhage and cerebral infarction from 207 hospitals. A generalized linear mixed model (GLMM) analyses with patient-level factors specified as random effects were conducted (for cross-level interactions).
The rate of rehabilitation usage was 51% during acute stroke care. The hospital-related factors accounted for a significant amount of variability (intraclass correlation, 50%). Hospital type was the only significant hospital-level variable and can explain the large amount of variability (58%). Patients treated in smaller hospitals experienced few benefits of rehabilitation services, and those with surgery in a smaller hospital used fewer rehabilitation services. All patient-level variables were significant.
With GLMM analyses, we identified the hospital type and its cross-level interaction, and explained a large portion of variability in rehabilitation for stroke patients in Taiwan.
INTRODUCTION
It is well known that timely, multidisciplinary inpatient rehabilitation offers better outcomes for stroke patients.1 The factors related to the utilization of inpatient rehabilitation have been explored through many patient-level factors (e.g., age, race, socioeconomic status, comorbidity).2–4 However, rehabilitation is also determined by system-level factors (e.g., geographic region, institutional facilities).5–7 Hence, the utilization of rehabilitation data is inherently hierarchical in that patients are nested within hospitals. The multilevel data structure should be analyzed to account for hospital clustering because patients who convalesce in a hospital do not represent independent observers.8 The failure to account for the multilevel nature of the data has been attributed to an inflated number of errors when identifying hospital-level determinants of care.9 On analyzing the patients’ access to rehabilitation after stroke we may expect the exploration of hospital-level factors as one important factor. On the other hand, the percentage of stroke patients who receive rehabilitation care in hospitals may vary, not only due to the patients’ individual needs for rehabilitation services but also due to differences of the rehabilitation services among the hospitals. The decision to provide rehabilitation services and the relevant care to patients is complicated and also may result from the interaction of specific characteristics of the stroke patient (e.g., comorbidity or severity) and the specific characteristics of the hospital.
Multilevel modeling, an analytic technique designed to examine the nested data structures, has been used to quantify the variability in utilization at more than one aggregate level after adjusting case-mix differences. A level contributing only a small proportion to the total variance has little influence on utilization or quality, and little potential for improvement directed at that level.10 This modeling technique can offers the ability to identify sources of variation between patient- and hospital-levels, the interaction between variables at different levels, and more precise estimates of hospital-specific effects, especially for a smaller volume hospital.11
The variation in rehabilitation usage among inpatients is still elusive, and we would like to identify patient- and hospital-level variables associated with the rehabilitation usage, in order to have some recommendations for improvement of rehabilitation services. Three issues caught our interest: the extent of the variation in the utilization of rehabilitation attributable to hospital-level factors; the patient- and hospital-level factors associated with the rehabilitation usage; and the possible cross-level interactions between the patient- and hospital-level factors.
METHODS
Data Sources
The databank for this study was drawn from the National Health Insurance Administration (NHIA) database, which contains information collected from regular NHIA claim data, 2008 to 2012. The NHIA created a random identification number for each insured individual's reimbursement claim data before releasing them for research purposes. This study has got the approval from the Institutional Review Board, Fu Jen Catholic University (IRB number C102012).
Characteristics of the Study Subjects
Subjects of the first admission with a principal discharge diagnosis of an acute stroke (ICD-9-CM 430–436) during the hospital stays between January 2009 and December 2011 were enrolled. Those with late effects from a stroke encoded (ICD-438) before their index strokes were excluded. Patients who transferred and readmitted to other hospitals within 5 days of the prior discharge were excluded.12 The hospitals were defined to those with more than 30 stroke inpatients annually. Finally, patients who died during the study period were also excluded.
To identify the study subjects who required in-hospital rehabilitation services during the first year after stroke, we applied the selection rules from National Quality Forum (NQF)13 and Physician Quality Reporting System (PQRS)14 to identify the patients aged from 18 to 80 years with a diagnosis of cerebral infarction (CI) or intracranial hemorrhage (ICH) among the patients listed above (ICD-9-CM: 431, 433.01, 433.11, 433.21, 433.31, 433.81, 433.91, 434.01, 434.11, 434.91), and then divided the patient groups as ICH (431) and CI (433–434). We exclude patients with a length of stay of more than 120 days or patients admitted for elective carotid intervention. In this analysis we also excluded the diseases with possible confusion of the diagnosis of acute stroke, such as the head trauma or severe injuries, major surgical operations, myocardial or aortic disorders, infection, space-occupying brain lesions and conditions with bleeding events or tendency (see Appendix, Tables 1 and 2).
Key Variables of Interest
The use of rehabilitation services was identified through reimbursement claims for physical and occupational therapies. Factors associated with the use and extent of rehabilitation services consisted of hospital- or patient-related factors. Patient factors included age, gender, income (premium as a proxy), stroke type, stroke severity, Elixhauser Comorbidity Measures (ECM),15 and neurologist's care participation. The ECM (30 dichotomous variables) had statistical superiority to the Charlson index for comorbidity.16 To prevent the ECM from jeopardizing the regression models due to data overfitting or a lack of convergence and to easily model cross-level interactions between hospital-level variables and comorbidity, we used a single statistic to describe the ECM.17 The following 4 proxy indicators that represent stroke severity were constructed based on secondary diagnoses: surgical operations or surgical procedures reimbursed by the NHI program other than those listed in the Appendix Table 2; use of mechanical ventilation; hemiplegia or hemiparesis; and residual neurologic deficits.4
Hospital characteristics included the hospital type, teaching facility status, ownership, volume (the number of services used) and Herfindahl–Hirschman Index (HHI). The HHI was originally used to measure hospital competition. We calculated the HHI for the 17 medical networks identified by the Ministry of Health and Welfare Taiwan.
Statistical Analysis
The relationships between patient- and hospital-level variables were examined with a generalized linear mixed model (GLMM) using Proc Glimmix in SAS version 9.4 (Statistical Analysis Systems, Inc., Cary, NC) with the Laplace estimation. The fixed effects were tested with a Wald t test, and we tested the variance estimates of random effects using a log likelihood ratio (LLR) test (compared with the zero covariance). The rehabilitation usage was fitted to the Bernoulli distribution (binary data). The comparison models of goodness of fit (GOF) included the Akaike Information Criterion (AIC), pseudo R-squared, and proportional change in variance (PCV) between a simple model and a model with more adjustment variables, which was found using the following formula:
 |
where τ is the variance of hospital random intercept.18
Hospitals were tested for random effects in 4 steps. First, an unconditional means model was used to determine the significance of the one random-effect term (hospital). The unconditional means model also provided an estimate of the intraclass correlation coefficient (ICC), which describes the portion of the total variance that is attributable to clustering within the hospital. The ICC calculation for the multilevel model suggested by Snijders and Bosker assumes that σ2 is fixed at (π2/3),8 and that the mean equals zero. Second, patient-level variables were added as fixed effects using backward elimination, and nonsignificant variables were removed sequentially until only significant (P < 0.05) variables remained. Third, hospital-level variables were added, and we used the same backward elimination. Finally, we incrementally tested all patient-level variables with random effects using an LLR test. To confirm that the final GLMM model was appropriate, we checked the residuals whether approximately normally distributed.
We used a generalized additive model (GAM) to investigate the variable age associated with the use of rehabilitation. Computationally, the vector-generalized linear and additive models (VGAM) function (with the default values of smoothing parameters) of the VGAM package was used to fit GAMs for continuous, binary, and count responses in R.19 We also subjected the final model to the following sensitivity analysis, which fitted a dispersion parameter to the GLMM model; it is generally recommended that such a dispersion parameter be fitted to a GLMM, partly to allow for the random effect shrinkage that occurs when some hospitals have no rehabilitation usage.20
RESULTS
We finally enrolled 82,886 patients from 207 hospitals (Figure 1) into this study. To explore the nonlinear association of age and rehabilitation usage and to check for an appropriate cut-off point, we fitted GAMs (Figure 2). The results revealed a slightly nonlinear-shaped association, with increased rehabilitation usage among those aged 63 years or older. Hence, we got the cut-off point of age at 63 years.
FIGURE 1.
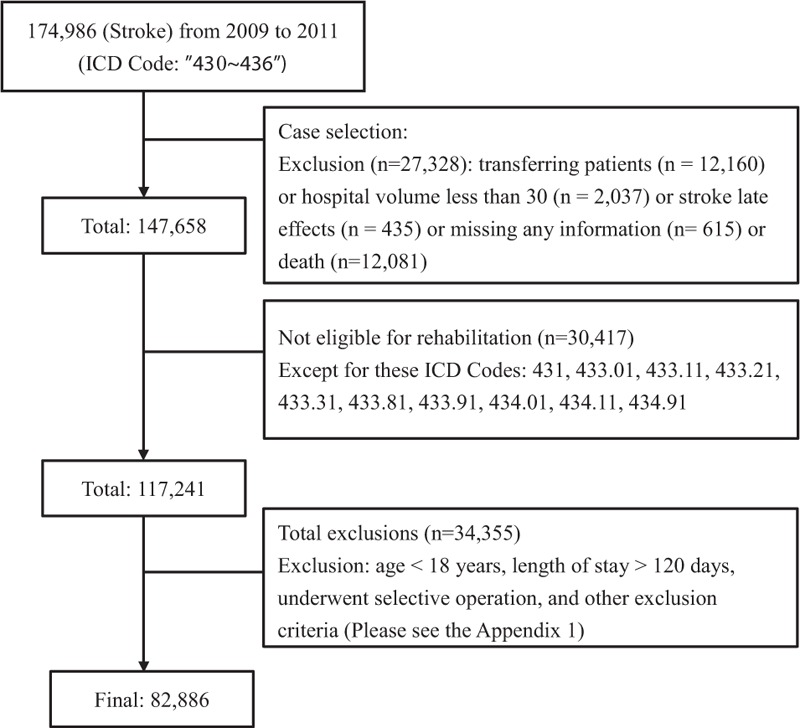
Flow chart of subject selection.
FIGURE 2.
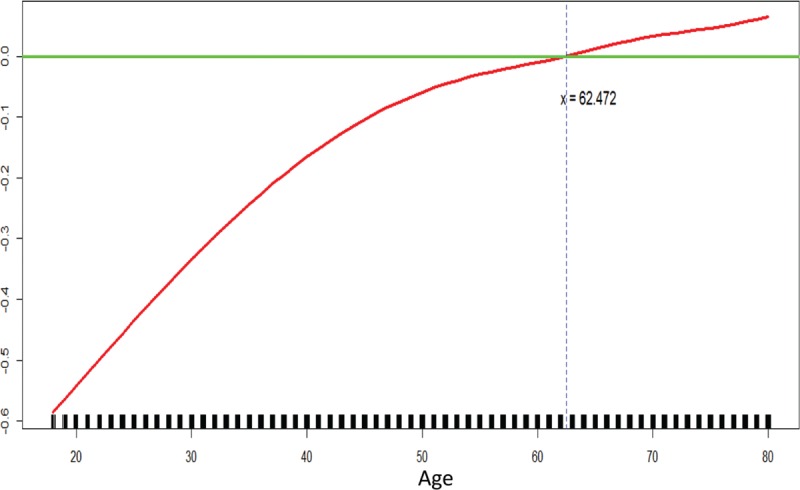
GAM plot for the model of rehabilitation usage versus age.
In Table 1 , among the 82,886 stroke patients (14% ICH and 86% CI), the overall utilization of inpatient rehabilitation services was 52%. Among the rehabilitation cases (43,298), 95% patients had physical therapy, 68% occupational therapy, and 64% both therapies. Table 1 also presents the patients’ demographic characteristics and their correlation with rehabilitation utilization. Among the rehabilitation cases, 60% aged 63 years and older, 62% were male, 5% had an income of NT$43,900 (around US$1334), and 71% ever cared by neurologists.
TABLE 1.
Description and Rehabilitation Usage of Subjects With Ischemic Stroke or Intracranial Hemorrhage (n = 82,886)
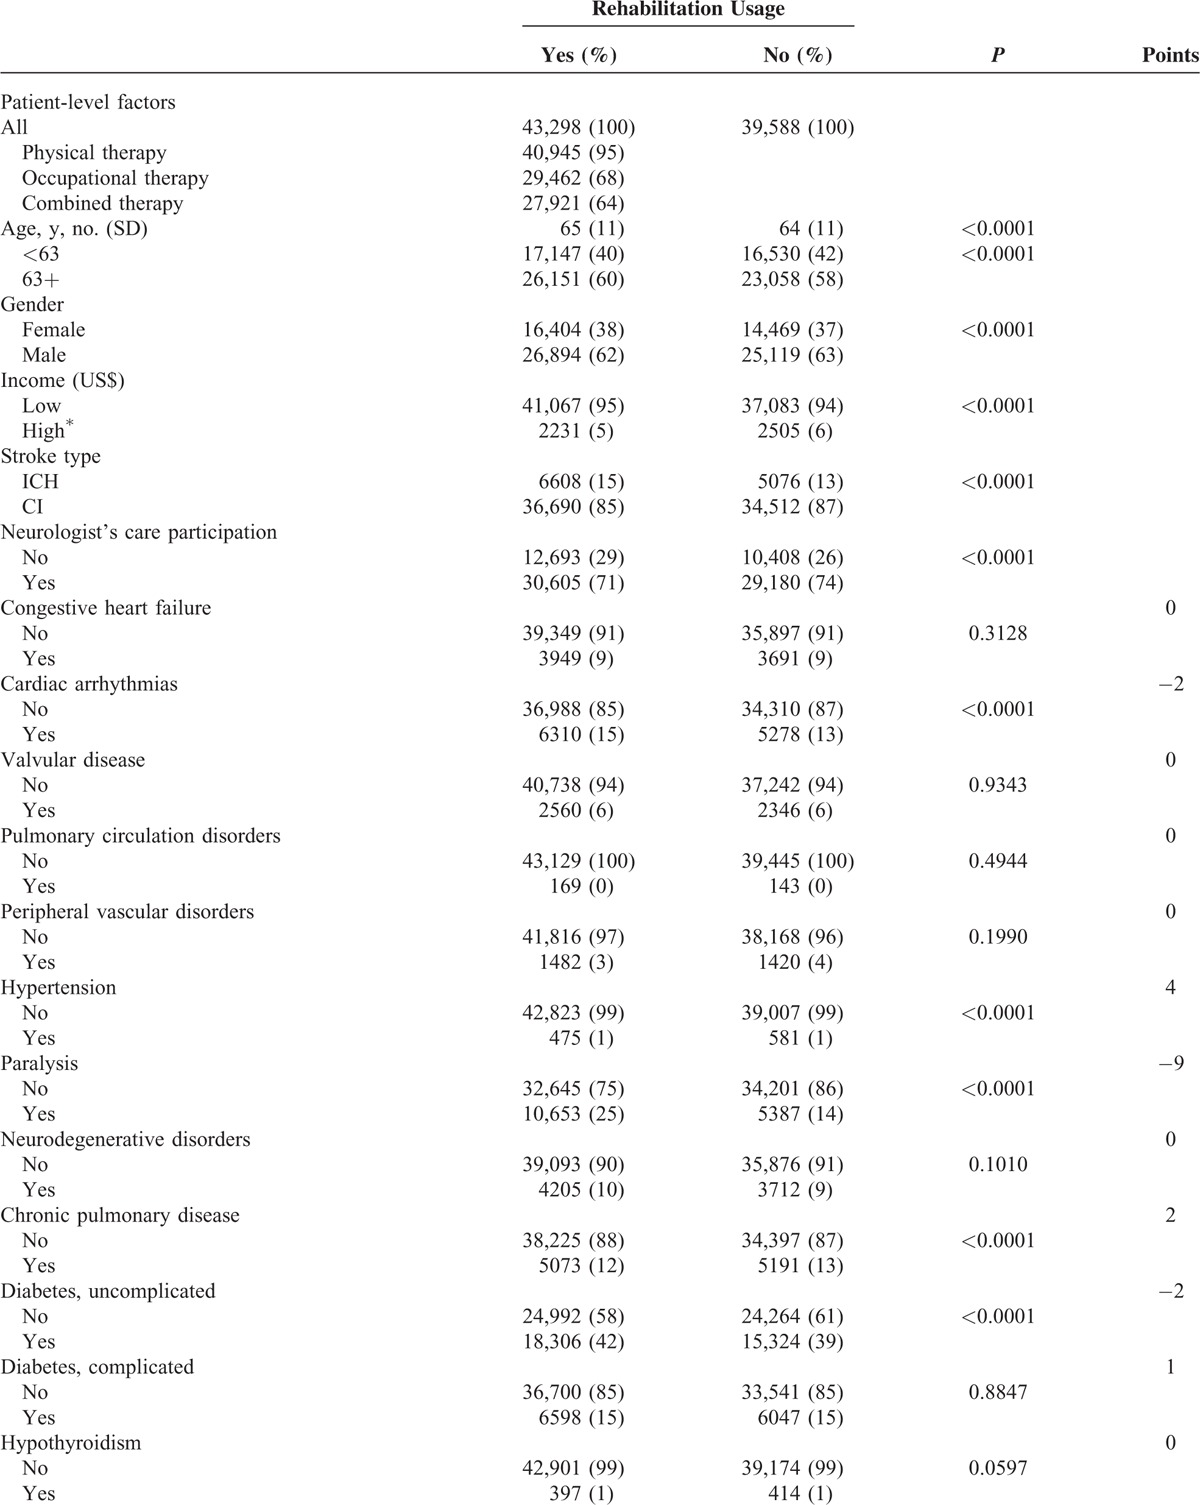
TABLE 1 (Continued).
Description and Rehabilitation Usage of Subjects With Ischemic Stroke or Intracranial Hemorrhage (n = 82,886)
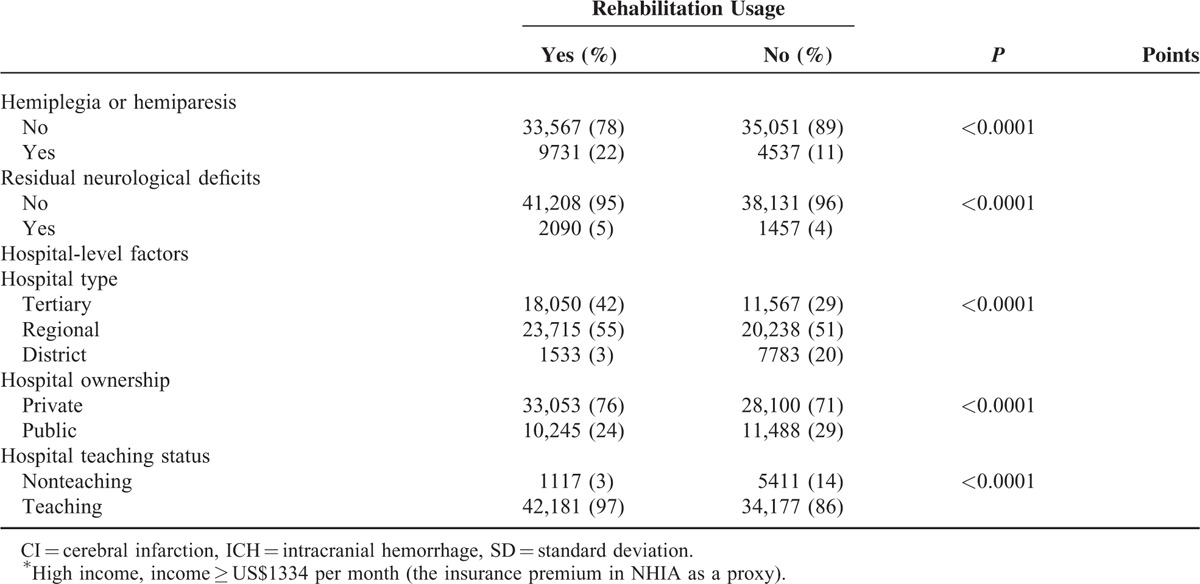
In Table 1 , the ECM points assigned to each comorbidity item ranged from –9 (paralysis) to +5 (hypertension). The actual ECM scores in our population varied, with a median score –1 (IQR –2 to 0). In addition, the following items may represent the severity of stroke among those with rehabilitation, and included: surgery (77%), mechanical ventilation (5%) secondary hemiplegia or hemiparesis (22%), and residual neurologic deficits (5%). Rehabilitation usage was more often among patients treated in larger teaching hospitals (97% users in tertiary and regional hospitals), and less often used in public hospitals (24%).
In Table 2, the ICC from a 2-level unconditional means model (with only the hospital as a random effect) was 0.63 (5.57/8.86). These data indicate that hospitals largely varied, even after accounting for hospital random effects. Using the patient-level variables as the predictors (Model 2), we found that items with positive effects included age older than 63 years (OR = 1.17, P < 0.001), ICH (OR = 1.14, P < 0.001), secular trend (OR = 1.08, P < 0.001), prior surgeries (OR = 3.82, P < 0.001), and hemiplegia or hemiparesis (OR = 2.31 P < 0.001). On the contrary, negative factors were male gender (OR = 0.96, P < 0.05), higher income (OR = 0.75, P < 0.001), higher ECM scores (OR = 0.95, P < 0.001), use of mechanical ventilation (OR = 0.89, P < 0.01), and neurologist's care participation (OR = 0.77, P < 0.001).
TABLE 1 (Continued).
Description and Rehabilitation Usage of Subjects With Ischemic Stroke or Intracranial Hemorrhage (n = 82,886)
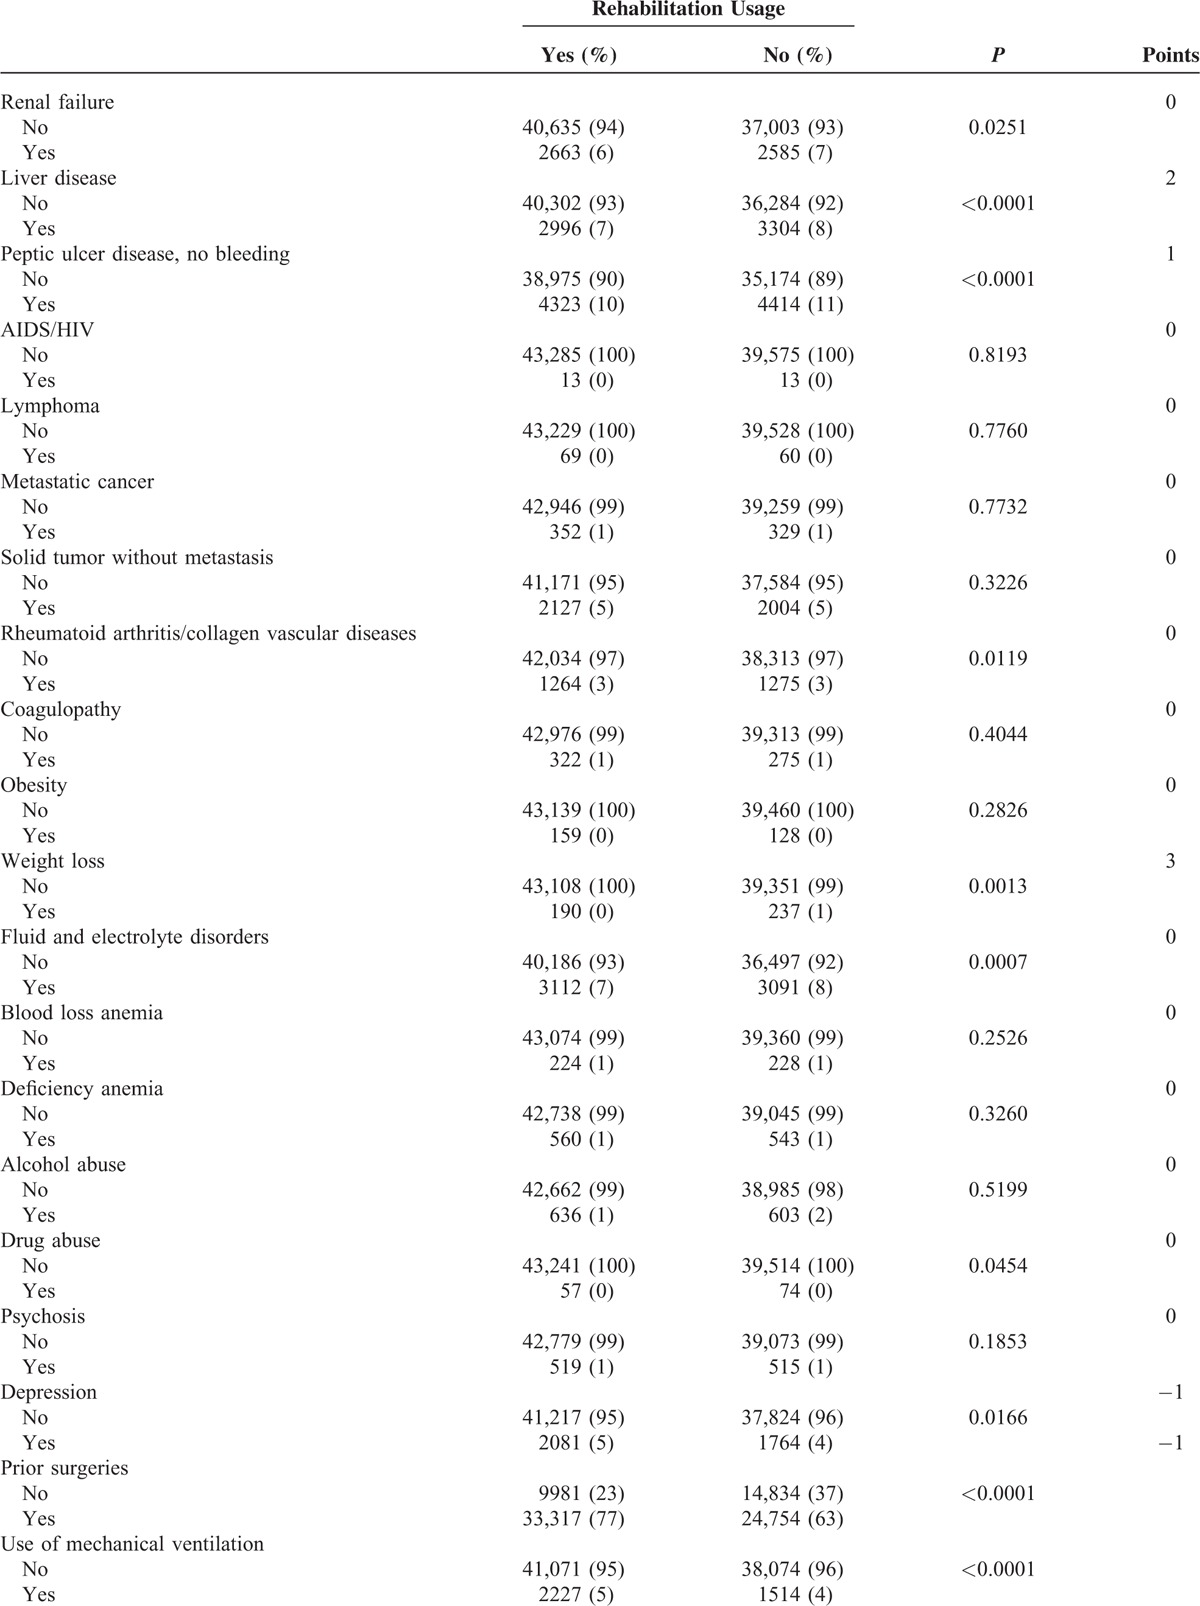
TABLE 2.
Final GLMM of Rehabilitation Usage Showing Fixed-Effect Hospital-Level, Patient-Level, and Cross-Level Interactions
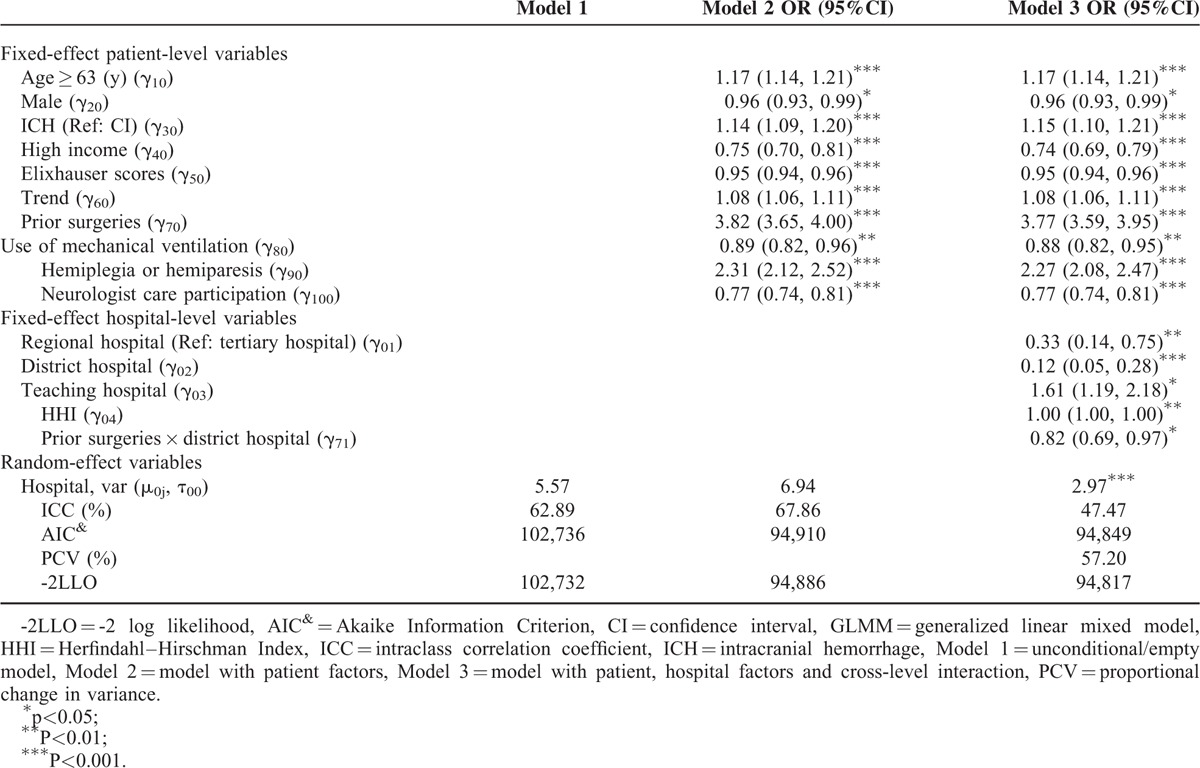
The results of Model 3 are also shown in Table 2. After adding the hospital variables to the model, the small hospitals were less likely to utilize rehabilitation (e.g., the OR for the district hospital = 0.12, P < 0.001). Teaching hospitals and less competitive markets (large HHI value) were associated with rehabilitation usage (OR for teaching hospitals = 1.61, P < 0.05 and OR for HHI = 1.00, P < 0.01). Only one of the interaction terms (prior surgery × district hospital) was significant (OR = 0.82, P < 0.05), which indicates that the patients who had undergone surgery in a smaller hospital were significantly less likely to use rehabilitation services.
Model 3 showed that only the random effect for the hospital intercept (2.97, P < 0.001) had statistically significant random effect compared with Model 2. The large PCV% (57.20%) and smaller ICC (67.86% reduced to 47.47%) in Model 3 indicate that after accounting for both patient and hospital characteristics, there was a large amount of variability in rehabilitation usage that can be explained by these hospital variables. Compared with the patient-level model, the variance associated with patient rehabilitation usage was reduced by almost 60% in the final model (PCV = 57.20%) due to the addition of the hospital type variables. The lowest AIC value was present in the final model (Model 3), which indicates that the final model offered superior GOF and predictive power. Model 3 has similar ICC% and PCV% values compared with Model 2 but offers a better fit. After fitting a dispersion parameter for the sensitivity analyses, we obtained the dispersion parameter 0.95 (data not shown) (approximately 1.00) and found that the fixed effects fitting a dispersion parameter is similar to the results we see in Model 3 of Table 2. This result indicates that our conclusions were robust when alternative statistical approaches were used.
DISCUSSION
Using large, recent longitudinal claims data from the entire stroke-afflicted population in Taiwan, this study presents population-level evidence corresponding to the use of inpatient stroke rehabilitation services. In the GLMM model, we found that rehabilitation usage varied substantially across hospitals and that only a small amount of this variation remained significant after patient-, hospital-, and cross-level interaction variables were identified.
Hospital type was the only hospital-level variable that was significantly associated with rehabilitation usage. This variable can explain approximately 60% of variability in rehabilitation usage. A study by Reistetter et al21 stated 6% to 8.5% of variability attributable to the hospital, and Lee et al4 found almost insignificance for the hospital-related variables. The discordance may result from the differences in healthcare systems and study methods (e.g., GLMM model) or the sample size. Compared with other countries, Taiwan provides few provisions for rehabilitation services in terms of staff and rehabilitation care facilities,4 and the small hospitals could not recruit sufficient rehabilitation staff and equipment for rehabilitation care. Low payment fee may be another excuse. These factors may explain why 60% of the variability in rehabilitation usage is attributable to the hospital type.
For patient-level variables, older people and low-income patients had more association of rehabilitation usage. In McKevitt's report,22 older people had been stated to have more physical and occupational therapies, although no relationship between socioeconomic status and the rehabilitation usage. However, our result showed that low-income patients used more rehabilitation service. For comorbidity and severity associated with rehabilitation usage, our patients with more comorbidity less experienced rehabilitation services but patients with more severe conditions (i.e., prior surgery and hemiplegia/hemiparesis) were prone to use more rehabilitation services. One study ever showed that the patients with more comorbid conditions (Charlson scores) were not associated with rehabilitation usage.4 Another study showed that older stroke patients with more comorbid conditions (total number of comorbidities) were associated with less rehabilitation usage.23 Our study proved that a majority of stroke patients with a single higher ECM score undertakes less rehabilitation usage. We think our study here is clear and powerful, because the ECM score has been found to be statistically superior to the Charlson index in adjusting for comorbidity.16 In terms of severity, prior studies found that patients with more severe conditions (had 1 or more inpatient admissions) were associated with greater rehabilitation usage except the use of mechanical ventilation.4,23 Our research was consistent with these results, and we added the conclusion about the interaction between hospital type and patient severity. This analysis of cross-level interactions revealed the lesser rehabilitation utilization of stroke patients with more severe conditions (e.g., surgery) in the smaller hospitals. In brief summary, the patients treated at smaller hospitals may not easily get rehabilitation services, and the phenomenon may be worse for those with poorer health. The disparity of rehabilitation usage may thus require further analysis.
In addition, previous research has shown that being male was a factor associated with decreased rehabilitation usage, but the influence of this variable approached insignificance (P = 0.06).23 However, previous research relevant to the gender differences in the Colorado stroke registry found that male patients may use fewer rehabilitation services,24 a finding similar to ours. The reason for the gender difference merits further investigation. In addition, the issue of neurologist involvement associated with rehabilitation usage was also of interest in this analysis. Approximately 50% of the patients did not use rehabilitation care, including those who saw a neurologist. Some patients who used neurologists’ services had worse physical conditions, such as respiratory or renal failure, and stayed in the ICU until death, leading to an absence of rehabilitation requests. In addition, stroke may be the second event after hospitalization; for example, patients may experience congestive heart failure and then stroke.
In past years, there were growing uses of the GLMM model for the data correlations and analyses. Nevertheless, the quality of reporting still has room for improvement. For example, variance estimates of random effects were described in only 9% of 443 articles.25 Moreover, there were only 37% and 15% of the articles with the method of covariate selection and method of GOF, respectively. If little emphasis of the literatures on the GLMM model for the readers, the reported results can be regarded unreliable. For example, the default method in Proc Glimmix cannot provide an approximation for the actual likelihood of the data; thus, these methods cannot be used to compare models by using LLR or AIC. The Laplace approximation can obtain this type of approximation and therefore can increase the order of accuracy.26 In our study, we carefully followed the guidelines for GLMM model reporting guidelines.25 Our variable response distribution was the Bernoulli distribution. We used SAS version 9.4 and adopted Proc Glimmix as statistical function using the Laplace estimation method. We used the Wald t to test for fixed effects, the likelihood ratio test for random effects, and the variance/covariance estimates of random effects. Our patient- and hospital-level variables were added as fixed effects by using backward elimination (method of variable selection). The final model was confirmed by the lowest AIC value (method of GOF) and was verified by the GLMM validation. We performed a sensitive analysis for the overdispersion check.20 This detailed execution of the GLMM model has made our results more accurate.
There are some limitations in our study. First, our claims database lacked the information about the topographic area of stroke in brain and the ischemic stroke subtypes; thus, the impact of these factors on rehabilitation usage cannot be determined. Second, we were not able to access the differences in hospital rehabilitation facilities. In general, the hospitals categorized as acute level-I hospitals may have higher rehabilitation rates. According to the Emergency Medical Services Act in Taiwan, the emergency facilities in the hospitals were graded by the available expertise and medical capability to deal with the emergencies.27 In our study the acute level-I hospitals are almost always the tertiary hospitals. The convenience of rehabilitation after acute stroke care in these hospitals may be the commonest cause for the higher usage rate. Third, we could not get the information from the NHI database about the function outcome of rehabilitation after acute strokes. This may be the following issue for us to explore about the subacute care and chronic demand.
CONCLUSIONS
With strict GLMM model specifications, we identify that hospital type and its cross-level interaction accounted for 57% of the total variation in rehabilitation usage. From this analysis, larger variation in rehabilitation utilization among our stroke patients implies the needs to improve the rehabilitation utility in the smaller hospitals in Taiwan.
Supplementary Material
Acknowledgment
Editing service was provided by American Journal Experts (AJE, 769F-03A9-5C86-0CF0-6F1F).
Footnotes
Abbreviations: AIC = Akaike Information Criterion, CI = cerebral infarction, ECM = Elixhauser Comorbidity Measures, GLMM = generalized linear mixed model, HHI = Herfindahl–Hirschman Index, ICC = intraclass correlation coefficient, ICH = intracranial hemorrhage, NHIA = National Health Insurance Administration, PCV = proportional change in variance.
This study was supported by grants from the Cardinal Tien Hospital (CTH-103-1-2B05) in Taiwan.
The authors have no conflicts of interest to disclose.
Supplemental Digital Content is available for this article.
REFERENCES
- 1.Kalra L, Langhorne P. Facilitating recovery: evidence for organized stroke care. J Rehabil Med 2007; 39:97–102. [DOI] [PubMed] [Google Scholar]
- 2.Arrich J, Mullner M, Lalouschek W, et al. Influence of socioeconomic status and gender on stroke treatment and diagnostics. Stroke 2008; 39:2066–2072. [DOI] [PubMed] [Google Scholar]
- 3.Goldstein LB, Matchar DB, Hoff-Lindquist J, et al. Veterans Administration Acute Stroke (VASt) Study—Lack of race/ethnic-based differences in utilization of stroke-related procedures or services. Stroke 2003; 34:999–1003. [DOI] [PubMed] [Google Scholar]
- 4.Lee HC, Chang KC, Huang YC, et al. Inpatient rehabilitation utilization for acute stroke under a universal health insurance system. Am J Manag Care 2010; 16:E67–E74. [PubMed] [Google Scholar]
- 5.Ottenbacher KJ, Graham JE. The state-of-the-science: access to postacute care rehabilitation services. A review. Arch Phys Med Rehabil 2007; 88:1513–1521. [DOI] [PubMed] [Google Scholar]
- 6.Buntin MB. Access to postacute rehabilitation. Arch Phys Med Rehabil 2007; 88:1488–1493. [DOI] [PubMed] [Google Scholar]
- 7.Resnik L. Research and data systems to promote equal access to postacute rehabilitation. Isr J Health Policy 2013; 2:28. [DOI] [PMC free article] [PubMed] [Google Scholar]
- 8.Snijders TAB, Bosker RJ. Multilevel Analysis: An Introduction to Basic and Advanced Multilevel Modeling. Chap 14, Discrete Dependent Variables 1st ed.London: SAGE; 1999; 223-224. [Google Scholar]
- 9.Austin PC, Tu JV, Alter DA. Comparing hierarchical modeling with traditional logistic regression analysis among patients hospitalized with acute myocardial infarction: should we be analyzing cardiovascular outcomes data differently? Am Heart J 2003; 145:27–35. [DOI] [PubMed] [Google Scholar]
- 10.Fung V, Schmittdiel JA, Fireman B, et al. Meaningful variation in performance: a systematic literature review. Med Care 2010; 48:140–148. [DOI] [PubMed] [Google Scholar]
- 11.Drye EE, Chen J. Evaluating quality in small-volume hospitals. Arch Intern Med 2008; 168:1249–1251. [DOI] [PubMed] [Google Scholar]
- 12.Ogbu UC, Slobbe LC, Arah OA, et al. Hospital stroke volume and case-fatality revisited. Med Care 2010; 48:149–156. [DOI] [PubMed] [Google Scholar]
- 13.National Quality Forum. STK10: Stroke and Stroke Rehabilitation: Rehabilitation Services Ordered. http://www.qualityforum.org/Measures_Reports_Tools.aspx Accessed February 26, 2015. [Google Scholar]
- 14.Centers for Medicare & Medicaid Services. Physician Quality Reporting System. http://www.cms.gov/Medicare/Quality-Initiatives-Patient-Assessment-Instruments/PQRS/index.html?redirect=/PQRS/15_MeasuresCodes.asp Accessed February 26, 2015. [Google Scholar]
- 15.Elixhauser A, Steiner C, Harris DR, et al. Comorbidity measures for use with administrative data. Med Care 1998; 36:8–27. [DOI] [PubMed] [Google Scholar]
- 16.Southern DA, Quan H, Ghali WA. Comparison of the Elixhauser and Charlson/Deyo methods of comorbidity measurement in administrative data. Med Care 2004; 42:355–360. [DOI] [PubMed] [Google Scholar]
- 17.van Walraven C, Austin PC, Jennings A, et al. A modification of the Elixhauser comorbidity measures into a point system for hospital death using administrative data. Med Care 2009; 47:626–633. [DOI] [PubMed] [Google Scholar]
- 18.Merlo J, Yang M, Chaix B, et al. A brief conceptual tutorial on multilevel analysis in social epidemiology: investigating contextual phenomena in different groups of people. J Epidemiol Community Health 2005; 59:729–736. [DOI] [PMC free article] [PubMed] [Google Scholar]
- 19.Yee TW, Wild CJ. Vector generalized additive models. J R Stat Soc Ser B 1996; 58:481–493. [Google Scholar]
- 20.Wiley, Brown H, Prescott R. Applied Mixed Models in Medicine. 3rd ed.2014. [Google Scholar]
- 21.Reistetter TA, Kuo YF, Karmarkar AM, et al. Geographic and facility variation in inpatient stroke rehabilitation: multilevel analysis of functional status. Arch Phys Med Rehabil 2015; 96:1248–1254. [DOI] [PMC free article] [PubMed] [Google Scholar]
- 22.McKevitt C, Coshall C, Tilling K, et al. Are there inequalities in the provision of stroke care? Analysis of an inner-city stroke register. Stroke 2005; 36:315–320. [DOI] [PubMed] [Google Scholar]
- 23.Freburger JK, Holmes GM. Physical therapy use by community-based older people. Phys Ther 2005; 85:19–33. [PubMed] [Google Scholar]
- 24.Smith DB, Murphy P, Santos P, et al. Gender differences in the Colorado Stroke Registry. Stroke 2009; 40:1078–1081. [DOI] [PubMed] [Google Scholar]
- 25.Casals M, Girabent-Farres M, Carrasco JL. methodological quality and reporting of generalized linear mixed models in clinical medicine (2000–2012): a systematic review. PLoS One 2014; 9:e112653. [DOI] [PMC free article] [PubMed] [Google Scholar]
- 26.Bolker BM, Brooks ME, Clark CJ, et al. Generalized linear mixed models: a practical guide for ecology and evolution. Trends Ecol Evol 2009; 24:127–135. [DOI] [PubMed] [Google Scholar]
- 27.Department of Health, Executive Yuan, Taiwan, ROC. Emergency Medical Services Act. http://dohlaw.doh.gov.tw/Chi/EngContent.asp?msgid=112 Accessed March 28, 2015. [Google Scholar]
Associated Data
This section collects any data citations, data availability statements, or supplementary materials included in this article.


