

Ovary sequential development and silk growth, but not ovary growth, explain the changes with water deficit in ovary abortion and in its spatial distribution along the ear of maize plants.
Abstract
Grain abortion allows the production of at least a few viable seeds under water deficit but causes major yield loss. It is maximum for water deficits occurring during flowering in maize (Zea mays). We have tested the hypothesis that abortion is linked to the differential development of ovary cohorts along the ear and to the timing of silk emergence. Ovary volume and silk growth were followed over 25 to 30 d under four levels of water deficit and in four hybrids in two experiments. A position-time model allowed characterizing the development of ovary cohorts and their silk emergence. Silk growth rate decreased in water deficit and stopped 2 to 3 d after first silk emergence, simultaneously for all ovary cohorts, versus 7 to 8 d in well-watered plants. Abortion rate in different treatments and positions on the ear was not associated with ovary growth rate. It was accounted for by the superposition of (1) the sequential emergence of silks originating from ovaries of different cohorts along the ear with (2) one event occurring on a single day, the simultaneous silk growth arrest. Abortion occurred in the youngest ovaries whose silks did not emerge 2 d before silk arrest. This mechanism accounted for more than 90% of drought-related abortion in our experiments. It resembles the control of abortion in a large range of species and inflorescence architectures. This finding has large consequences for breeding drought-tolerant maize and for modeling grain yields in water deficit.
Breeding has led to a massive increase in maize (Zea mays) yield under water deficit over the last 50 years (Cooper et al., 2014; Lobell et al., 2014), in good part associated with the fine-tuning of the coordination of the developments of the ear and the whole plant. This coordination is currently approached by breeders via the anthesis-silking interval (ASI), which has decreased markedly with genetic progress (Bolaños and Edmeades, 1996; Duvick, 2005). ASI is the time elapsing from male flowering to the emergence of styles (silks) over the modified leaf sheaths (husks) that enclose the ear and is the phenological stage with a maximum sensitivity to water deficit (Denmead and Shaw, 1960; Grant et al., 1989). An irreversible switch in ear development is observed when water deficit is imposed at this time, resulting in ovary/grain abortion, even when viable pollen is provided to silks (Boyer and Westgate, 2004). The causal link between the timing of silk emergence and ovary abortion is not clearly understood. It has been proposed that increase in ASI is a symptom rather than a mechanism causing abortion and that both would be due to a decreased assimilate flux toward the ear (Edmeades et al., 1993, 2000). This would be in line with studies suggesting that sugar deprivation is a major cause of ovary abortion (Boyle et al., 1991; Zinselmeier et al., 1995a, 1995b, 1995c, 1999; McLaughlin and Boyer, 2004). However, water deficit can cause ovary abortion even when ovary sugars are not depleted (Schussler and Westgate, 1995; Andersen et al., 2002) and has a larger effect on ovary abortion than a low-light treatment that causes a similar decrease in photosynthesis (Schussler and Westgate, 1991). This suggests that part of ovary abortion under water deficit is due to a direct effect of low water potential (Ψp), independently of assimilate supply.
The development of inflorescences is involved in the control of ovary abortion in several species such as trees (Cawoy et al., 2007) or indeterminate legumes (Ney et al., 1994; Egli and Bruening, 2006). In these species, abortion occurs in youngest ovaries that do not reach a critical stage at a given date (Ney et al., 1994; Egli and Bruening, 2006). The maize ear can be analyzed as a coalesced inflorescence because it is composed of spikelet pairs arranged in rings sequentially initiated at the ear apex (Bonnett, 1940; Kiesselbach, 1949), thereby suggesting that the above mechanism may apply to maize. Furthermore, the fertilization of basal, oldest ovaries can stop the development of younger, apical ovaries and cause their abortion, in particular when fertilization occurs at two different dates via an artificial asynchronous pollination (Freier et al., 1984; Cárcova and Otegui, 2001). Water deficit might reproduce such a sequence of events because water deficit strongly decreases silk growth (Fuad-Hassan et al., 2008), thereby generating a delay in silk emergence from the basal to the apical ovary cohorts followed by a naturally occurring asynchronous fertilization.
We have tested if a mechanism linked to the sequential development of ovaries and to the timing of silk emergence could be a major cause of ovary abortion under water deficit. For that, we have explored a range of abortion rates caused by various degrees of water deficit in different genotypes and by the timing of pollination in well-watered (WW) plants. In all treatments, we measured the growths of ovaries and silks as a function of time and position on the ear. A novel position-time model allowed us to interpolate temporal patterns of growth from the spatial position of ovaries along the ear. This model is equivalent to those based on the plastochron index for leaf development (Erickson and Michelini, 1957; Meicenheimer, 2014), in which organs of different generations are analyzed as having common growth rates with delayed development stages according to their spatial positions. We could analyze in this way the links between the abortion frequency of apical ovaries, the temporal patterns of ovary and silk growth, and the base-to-apex gradient of development. The involvement of carbon metabolism in those processes is analyzed in a companion article in a series of experiments with the same protocol as that of this study (Oury et al., 2016).
RESULTS
A Range of Abortion Rates Was Caused by Water Deficits with Limited Effects on Photosynthesis and Transpiration
Drought treatments in experiment 1 (Exp1) caused massive abortion rates, from 29% to 77% (Fig. 1; Table I), resulting in decreased grain numbers, 394 and 146 grains, respectively, in WD1 (soil Ψp = −0.22 MPa; Fig. 2A) and WD2 (Ψp= −0.48 MPa). WD3 in Exp2 (Ψp = −0.6 MPa; Fig. 2D) resulted in higher abortion rates with large differences between hybrids (Fig. 1). Abortion occurred in spite of the fact that treatments had a limited effect on transpiration rate (32% and 54% in Exp1; Fig. 2, B and D) and photosynthesis (26% and 42% in Exp1; Fig. 2C). The number of ovaries per ear was similar in WW and water deficit plants at the onset of water deficit, close to the final number of ovaries 23 d after silk emergence in WW plants. This indicates that water deficit acted on grain number via ovary/grain abortion. The slight decrease in ovary number observed in the severe water deficit treatment of Exp2 (Fig. 1) probably reflected the difficulty of quantifying at that stage the number of very small aborted ovaries at apical positions of the ear. It is worth mentioning that silks were hand-pollinated every day with fresh pollen of WW plants, so observed abortions were not a consequence of a lack of pollen availability or viability.
Figure 1.

Grain number per ear (colored bars) and number of aborted ovaries per ear (white bars) in all treatments, experiments, and genotypes in Exp1, experiment 2 (Exp2), and experiment 3 (Exp3). Green, WW and normal pollination (N); yellow, mild water deficit (WD1); red, moderate water deficit (WD2) and severe water deficit (WD3) in Exp1 and Exp2, respectively; gray, synchronous pollination (S); black, asynchronous pollination (AS). Plants were hand-pollinated daily with fresh pollen from well-watered plants. Error bars indicate se (n ≥ 3). Different letters indicate significant differences in a Kruskal-Wallis test (P < 0.05): black letters are for grain number and red letters are for number of aborted ovaries.
Table I. Environmental conditions during the three experiments in growth chamber (GC) or greenhouse (GH).
T, Temperature (°C); VPD, vapor pressure deficit (kPa); PPFD, photosynthetic photon flux density (mol m−2 d−1). Photoperiod is in hours. Mean values (sd) from tassel emergence to 7 d after silk emergence are shown.
Figure 2.

A and B, Time courses of soil Ψp (A) and daily transpiration (B) during the period of water deficit in the three treatments in Exp1. C, Net photosynthesis in Exp1. Mean values from 3 d after the beginning of water deficit to rewatering time (four, 19, and five replicates in WW treatment, WD1, and WD2 respectively) are shown. D, Mean daily transpiration from day 3 of water depletion to rewatering in Exp1 (WW, WD1, and WD2 treatments), Exp2 (water deficit in four maize hybrids), and Exp3 (WW treatments). Green, WW treatment; yellow, WD1; red, WD2 and WD3 in Exp1 and Exp2, respectively. Tassel emergence (TE) in A is synchronous with the beginning of water deficit; black points indicate soil Ψp after rewatering. Error bars in A and B represent 95% confidence intervals (n ≥ 4). Error bars in C and D are se values (n ≥ 3). Different letters indicate significant differences in a Kruskal-Wallis test (P < 0.05). Percentages represent transpiration or net photosynthesis in water deficit compared with WW treatment. The transpiration of control plants in the WW treatment in Exp2, not represented here, was close to 700 g d−1.
The abortion frequency increased with ovary position on the ear in all treatments. It became appreciable beyond the sixth, 20th, and 31st ovary positions in WD2, WD1, and WW treatments, respectively, and reached 100% at the 20th, 32nd, and 44th ovary positions in the same treatments (Fig. 3, A and B). This was also the case in the treatment with an asynchronous pollination in WW plants (Fig. 3, C and D), which had a spatial pattern of abortion frequency similar to that in WD1, although with larger aborted ovules, suggesting that the mechanism of abortion was partly common. Hence, we have considered the possibility that this spatial gradient was due to a difference in history of ovaries along the ear, thereby requiring a position-time model to establish correspondences between spatial positions and the time course of ovary growth and development.
Figure 3.

Abortion frequency of ovary cohorts as a function of ovary spatial position along the ear, with abortions due to water deficit in Exp1 (B) or to the timing of pollination in Exp3 (D). A and C show images of ears 23 d (A) and 15 d (C) after pollination. In B, green, WW treatment; yellow, WD1; red, WD2. In D, green, WW normal pollination (N); gray, synchronous pollination (S); black, asynchronous pollination (AS). Note that the scales differ between A and C (bars = 1 cm) and B and D because of the varying sizes of ovaries along the ear.
A Common Position-Time Model Applied to Ovaries and Silks Regardless of Plant Water Status
The first silks to emerge originated from ovaries at positions 5 to 8 from the ear base in WW plants (Fig. 4B, rankings closest to 1). The spatial origin of newly emerged silks was then checked every day. Ovaries located at positions higher than 8 carried silks that emerged sequentially, with a linear correspondence between ovary position and ranking of silk emergence (Fig. 4B). Ovaries located at positions 1 to 4 carried silks that also emerged sequentially, but in inverse order of position (position 4 first and position 1 last). Hence, the number of ovary positions carrying emerged silks first increased rapidly with time, when newly appeared silks originated sequentially from both sides of positions 5 to 8 (Fig. 5C). This rate decreased after the silks from position 1 emerged, so that the only silks to emerge were those at positions higher than 13 (Fig. 5C). Overall, nearly all silks had emerged 7 d after the first silk. The position-time pattern presented above for WW plants also applied to plants subjected to WD1 and WD2 (Fig. 4B). In particular, silks emerged sequentially with the same ranking in all three watering treatments, with the first emerged silks at positions 5 to 8 from the ear base (Fig. 4B). The main difference between treatments was the highest ovary position that carried an emerged silk.
Figure 4.

Ovary ranking for silk emergence (B), ovary ranking for volume (C), and ovary volume at silk emergence (D) as a function of ovary spatial position along the ear from base to apex in Exp1. A shows an image of an ear at silk emergence. Green, WW treatment; yellow, WD1; red, WD2. Error bars in D represent 90% confidence intervals (n ≥ 4). Bar in A = 1 cm.
Figure 5.

Time courses of silk fresh weight (A) and silk emergence in Exp1 (B) and Exp2 (C). Green, WW treatment; yellow, WD1; red, WD2 and WD3 in Exp1 and Exp2, respectively. Error bars represent 90% confidence intervals (n ≥ 4). Arrows in A indicate the date of silk growth arrest determined with time-lapse videos (Supplemental Video S1). Solid lines indicate regressions with a negative exponential equation. In C, a second equation was fitted after day 8 in one case.
The same typical V-shaped distribution also applied to ovary volume along the ear at all sampling dates (Fig. 4C; Supplemental Fig. S1). In WW plants, the largest ovaries (ranking closest to 1) were located at positions 5 to 8 regardless of sampling date. Ovary volume decreased with position at both sides of positions 5 to 8 (Fig. 4D). This unchanged ranking of volume with time was due to the fact that relative expansion rates were uniform (0.43 mm3 mm−3 d−1) at all positions of the ear from 2.5 d before silk emergence until 7 d after it (Figs. 6A and 7). As a consequence, the curves representing time courses of ovary volumes were all parallel if expressed on a log scale, with different initial volumes on day 2.5 before silk emergence (Fig. 6A). Hence, the large difference in volume between ovaries at any time reflected a temporal pattern. Plants under water deficit followed the same pattern as WW plants for ovary growth during the period from tassel emergence to silk emergence (Figs. 6, B and C, and 7A), with a nearly uniform relative expansion rate in the whole ear but with lower values than in WW plants (0.27 and 0.13 mm3 mm−3 d−1).
Figure 6.
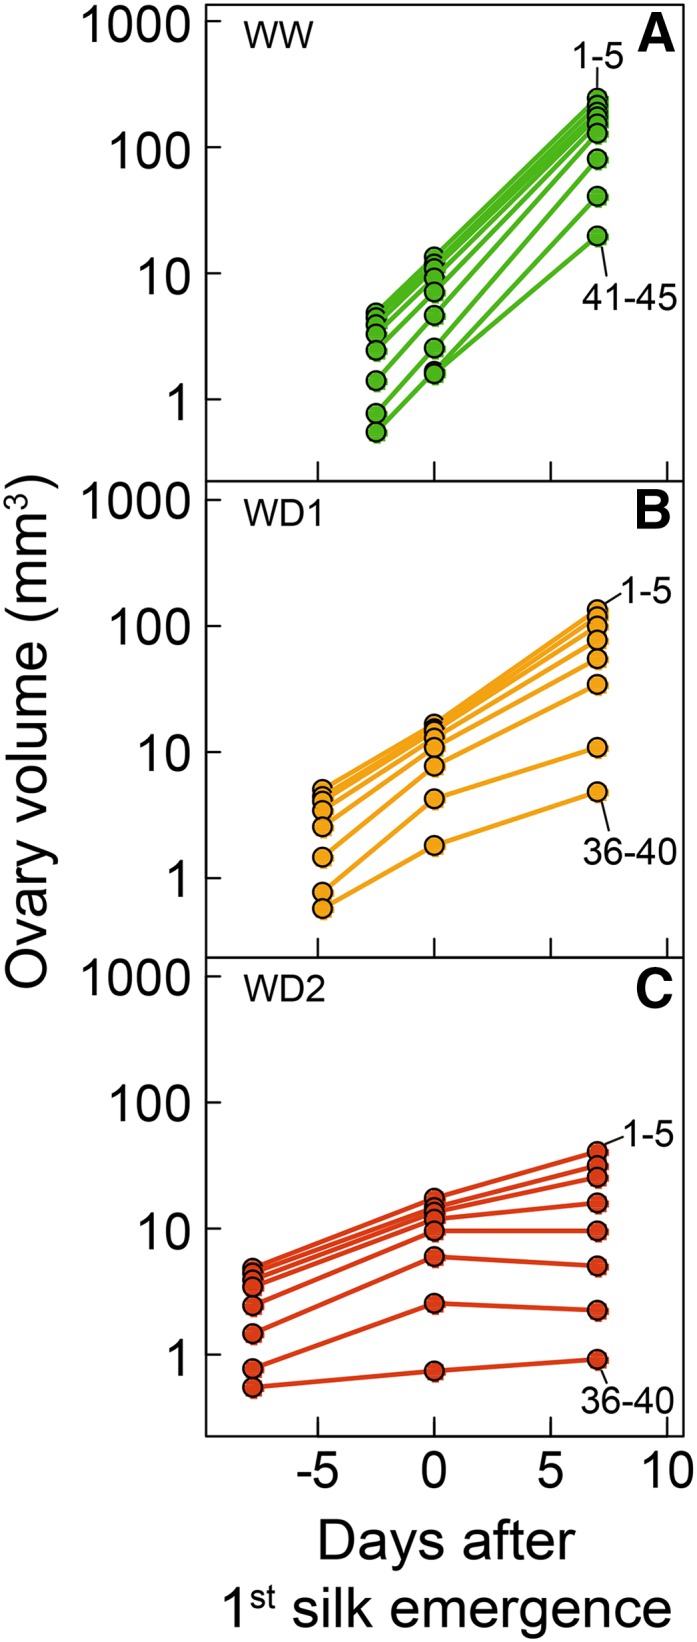
Time courses of the volume of ovary cohorts in WW (A), WD1 (B), and WD2 (C) treatments of Exp1. Ovary volumes are plotted in logarithmic scale against time after first silk emergence. Each point is the mean of five successive cohorts (1–5, 6–10, etc.) from first to 45th. Rewatering occurred 8 d after first silk emergence.
Figure 7.

Relative expansion rate (RER) of ovary cohorts calculated from tassel emergence to first silk emergence (A) and from first silk emergence to 7 d after it (B). Each point is the mean of five successive cohorts from first to 45th. Green, WW treatment; yellow, WD1; red, WD2. Error bars are se values (n = 5).
Overall, the correspondence between position and time of emergence defines a position-time model by identifying cohorts of ovaries emerging and growing sequentially, each characterized by a common position on the ear (ring of ovaries on the ear; Figs. 3A and 4A) and a synchronous development (growth and silk emergence).
The Duration of Silk Growth and Emergence Was Largely Reduced by Water Deficit and Accounted for the Differences in the Final Number of Ovaries Developing to Grains
Tassel emergence was synchronous in the three watering treatments, followed by silk emergence after 2 to 3 d in WW plants regardless of experiments and genotypes and with a delay of 2.3 and 5.3 d, respectively, in WD1 and WD2 (Table II). Silk fresh weight was reduced significantly in WD1 and WD2 treatments on the first day of silk emergence and 7 d after it (Fig. 5A), in accordance with a reduced silk length (Supplemental Video S1). Silk dry weight was reduced to a lesser extent (data not shown).
Table II. Time interval between tassel emergence (TE) and first silk emergence (SE), and ASI in the three experiments.
Water deficits were performed by reducing water supply from tassel emergence to 8 d after silk emergence. N, Normal pollination; S, synchronous pollination; AS, asynchronous pollination. All plants except in S and AS treatments were hand-pollinated daily with fresh pollen. Mean values (confidence interval P = 0.1) of at least three plants are shown.
| Experiment | Genotype | Treatment | TE to SE | ASI |
|---|---|---|---|---|
| d | ||||
| Exp1 | B73_H | WW | 2.45 (0.45) | −1.71 (0.32) |
| WD1 | 4.74 (0.66) | 0.65 (0.45) | ||
| WD2 | 7.77 (1.82) | 3.17 (1.42) | ||
| Exp2 | B73_H | WW | 2.67 (1.95) | 0.33 (1.95) |
| WD3 | 6.75 (3.66) | 5.13 (3.59) | ||
| F924_H | WW | 1.67 (0.97) | 0.33 (1.95) | |
| WD3 | 3.67 (3.07) | 2.22 (3.26) | ||
| MS153_H | WW | 3.33 (1.95) | 0.67 (2.57) | |
| WD3 | 7.13 (4.17) | 5.38 (3.95) | ||
| Oh43_H | WW | 2.00 (0.00) | 0.50 (0.68) | |
| WD3 | 5.11 (3.79) | 3.78 (3.52) | ||
| Exp3 | B73_H | N | 2.38 (0.61) | −2.12 (0.66) |
| S | 2.29 (0.55) | −2.57 (0.39) | ||
| AS | 2.50 (1.25) | −2.66 (0.85) |
Silk emergence occurred over the 7 to 8 d following the emergence of the first silk in WW plants of both Exp1 and Exp2 (Fig. 5, B and C). It stopped when nearly all ovaries of the ear (about 700; Fig. 1) carried an emerged silk (Fig. 5, B and C; i.e. when the silks of the most apical [youngest] cohort emerged from the husks). In WD2, silk emergence occurred for 2 d and stopped when 147 to 294 silks had emerged (Fig. 5C; Supplemental Video S1; i.e. less than half of ovary number). This duration was slightly longer in WD1 (Fig. 5B). All silks stopped growth simultaneously in a given plant, causing the end of silk emergence (arrows in Fig. 5A; Supplemental Video S1), probably including nonemerged silks whose apex was close to husk aperture at that time (data not shown). Furthermore, the arrest of silk growth under water deficit was independent of ovule fertilization because it occurred in extreme cases before the emergence of any silk. This was the case for 40% of plants of hybrid B73_H in Exp2, whose silks stopped growth inside the husks, without any pollination or fertilization.
The position-time model derived from the observed patterns (Fig. 4B), together with the time course of the number of emerged silks (Fig. 5, B and C), allows establishing a correspondence between the timing of silk emergence and ovary positions on the ear. At the time of emergence of cohort i, the accumulated number of emerged silks equals i × r, where r is the number of silks per cohort (i.e. the number of ovaries per ring [16 for hybrid B73_H]). This time ti was calculated for each cohort by solving Equation 3 (see “Materials and Methods”) for SNti = i × r. Abortion frequencies of cohorts in the different treatments of Exp1 are presented in Figure 8A as a function of ti. In WW plants of Exp1, all ovary cohorts carrying silks that emerged later than 4 d after the first silk finally aborted (Fig. 8A). The same applied to plants with water deficit but with shorter delays. Ovary cohorts carrying silks that emerged later than 2 d (respectively 1 d) after the first silk aborted in WD1 (respectively WD2) treatment. This switch to abortion was closely linked to the respective timings of silk emergence (that differed between cohorts) and of silk growth arrest (that was common to all cohorts). All basal cohorts that emerged at least 2 d before silk growth arrest developed into grains, all (younger) apical cohorts that emerged on the day of silk growth arrest aborted, and cohorts with intermediate silk emergence had intermediate frequency of abortion (Fig. 8B). This rule proved valid for all studied hybrids subjected to WD1, WD2, or WD3, although the spatial position of the youngest aborted ovaries changed with hybrids and treatments (Fig. 3). Hence, the switch to abortion was probably (1) related to the timing of silk emergence rather than to spatial positions of ovaries and (2) already determined at the end of silk emergence (i.e. 2–3 d after the emergence of the first silk in plants subjected to water deficit).
Figure 8.

Abortion frequency of each ovary cohort as a function of the date of cohort silk emergence relative to the first silk emergence (A) or relative to the date of silk growth arrest (B). A, WW and water deficit plants in Exp1. B, water deficit plants in Exp1 and Exp2. Green, WW treatment; yellow WD1; red WD2 and WD3 in Exp1 and Exp2, respectively.
Changes in Ovary Growth Rate Probably Occurred Later Than the Switch to Abortion
Most of the changes in abortion rate between treatments and between hybrids were already irreversible 2 to 3 d after the first silk emergence in water deficit. Indeed, the final number of emerged silks, fixed at silk growth arrest, largely accounted for differences in grain number between individual plants of Exp1 (Fig. 9A; r2 = 0.75). It also accounted for differences between treatments and hybrids (Fig. 9B; r2 = 0.94). The 1:1 line in Figure 9A indicates situations in which all ovaries bearing emerged silks would develop into grains. The vertical distance to this line (i.e. the number of ovaries that aborted although their silks had emerged and were pollinated) corresponds to the silks emerging later than 4, 2, and 1 d after first silk emergence in WW, WD1, and WD2 treatments (Fig. 8A; i.e. the silks emerging during the last few days of the period of silk emergence).
Figure 9.
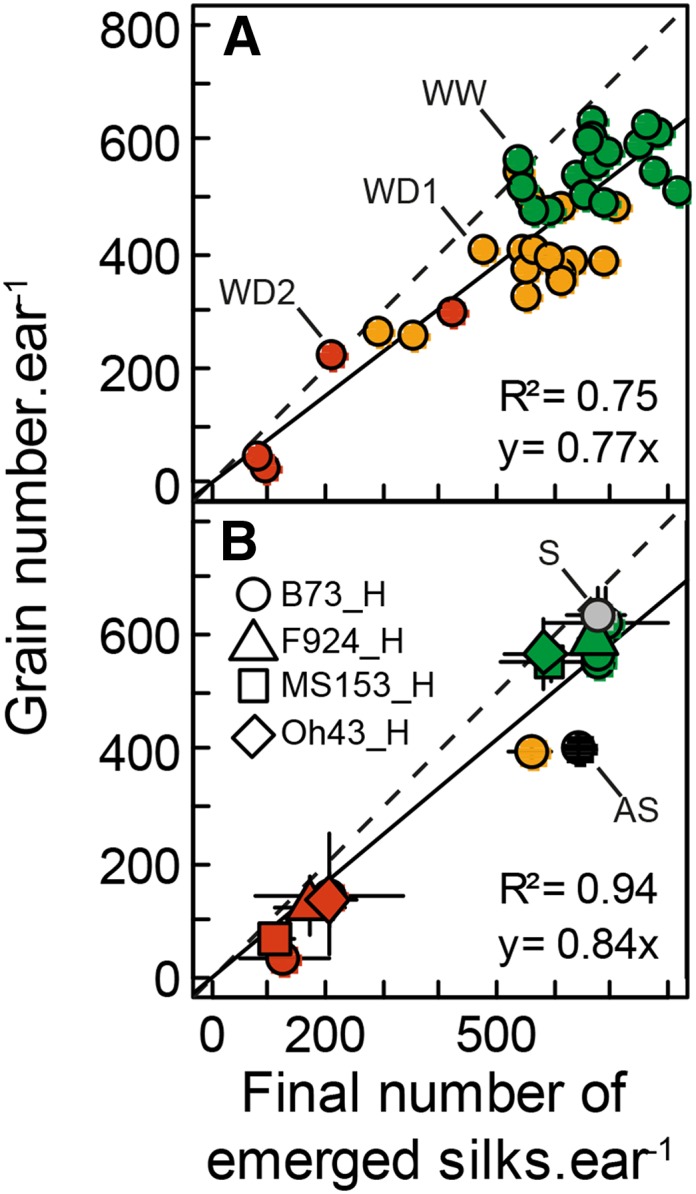
Grain number as a function of the final number of emerged silks. In A, each symbol represents a plant of Exp1. In B, each symbol represents mean values corresponding to one experimental treatment in Exp1 to Exp3. Green, WW and natural pollination; yellow, WD1; red, WD2 and WD3 in Exp1 and Exp2, respectively; gray, synchronous pollination (S); black, asynchronous pollination (AS). Solid lines indicate linear regression, and dashed lines indicate 1:1. Error bars represent 90% confidence intervals (n ≥ 3). All plants were hand-pollinated daily with fresh pollen except in treatments S and AS.
The base-to-apex gradient of abortion frequency was not associated with ovary growth rate at pollination, because the relative expansion rates of apical ovaries did not differ significantly from those of basal ovaries in any treatment (Fig. 7A). It also was not linked to ovary volume at silk emergence, which did not differ significantly between treatments at this stage at any position along the ear (Fig. 4D). The reduction in ovary growth rate (Fig. 7A) was compensated for by the delay in silk emergence in water deficit plants (Table II). For example, ovary volume at the 23rd position from the ear base was close to 10 mm3 in all treatments (Fig. 4D), whereas the abortion frequency for these ovaries was 0%, 25%, and 100% in WW, WD1, and WD2 treatments, respectively (Fig. 3B).
Appreciable gradients of relative expansion rate in the ear occurred after silk emergence (Fig. 7B). In both WD1 and WD2, basal (oldest) cohorts of ovaries continued growth with an unchanged relative expansion rate, whereas ovaries with more apical positions had a decreased rate. These changes were only appreciable 7 d after first silk emergence, suggesting that the decrease of ovary growth was a consequence of the switch to ovary abortion that occurred several days earlier, at the date of silk growth arrest.
A Second Cause for Ovary Abortion Is Linked to the Timing of Pollination
Asynchronous pollination resulted in total abortion of cohorts at the 24th to 30th ovary positions, where abortion did not occur under normal pollination (Fig. 3, C and D). The use of the position-time model showed that aborted cohorts were those with silk emergence occurring 2 to 4 d after first emergence. Synchronous pollination resulted in a near-zero abortion, including the most delayed ovary cohorts (more than 4-d delay). Aborted ovules were larger in plants with asynchronous pollination than in droughted plants (Fig. 3, A and C), consistent with the fact that abortion occurred later in the first case.
A common relationship between cohort age and abortion frequency was obtained for all treatments when considering the time of silk exposure to pollen relative to the time of first pollination (Fig. 10C) rather than the time after the first silk emergence (Fig. 10B). This suggests a role for the development of fertilized embryos at ear basal positions on the abortion of ovaries at apical positions. A natural split pollination occurred in WD1 in Exp1 (Fig. 5B), because of the second period of silk emergence that occurred after rewatering. Indeed, the number of emerged silks increased between the last two sampling dates (Fig. 5B). This was also observed on some plants in Exp2 (Fig. 5C). The newly emerged silks corresponded to silks that previously stopped growth inside the husks during the period of water deficit and recovered afterward, thereby reproducing a second period of pollination. Hence, split pollination changed the relationship between abortion frequency and date of silk emergence of the ovary cohorts (Fig. 10B). The increased vertical distance to the line 1:1 in Figure 9 in both artificial and natural (WD1) split pollination treatments corresponded to the abortion of late pollinated ovaries.
Figure 10.

A, Time course of silk emergence and silk exposure to pollen. B and C, Abortion frequency of each ovary cohort as a function of the time of silk emergence (B) or silk exposure to pollen (C) relative to first silk emergence (B) or first silk exposure (C) in Exp3. Solid lines in A represent the number of exposed silks, which differed from the number of emerged silks (dashed line) during the time ears were covered in synchronous pollination (S) and asynchronous pollination (AS) treatments. Green, WW and normal pollination (N); gray, synchronous pollination; black, asynchronous pollination.
DISCUSSION
A First Switch to Abortion Linked to the Arrest of Silk Growth in Drought-Stressed Plants
In our analysis, the first switch to abortion results from the superposition of one event that occurs sequentially on the ear, namely silk emergence, and one event that occurs at a given time, namely silk growth arrest. Abortion was observed in those ovaries carrying silks that did not emerge at least 2 d before silk growth arrest, so the shorter duration of silk growth after emergence caused the increased abortion rate. This was observed here, with increasing abortion frequencies from plants with 8-d duration in WW conditions to 2- to 3-d duration in WD3. In one hybrid (B73_H), silk growth even stopped before emergence in an appreciable proportion of plants, so this arrest was independent of ovule fertilization.
Abortion associated with water deficit during flowering time was already irreversible when silk emergence stopped, so 94% of drought-associated abortion was determined 2 to 3 d after the emergence of the first silk. The shorter duration of silk growth after silk emergence is probably the consequence of a slower silk elongation rate before emergence. The results of Fuad-Hassan et al. (2008) suggest that the duration from silk initiation to the end of growth is constant. The delay of silk emergence due to slower elongation rate, therefore, would result in a shorter duration of silk growth outside of the husks. Ultimately, silk elongation rate as affected by water deficit would be the cause of drought-related abortion, consistent with the fact that changes in the expression of genes associated with cell wall mechanical properties in silks were the first molecular events associated with drought in reproductive organs that eventually abort in the companion study (Oury et al., 2016).
The link between silk growth arrest and abortion could be due to the requirement of active silk growth to allow pollen tube progression along the silk. Indeed, tissue stiffening occurs after the end of silk growth, thereby blocking the progression of pollen tubes (Kapu and Cosgrove, 2010). The limit of 1 to 2 d before silk growth arrest might be linked to the necessary time for a pollen tube to reach the ovary through the silk (Miller, 1919). Alternatively, this limit of 1 to 2 d could correspond to the end of the period of sensitivity of ovaries to plant water status, which would occur when ovule tissues become hydraulically isolated from the mother tissues a few days after fertilization (Westgate and Grant, 1989; Bradford, 1994). In that case, abortion would include embryos just after fertilization (Westgate and Boyer, 1986).
The spatial gradients of abortion frequency, resulting from the difference in timing for silk growth and emergence across water deficit treatments and genotypes, share similarities with those observed in other species for which abortion follows the reciprocal of the pollination/fertilization gradient for ovaries within a fruit (Rocha and Stephenson, 1991; Susko, 2006), between fruits within an inflorescence (Cawoy et al., 2007), or between inflorescences within a plant (Ney et al., 1994; Egli and Bruening, 2006).
In our analysis, ovary abortion was not linked directly to ovary growth itself, which appeared as largely unrelated to abortion both temporally and spatially in the ear. In particular, the relative expansion rate of ovaries was affected at pollination by the same ratio in basal ovaries that will develop into grains and in apical ovaries that will abort later on. Accordingly, the decreased growth rate observed 7 d later for ovaries prone to abort could be the consequence and not the cause of an abortion that had already been induced several days before. Carbon availability was probably not involved either, consistent with an analysis of sugar content and activities of enzymes related to carbon metabolism, which showed no link with abortion rate at this stage in a companion study (Oury et al., 2016). Processes controlling water movements toward ovaries and silks are more likely to explain the synchronous silk growth arrest across all ovaries under water deficit. This would be consistent with studies indicating that moderate water deficits affect growth processes while organ and plant carbon status is preserved or even improved (Hummel et al., 2010; Muller et al., 2011).
A Second Switch to Abortion Linked to the Timing of Fertilization of Emerged Silks
This second switch had a small effect on abortion in water deficit, in which fertilization was almost synchronous for all ovaries because of the short window of time from silk emergence to the end of silk growth. It caused appreciable abortion in WW plants (up to 20%), with differences between hybrids, or when plant rehydration allowed silks to resume growth. Consistent with previous studies (Cárcova et al., 2000; Cárcova and Otegui, 2007; Uribelarrea et al., 2008), this second switch to abortion had a large effect when a delay of fertilization was caused by the artificial asynchrony of silk emergence or by rewatering plants with arrested silks. This caused abortion of the last cohorts of ovaries with a postponed silk exposure. This second switch was suppressed when all silks were fertilized synchronously in WW plants.
This suggests that ovaries progressively lose competence to develop into grains after the first fertilization, so a delay in pollination would cause abortion. This abortion mechanism could be that fertilization of the oldest ovules causes a whole-ear signaling process that provokes abortion of the youngest ovaries after a given time, as is the case in pea (Pisum sativum; Guilioni et al., 1997). This signal remains unknown in maize but may imply cytokinins synthesized during the early development of grains (Brugière et al., 2003), abscisic acid (Wang et al., 2002; Setter and Parra, 2010; Setter et al., 2011), or ethylene (Cheng and Lur, 1996; Habben et al., 2014).
The Events Described Here Occurred Earlier Than Those Classically Considered to Cause Abortion
The view presented above differs appreciably from that proposed by Boyer and coworkers (Boyle et al., 1991; Zinselmeier et al., 1995a, 1995b, 1995c, 1999; McLaughlin and Boyer, 2004). The experimental protocol common to these studies avoided the interaction between water deficit and silk growth occurring in natural field conditions and the two switches to abortion presented above. Indeed, in these studies, water deficit only became noticeable 2 d after silk emergence. This avoided the first switch involving silk arrest, which, according to our study, would essentially occur from 8 d before to 2 d after silk emergence. Additionally, silks were prevented from pollination after silk emergence and fertilized synchronously 5 or 6 d after it (Zinselmeier et al., 1995a, 1995b, 1995c, 1999; McLaughlin and Boyer, 2004), thereby avoiding the switch associated with pollination delay, as in the treatment with synchronous pollination in our study.
It is logical, therefore, that the series of studies by Boyer and coworkers pointed out a third switch, different from those of our study, namely carbon limitation during the postsilking period. A companion to our study (Oury et al., 2016) shows that the first signs of carbon starvation occurred 5 d after silk emergence in a series of experiments with the same protocol as that of this study. The expression of invertase genes increased in ovaries developing into grains but not in ovaries that eventually abort, consistent with previous studies (Andersen et al., 2002; McLaughlin and Boyer, 2004; Qin et al., 2004). The mechanisms associated with this period of time are unlikely to have contributed appreciably to ovary abortion in our study, given the timing of abortion, which ended 2 to 3 d after silk emergence in water deficit.
Consequences for Breeding for a Reduced Abortion Rate, for Phenotyping, and for Modeling
Reducing seed number under water deficit is an evolutionary process allowing plants to produce at least a few viable seeds so their alleles are not lost during dry years (Tardieu et al., 2014). Farmers and breeders most often wish to reduce these protections, because allele viability is usually not a major issue in agronomic conditions in which seeds can be produced in dedicated fields with favorable conditions. Farmers also wish to reduce abortion because they usually do not place plants in very dry scenarios involving a risk of total plant failure, so tolerance to mild or moderate drought scenarios is the main issue for agriculture in drought-prone environments (Tardieu, 2012; Harrison et al., 2014; Gaffney et al., 2015). Therefore, we propose that silk growth and emergence are crucial processes to take into account in breeding because they occur in moderate stresses, whereas a maintained carbon supply to ovaries in water deficit might be less crucial because this maintenance is preserved in mild or moderate water deficits observed in the field. The comparison between four hybrids suggests that an appreciable genetic variability in silk growth and emergence may exist, with a larger sensitivity for the hybrid B73_H than for the other three studied hybrids.
Phenotyping silk growth and expansion is a difficult task at least at a throughput compatible with genetic analyses. Direct phenotyping of grain number is not fully satisfactory, because grain number per unit area involves earlier events such as plant emergence and early vigor and other traits such as the number of rows per ear and of ovaries per row. High-throughput phenotyping for silk growth might be feasible via image analysis. An alternative might emerge from the genetic correlation between silk growth and leaf growth proposed by our group. In particular, the quantitative trait loci for silk weight and leaf elongation rate largely colocate in maize (Dignat et al., 2013). Those for ASI, which reflect silk growth rate (Fuad-Hassan et al., 2008), also largely colocate with quantitative trait loci of leaf elongation rate in plants subjected to water deficit (Welcker et al., 2007). This results in the unexpected fact that the sensitivity of grain number to water deficit in the field has a high genetic correlation with the sensitivity of leaf growth to water deficit measured in a phenotyping platform (Chapuis et al., 2012). If this is confirmed by further studies, phenotyping for silk growth could be at least partly deduced from that of leaf growth under water deficit (Sadok et al., 2007).
Finally, the results presented here bring elements in the current debate on plant growth drivers (carbon source versus sink-driven processes) into crop or vegetation models (Fatichi et al., 2014). They potentially have a large impact on the modeling of grain abortion and grain set, most often unsatisfactory in crop models (Boote et al., 2013). Instead of simulating them as a result of plant carbon status, it would be possible to consider the silk growth of ovary cohorts in a model, which is currently under way (C. Messina and G. Hammer, personal communication).
MATERIALS AND METHODS
Plant Material, Growing Conditions, and Pollination
Three experiments were carried out (Table I). Maize (Zea mays) plants were grown in a greenhouse in cylindrical plastic pots (12 L for Exp1 and Exp3 and 9 L for Exp2) at a plant density of three plants m−2. The genetic material included four maize hybrids obtained from the cross of the flint line UH007 with the dent lines B73, F924, MS153, and Oh43. Three seeds per pot were sown in compost composed of clay and peat 30:70 (v/v) enriched in minerals. Plants were thinned to one per pot at the two-leaf stage. Each pot was placed on a balance that allowed calculating soil water content from pot weight, corrected for plant weight estimated by regularly sampling plants (Caldeira et al., 2014). All plants were maintained at a soil Ψp above −0.12 MPa by daily irrigation, except for a short period around flowering for plants in water deficit treatments (Fig. 2A).
At tassel emergence, recorded individually in each plant, water was withheld until soil water content reached the desired soil Ψp (Fig. 2A). Pots were then watered at the end of each day to restore the desired soil Ψp, namely −0.22 and −0.48 MPa for WD1 and WD2 treatments of Exp1 and −0.6 MPa in the water deficit of Exp2 (for details, see Caldeira et al., 2014). Soil Ψp decreased during the day and reached −0.44 MPa in WD1 and −0.98 MPa in WD2 and WD3 (Fig. 2; Supplemental Fig. S2).
Plants were transferred into a growth chamber from tassel emergence to 7 d after silk emergence in Exp1, while they remained in the greenhouse in Exp2 (Table I). All plants were hand-pollinated twice a day with fresh pollen originating from WW plants distributed in the greenhouse or in the growth chamber until the last emerged silks became senescent. Exp3, involving pollination treatments, was carried out in the greenhouse in WW conditions similar to those in the other two experiments. Two pollination treatments were carried out in addition to the pollination technique presented above. Synchronous pollination was obtained by enclosing ears in bags from silk emergence to 8 d after it and then pollinating all silks with fresh pollen. An asynchronous pollination was obtained by pollinating silks for the 2 d following silk emergence, then enclosing ears in bags for 6 d, and finally pollinating all silks. Plants with silks cut every day in Exp2 (see below) were hand-pollinated 1 h after silks were cut, without any decrease in pollination success and grain set.
Photosynthesis Measurement
Plant photosynthesis was followed in Exp1 from 3 d after tassel emergence until 7 d after silk emergence on the ear leaf (leaf number 10 or 11) using the CIRAS-2 portable gas-exchange system (PP Systems) with a 2.5-cm2 leaf chamber and an air flow rate of 300 cm3 s−1. Light intensity was 425 µmol m−2 s−1 both in the growth chamber at leaf level and in the gas-exchange system. Air temperature and vapor pressure deficit in the chamber of CIRAS-2 also mimicked the environmental conditions in the growth chamber (i.e. 25°C and 1–1.5 kPa). Measurements were carried out for the whole photoperiod (16 h) of four, 19, and five plants in WW, WD1, and WD2 treatments, respectively (Supplemental Fig. S2).
Plant Sampling, Ovary Volume, and Relative Expansion Rate
Ears were sampled 1 d after tassel emergence, at silk emergence, and then 7 and 23 d after silk emergence in each treatment of Exp1. The first sampling was common to all treatments because it occurred before any water deficit. Ears were sampled 23 and 15 d after silk emergence in Exp2 and Exp3, respectively. Hence, sampling dates followed individual developmental stages of individual plants. Samples were collected at the end of the day, and fresh weights of ear and silks were measured immediately. Ears were photographed, and ovary or grain number and dimensions were measured with the software ImageJ. The width (Wo) and height (Ho) of each ovary were measured at each position along the row counted from the ear base. The ratio of cob diameter to ear diameter (Rc/e) was measured on ear cross sections across sampling dates, positions along the ear, and genotypes. Considering that ovary rows are contiguous without space between them and that ear cross sections are circular, ovary cross sections occupy the external ring of a circle of circumference No × Wo, where No is the number of rows and Wo is the mean ovary width at the considered position. Ovary volume (V) was calculated at each position along the rows as the product of cross-sectional ovary area and ovary height according to the following equation:
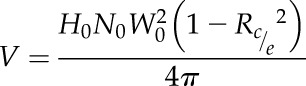 |
Because ovary growth was essentially exponential during the period studied, we characterized it with the rate of the exponential curve of ovary volume against time:
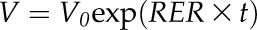 |
The ovary relative expansion rate (RER) between two sampling times, t1 and t2, was calculated at each position along the ear from the average volume measured at t1 (V1) and t2 (V2):
 |
Silk Emergence Dynamics and Grain Number
The number of emerged silks was determined daily in Exp3 on three plants per treatment with the method described by Cárcova et al. (2000). Exposed sections of silks were cut from the apical ear of the same plants. All newly exposed silks, characterized by their bisected apical end, were manually counted to develop a cumulative curve of silk emergence. Sampled silk sections were stored in 90% (v/v) ethanol solution at 4°C before counting. The number of exposed silks was counted in the same way at three developmental stages in Exp1. It was counted every day in Exp2. The number of emerged silks SNt against time t was fitted to a negative exponential equation:
 |
where SNf was the final number of emerged silks and t0 was the time of first silk emergence.
In addition, silk apices emerging out of the husks were marked with black ink in 24 plants per treatment of Exp2. Husk tissues were gently removed with a fine scalpel blade, taking care to avoid breaking the ovary-silk junctions, to allow a clear view of successive flowers and silks along the ear. The number of emerged silks inserted at each spatial position was counted to calculate the frequency of each flower position among the emerged silks. Furthermore, time-lapse videos were performed on 12 ears. Image capture was performed with an automaton, based on a Raspberry Pi (model B revision 2, Farnell element 14), which controlled image capture every 5 min of several USB cameras (C920; Logitech) and triggered additional lighting during the night at the moment of capture (approximately 4 s). Time-lapse videos are available as Supplemental Videos S1 and S2. The number of aborted ovaries was estimated at the last sampling date (15, 20, and 23 d after silk emergence in Exp3, Exp2, and Exp1, respectively).
Statistical Analyses
Comparisons of mean values between treatments, experiments, and genotypes were performed using Kruskal-Wallis nonparametric tests. All analyses were performed using R (R Core Team, 2013). The parameters of Equations 2 and 4 were estimated for each plant or treatment by least-squares fitting, using an algorithm of generalized reduced gradient (Marquardt-Levenberg algorithm in the software Sigma Plot 2004 version 9.0; SPSS Science). se values on parameters were provided by the software.
Supplemental Data
The following supplemental materials are available.
Supplemental Figure S1. Ovary ranking for volume as a function of ovary spatial position along the ear.
Supplemental Figure S2. Daily course of soil water potential, plant transpiration, and net photosynthesis in Exp1.
Supplemental Video S1. Time-lapse video of silk emergence in a maize plant under water deficit.
Supplemental Video S2. Time-lapse video of silk emergence in a well-watered maize plant.
Acknowledgments
We thank Benoît Suard, Stéphane Berthézène, Ivan Peironnenche, Célia Pequignot, and Julia Soewarto for technical support, Cloé Check and David Verney for silk counting, and Vincent Nègre for the video automaton.
Glossary
- ASI
anthesis-silking interval
- Exp1
experiment 1
- Exp2
experiment 2
- Exp3
experiment 3
- WD1
mild water deficit
- WD2
moderate water deficit
- WD3
severe water deficit
- Ψp
water potential
- WW
well-watered
Footnotes
This work was supported by the European Union (project no. FP7–244374, Drought-Tolerant Yielding Plants) and the Agence Nationale de la Recherche (project no. ANR–08–GENM–003).
Articles can be viewed without a subscription.
References
- Andersen MN, Asch F, Wu Y, Jensen CR, Naested H, Mogensen VO, Koch KE (2002) Soluble invertase expression is an early target of drought stress during the critical, abortion-sensitive phase of young ovary development in maize. Plant Physiol 130: 591–604 [DOI] [PMC free article] [PubMed] [Google Scholar]
- Bolaños J, Edmeades GO (1996) The importance of the anthesis-silking interval in breeding for drought tolerance in tropical maize. Field Crops Res 48: 65–80 [Google Scholar]
- Bonnett OT. (1940) Development of the staminate and pistillate inflorescence of sweet corn. J Agric Res 60: 25–37 [Google Scholar]
- Boote KJ, Jones JW, White JW, Asseng S, Lizaso JI (2013) Putting mechanisms into crop production models. Plant Cell Environ 36: 1658–1672 [DOI] [PubMed] [Google Scholar]
- Boyer JS, Westgate ME (2004) Grain yields with limited water. J Exp Bot 55: 2385–2394 [DOI] [PubMed] [Google Scholar]
- Boyle MG, Boyer JS, Morgan PW (1991) Stem infusion of liquid culture medium prevents reproductive failure of maize at low water potential. Crop Sci 31: 1246–1252 [Google Scholar]
- Bradford KJ. (1994) Water stress and the water relations of seed development: a critical review. Crop Sci 34: 1–11 [Google Scholar]
- Brugière N, Jiao S, Hantke S, Zinselmeier C, Roessler JA, Niu X, Jones RJ, Habben JE (2003) Cytokinin oxidase gene expression in maize is localized to the vasculature, and is induced by cytokinins, abscisic acid, and abiotic stress. Plant Physiol 132: 1228–1240 [DOI] [PMC free article] [PubMed] [Google Scholar]
- Caldeira CF, Bosio M, Parent B, Jeanguenin L, Chaumont F, Tardieu F (2014) A hydraulic model is compatible with rapid changes in leaf elongation under fluctuating evaporative demand and soil water status. Plant Physiol 164: 1718–1730 [DOI] [PMC free article] [PubMed] [Google Scholar]
- Cárcova J, Otegui ME (2001) Ear temperature and pollination timing effects on maize kernel set. Crop Sci 41: 1809–1815 [Google Scholar]
- Cárcova J, Otegui ME (2007) Ovary growth and maize kernel set. Crop Sci 47: 1104–1110 [Google Scholar]
- Cárcova J, Uribelarrea M, Borrás L, Otegui ME, Westgate ME (2000) Synchronous pollination within and between ears improves kernel set in maize. Crop Sci 40: 1056–1061 [Google Scholar]
- Cawoy V, Lutts S, Ledent JF, Kinet JM (2007) Resource availability regulates reproductive meristem activity, development of reproductive structures and seed set in buckwheat (Fagopyrum esculentum). Physiol Plant 131: 341–353 [DOI] [PubMed] [Google Scholar]
- Chapuis R, Delluc C, Debeuf R, Tardieu F, Welcker C (2012) Resiliences to water deficit in a phenotyping platform and in the field: how related are they in maize? Eur J Agron 42: 59–67 [Google Scholar]
- Cheng CY, Lur HS (1996) Ethylene may be involved in abortion of the maize caryopsis. Physiol Plant 98: 245–252 [Google Scholar]
- Cooper M, Gho C, Leafgren R, Tang T, Messina C (2014) Breeding drought-tolerant maize hybrids for the US corn-belt: discovery to product. J Exp Bot 65: 6191–6204 [DOI] [PubMed] [Google Scholar]
- Denmead OT, Shaw RH (1960) The effects of soil moisture stress at different stages of growth on the development and yield of corn. Agron J 52: 272–274 [Google Scholar]
- Dignat G, Welcker C, Sawkins M, Ribaut JM, Tardieu F (2013) The growths of leaves, shoots, roots and reproductive organs partly share their genetic control in maize plants. Plant Cell Environ 36: 1105–1119 [DOI] [PubMed] [Google Scholar]
- Duvick DN. (2005) The contribution of breeding to yield advances in maize (Zea mays L.). Adv Agron 86: 83–145 [Google Scholar]
- Edmeades GO, Bolaños J, Elings A, Ribaut JM, Banziger M, Westgate ME (2000) The role and regulation of the anthesis-silking interval in maize. In Westgate ME, Boote K, eds, Physiology and Modeling Kernel Set in Maize, Vol 29 Crop Science Society of America, Madison, WI, pp 43–73 [Google Scholar]
- Edmeades GO, Bolaños J, Hernandez M, Bello S (1993) Causes for silk delay in a lowland tropical maize population. Crop Sci 33: 1029–1035 [Google Scholar]
- Egli DB, Bruening WP (2006) Fruit development and reproductive survival in soybean: position and age effects. Field Crops Res 98: 195–202 [Google Scholar]
- Erickson RO, Michelini FJ (1957) The plastochron index. Am J Bot 44: 297–305 [Google Scholar]
- Fatichi S, Leuzinger S, Körner C (2014) Moving beyond photosynthesis: from carbon source to sink-driven vegetation modeling. New Phytol 201: 1086–1095 [DOI] [PubMed] [Google Scholar]
- Freier G, Vilella F, Hall AJ (1984) Within-ear pollination synchrony and kernel set in maize. Maydica 29: 317–324 [Google Scholar]
- Fuad-Hassan A, Tardieu F, Turc O (2008) Drought-induced changes in anthesis-silking interval are related to silk expansion: a spatio-temporal growth analysis in maize plants subjected to soil water deficit. Plant Cell Environ 31: 1349–1360 [DOI] [PubMed] [Google Scholar]
- Gaffney J, Schussler JR, Löffler C, Cai W, Paszkiewicz S, Messina C, Groeteke J, Keaschall J, Cooper M (2015) Industry scale evaluation of maize hybrids selected for increased yield in drought stress conditions of the U.S. Corn Belt. Crop Sci 55: 1608–1618 [Google Scholar]
- Grant RF, Jackson BS, Kiniry JR, Arkin GF (1989) Water deficit timing effects on yield components in maize. Agron J 81: 61–65 [Google Scholar]
- Guilioni L, Wery J, Tardieu F (1997) Heat stress-induced abortion of buds and flowers in pea: is sensitivity linked to organ age or to relations between reproductive organs? Ann Bot (Lond) 80: 159–168 [Google Scholar]
- Habben JE, Bao X, Bate NJ, DeBruin JL, Dolan D, Hasegawa D, Helentjaris TG, Lafitte RH, Lovan N, Mo H, et al. (2014) Transgenic alteration of ethylene biosynthesis increases grain yield in maize under field drought-stress conditions. Plant Biotechnol J 12: 685–693 [DOI] [PubMed] [Google Scholar]
- Harrison MT, Tardieu F, Dong Z, Messina CD, Hammer GL (2014) Characterizing drought stress and trait influence on maize yield under current and future conditions. Glob Change Biol 20: 867–878 [DOI] [PubMed] [Google Scholar]
- Hummel I, Pantin F, Sulpice R, Piques M, Rolland G, Dauzat M, Christophe A, Pervent M, Bouteillé M, Stitt M, et al. (2010) Arabidopsis plants acclimate to water deficit at low cost through changes of carbon usage: an integrated perspective using growth, metabolite, enzyme, and gene expression analysis. Plant Physiol 154: 357–372 [DOI] [PMC free article] [PubMed] [Google Scholar]
- Kapu NUS, Cosgrove DJ (2010) Changes in growth and cell wall extensibility of maize silks following pollination. J Exp Bot 61: 4097–4107 [DOI] [PMC free article] [PubMed] [Google Scholar]
- Kiesselbach TA. (1949) The structure and reproduction of corn. Research Bulletin 161; University of Nebraska, Lincoln, NE [Google Scholar]
- Lobell DB, Roberts MJ, Schlenker W, Braun N, Little BB, Rejesus RM, Hammer GL (2014) Greater sensitivity to drought accompanies maize yield increase in the U.S. Midwest. Science 344: 516–519 [DOI] [PubMed] [Google Scholar]
- McLaughlin JE, Boyer JS (2004) Sugar-responsive gene expression, invertase activity, and senescence in aborting maize ovaries at low water potentials. Ann Bot (Lond) 94: 675–689 [DOI] [PMC free article] [PubMed] [Google Scholar]
- Meicenheimer RD. (2014) The plastochron index: still useful after nearly six decades. Am J Bot 101: 1821–1835 [DOI] [PubMed] [Google Scholar]
- Miller EC. (1919) Development of the pistillate spikelet and fertilization in Zea mays L. J Agric Res 18: 881–916 [Google Scholar]
- Muller B, Pantin F, Génard M, Turc O, Freixes S, Piques M, Gibon Y (2011) Water deficits uncouple growth from photosynthesis, increase C content, and modify the relationships between C and growth in sink organs. J Exp Bot 62: 1715–1729 [DOI] [PubMed] [Google Scholar]
- Ney B, Duthion C, Turc O (1994) Phenological response of pea to water-stress during reproductive development. Crop Sci 34: 141–146 [Google Scholar]
- Oury V, Caldeira CF, Prodhomme D, Pichon JP, Gibon Y, Tardieu F, Turc O (2016) Is change in ovary carbon status a cause or a consequence of maize ovary abortion in water deficit during flowering? Plant Physiol 171: 997–1008 [DOI] [PMC free article] [PubMed] [Google Scholar]
- Qin LX, Trouverie J, Chateau-Joubert S, Simond-Cote E, Thevenot C, Prioul JL (2004) Involvement of the Ivr2-invertase in the perianth during maize kernel development under water stress. Plant Sci 166: 371–379 [Google Scholar]
- R Core Team (2013) R: A Language and Environment for Statistical Computing. R Foundation for Statistical Computing, Vienna [Google Scholar]
- Rocha OJ, Stephenson AG (1991) Order of fertilization within the ovary of Phaseolus coccineus L. Sex Plant Reprod 4: 126–131 [Google Scholar]
- Sadok W, Naudin P, Boussuge B, Muller B, Welcker C, Tardieu F (2007) Leaf growth rate per unit thermal time follows QTL-dependent daily patterns in hundreds of maize lines under naturally fluctuating conditions. Plant Cell Environ 30: 135–146 [DOI] [PubMed] [Google Scholar]
- Schussler JR, Westgate ME (1991) Maize kernel set at low water potential. II. Sensitivity to reduced assimilates at pollination. Crop Sci 31: 1196–1203 [Google Scholar]
- Schussler JR, Westgate ME (1995) Assimilate flux determines kernel set at low water potential in maize. Crop Sci 35: 1074–1080 [Google Scholar]
- Setter TL, Parra R (2010) Relationship of carbohydrate and abscisic acid levels to kernel set in maize under postpollination water deficit. Crop Sci 50: 980–988 [Google Scholar]
- Setter TL, Yan J, Warburton M, Ribaut JM, Xu Y, Sawkins M, Buckler ES, Zhang Z, Gore MA (2011) Genetic association mapping identifies single nucleotide polymorphisms in genes that affect abscisic acid levels in maize floral tissues during drought. J Exp Bot 62: 701–716 [DOI] [PMC free article] [PubMed] [Google Scholar]
- Susko DJ. (2006) Effect of ovule position on patterns of seed maturation and abortion in Robinia pseudoacacia (Fabaceae). Can J Bot 84: 1259–1265 [Google Scholar]
- Tardieu F. (2012) Any trait or trait-related allele can confer drought tolerance: just design the right drought scenario. J Exp Bot 63: 25–31 [DOI] [PubMed] [Google Scholar]
- Tardieu F, Parent B, Caldeira CF, Welcker C (2014) Genetic and physiological controls of growth under water deficit. Plant Physiol 164: 1628–1635 [DOI] [PMC free article] [PubMed] [Google Scholar]
- Uribelarrea M, Cárcova J, Borrás L, Otegui ME (2008) Enhanced kernel set promoted by synchronous pollination determines a tradeoff between kernel number and kernel weight in temperate maize hybrids. Field Crops Res 105: 172–181 [Google Scholar]
- Wang Z, Mambelli S, Setter TL (2002) Abscisic acid catabolism in maize kernels in response to water deficit at early endosperm development. Ann Bot (Lond) 90: 623–630 [DOI] [PMC free article] [PubMed] [Google Scholar]
- Welcker C, Boussuge B, Bencivenni C, Ribaut JM, Tardieu F (2007) Are source and sink strengths genetically linked in maize plants subjected to water deficit? A QTL study of the responses of leaf growth and of anthesis-silking interval to water deficit. J Exp Bot 58: 339–349 [DOI] [PubMed] [Google Scholar]
- Westgate ME, Boyer JS (1986) Reproduction at low silk and pollen water potentials in maize. Crop Sci 26: 951–956 [Google Scholar]
- Westgate ME, Grant DL (1989) Water deficits and reproduction in maize: response of the reproductive tissue to water deficits at anthesis and mid-grain fill. Plant Physiol 91: 862–867 [DOI] [PMC free article] [PubMed] [Google Scholar]
- Zinselmeier C, Jeong BR, Boyer JS (1999) Starch and the control of kernel number in maize at low water potentials. Plant Physiol 121: 25–36 [DOI] [PMC free article] [PubMed] [Google Scholar]
- Zinselmeier C, Lauer MJ, Boyer JS (1995a) Reversing drought-induced losses in grain-yield: sucrose maintains embryo growth in maize. Crop Sci 35: 1390–1400 [Google Scholar]
- Zinselmeier C, Westgate ME, Jones RJ (1995b) Kernel set at low water potential does not vary with source/sink ratio in maize. Crop Sci 35: 158–163 [Google Scholar]
- Zinselmeier C, Westgate ME, Schussler JR, Jones RJ (1995c) Low water potential disrupts carbohydrate metabolism in maize (Zea mays L.) ovaries. Plant Physiol 107: 385–391 [DOI] [PMC free article] [PubMed] [Google Scholar]