Abstract
Purpose
To explore the relationship of APT and NOE signal intensities with respect to different World Health Organization (WHO) brain tumor grades (II to IV) at 7T.
Materials and Methods
APT-based and NOE-based signals at 7T using low-power steady-state CEST were compared among de novo primary gliomas of different WHO grades (II to IV). The quantitative APT and NOE signals, calculated by fitting approach using extrapolated semi-solid MT reference (EMR) signals, were compared with the magnetization transfer ratio asymmetry (MTRasym) analysis, commonly used in APT-weighted MRI.
Results
The observed NOE signals of all glioma grades were significantly lower than normal brain tissue (p < 0.01). NOE signals significantly differed between low-grade (II) gliomas and high-grade (III & IV) gliomas (p < 0.05). APT signals showed no difference between the tumor regions for any glioma grades (M = 3.08 %, 2.64 %, and 3.10 %, 95% CI = 2.81 % ~ 3.33 %, 2.36 % ~ 2.91 %, and 2.85 % ~ 3.36 % for grade II, III, and IV, respectively), and between normal brain tissue and all glioma grades (p = 0.08, M = 4.29 % and 2.94 %, 95% CI = 3.57 % ~ 4.99 % and 2.47 % ~ 3.41 % for normal and average grade II, III, and IV), while MTRasym differed significantly between normal tissue and all glioma grades (p < 0.05).
Conclusion
NOE contributes substantially to APT weighted MRI at 7T at low RF saturation power and provides a promising biomarker for glioma grading.
Keywords: chemical exchange saturation transfer, amide proton transfer, nuclear Overhauser enhancement, glioma, tumor grade
INTRODUCTION
Gliomas are the most common primary glial neoplasms of the central nervous system, accounting for almost 80% of primary malignant brain tumors.1 Malignant gliomas remain nearly universally fatal, with a median survival of 12–15 months for grade IV and 2–3 years for grade III tumors despite of recent advances in radiation therapy, chemotherapy, and surgery.1, 2 Therefore, the grading of gliomas has clinical importance in determining a treatment strategy and evaluating prognosis.
Currently, grading of gliomas depends on the tissue histopathology as a gold standard. However, histopathologic samples obtained at biopsy may be subject to inherent sampling error because gliomas are typically heterogeneous.3 Currently, many clinicians rely on standard anatomical MR to detect and grade gliomas. Conventional T2-weighted imaging and fluid-attenuated inversion recovery (FLAIR) have been used to define gliomas and associated edema and necrosis.4 In addition, gadolinium (Gd) enhanced T1-weighted images can serve as a marker of blood-brain-barrier disruption in gliomas.5 However, gadolinium enhancement has limitations in glioma assessment due to inherent variability in enhancement patterns across different tumor grades. For example, approximately 10% of glioblastoma (GBM) and 30% of anaplastic astrocytoma demonstrate no Gd enhancement.6 Therefore, it can be difficult to identify the most malignant portion of tumor for biopsy and local therapy. Recently, advanced MR imaging, such as diffusion-weighted imaging to probe tumor cellularity,7, 8 susceptibility-weighted imaging,9, 10 and perfusion-weighted imaging11, 12 to detect tumor microvascular integrity have been introduced to characterize the physiology and metabolism of gliomas. However, they are still limited for assessment of glioma grade. Therefore, the development of additional methods for grading of primary gliomas is important for determination of prognosis and sensitivity to chemoradiotherapy.
Chemical exchange saturation transfer (CEST) imaging is a novel molecular MRI technique that can generate contrast based on the proton exchange between free bulk water protons and solute labile protons.13, 14 Using CEST MRI, endogenous low-concentration mobile biomolecules with water-exchangeable labile protons, such as polypeptides,15 glycosaminoglycans,16 glutamate,17 glucose,18, 19 glycogen,20 and creatine,21 can be detected. In addition, tissue-based physico-chemical properties, such as pH22 and temperature23, can be detected indirectly through the bulk water signal used for clinical imaging. Amide proton transfer weighted (APTw) imaging is one variant of the CEST-based molecular MRI technique that can detect endogenous mobile proteins and peptides in tissue, such as those in the cytoplasm24. Studies have shown potential clinical utility of endogenous APTw MRI for differentiating radiation necrosis from tumor recurrence/progression, and high-grade (grades III and IV) from low-grade (grades I and II) gliomas.24–26 An increased APTw signal in tumors has been attributed to increased saturation transfer due to the relatively high concentration of mobile proteins and peptides, in line with expectations from spectroscopy studies showing large amide proton signals in a malignant tumor cell line.27
The study of nuclear Overhauser enhancement (NOE) has been useful in nuclear magnetic resonance spectroscopy and has recently attracted considerable attention in the field of CEST imaging.13, 16, 28–30 The NOE signal in vivo may arise from the magnetization transfer (MT) between the water protons and aliphatic and olefinic components of mobile proteins, peptides, metabolites, and lipids, by way of an intramolecular NOE-relayed CEST process.13 This is different from the conventional magnetization transfer contrast (MTC) of semi-solid species, where through-space intermolecular dipole-dipole interaction with water dominates. The opposite of the NOE-relayed effects was first shown in exchange spectroscopy data in the brain.22, 27, 31 Based on this early work, we know that these signals have a finite line width as was recently verified by low-power NOE experiments at 7T in the human brain.28, 30 It is likely that the NOE of mobile proteins has the potential to serve as a new molecular imaging marker for some diseases, similar to the APT signal.
In this ultra-high field (7T) pilot study our aim was to explore how differences in mean intratumoral amide proton transfer (APT) and nuclear Overhauser enhancement (NOE) signals may be used to differentiate low from high WHO grade gliomas.
MATERIALS AND METHODS
Conventional MTC model
The MTC model in tissue has been theoretically well established using a two-pool model based on the modified Bloch equations, in which the free bulk water proton pool (w) is coupled to the semi-solid macromolecular proton pool (m) through magnetization exchange.32 The steady-state longitudinal magnetization of the water proton pool ( ), which has the equilibrium magnetization ( ) can be simplified to only six parameters (R, Rm, T2m, , 1/RwT2w, and Δmw):
| [1] |
where R is the fundamental rate constant describing the magnetization exchange between the two proton pools ( for the exchange from the water pool to semi-solid pool and for the reverse direction); Rw and Rm are the longitudinal relaxation rate of the free water proton pool and semi-solid macromolecular proton pool, respectively; T2w and T2m are the transverse relaxation times of the free water proton pool and semi-solid macromolecular proton pool, respectively; and is the fully-relaxed equilibrium magnetization value associated with the semi-solid macromolecular pool. The RF absorption rate, Rrfm is the rate of loss of longitudinal magnetization by direct saturation of the semi-solid macromolecular pool due to off resonance irradiation of amplitude ω1 and offset frequency Δw, which is dependent on absorption lineshape, gm (2πΔm). It should be noted that a super-Lorentzian lineshape provides the best fit to semi-solid macromolecular protons in biological tissue:33
| [2] |
| [3] |
| [4] |
where Δm is the frequency offset for the semi-solid macromolecular protons, and Δmw is the frequency difference between the semi-solid macromolecular protons and the free water protons.34
The MTC model, as described by Eq. [1], can be uniquely determined in terms of six combined model parameters by fitting the wide-offset Z-spectra, and then, the extrapolated semi-solid MT fitted curve (namely, ZEMR) can be obtained with the corresponding RF saturation power and frequency.35, 36
Subjects
The study was approved by the Johns Hopkins Institutional Review Board. Before involvement in this study, written informed consent was obtained from all patients. Ten brain tumor patients (eight males, two females; median age, 25 years; age range, 21–65 years; see Table 1 for more demographic information) underwent CEST imaging on a 7T MRI system prior to surgical resection or initiation of chemoradiation therapy. These patients were recruited from neurosurgical referrals for routine 3T presurgical functional brain mapping; only those patients who both successfully completed routine 3T presurgical fMRI examinations and consented to additional participation in our 7T research study, prior to surgical intervention. All of these patients subsequently underwent surgical biopsy or resection for definitive histopathologic diagnoses. As shown in Table I, this sample includes 6 WHO grade II, 2 WHO grade III and 2 WHO grade IV tumors.
Table 1.
Clinical/Demographic data for all 10 patients recruited for the study.
| Patient No. | Age | Sex | Lesion Location | Histology/ Tumor Grade |
|---|---|---|---|---|
| 1 | 23 | M | R superior frontal gyrus | Oligodendroglioma / 2 |
| 2 | 36 | M | R perirolandic | Oligoastrocytoma / 2 |
| 3 | 44 | M | L frontal brain | Oligodendroglioma / 2 |
| 4 | 23 | M | L perirolandic | Oligodendroglioma / 2 |
| 5 | 21 | F | L frontal lobe | Oligodendroglioma / 2 |
| 6 | 23 | M | L perirolandic | Low grade glioma / 2 |
| 7 | 23 | M | L parieto-occipital | Infiltrating astrocytoma with early anaplastic transformation / 3 |
| 8 | 22 | M | R occipital | Anaplastic astrocytoma / 3 |
| 9 | 62 | F | L frontal mass | Glioblastoma / 4 |
| 10 | 65 | M | R temporal lobe | Glioblastoma / 4 |
Pulse sequence and data acquisition
All patients were scanned on a Philips 7 T MRI scanner (Achieva 7.0 T; Philips Medical Systems, Best, The Netherlands) using a quadrature head coil for RF transmission and a 32-channel coil for reception (Nova Medical Inc., Wilmington, MA). High dielectric pads placed next to the head were applied to improve RF excitation homogeneity and minimize head motion. Standard T1-weighted MR images (MPRAGE) were acquired for structural imaging using a three-dimensional, magnetization-prepared, rapid-gradient-echo sequence; with the following parameters: TR = 4.023 s; TE = 1.81 ms; TI = 843 ms; flip angle (FA) = 7°; TI = 843 ms; 180 slices; isotropic voxel = 1 mm3.
CEST image data were obtained using a fat-suppressed, 3D multi-shot gradient-echo sequence:28, 30 TR = 71 ms; TE = 7.2 ms; FA = 12°; EPI factor = 9; 50 slices; isotropic voxel = 2 mm3. The parallel imaging SENSE factor was set to 2 × 1 (read-out) × 1.5 (anterior-posterior × right-left × foot-head). The steady-state pulsed CEST sequence for whole-brain acquisition allows for the interleaving of acquisition pulses including excitation and readout with a single-lobe sinc-gauss RF saturation pulse.28, 30 The low RF saturation power (1 μT peak amplitude, 25 ms duration, and 208° flip angle, 0.54 μT average power) and pulsed saturation scheme led to slow build up of a saturation steady state. The time for whole brain acquisition was 10.3 s per irradiation frequency and the total scan time was about 13 min. Following two dummy scans, 75 volumes at saturation frequency offsets were acquired: off (S0 image), off, −18, −14, −12, −10, −8, off, −7, −5, −4.7, −4.5, off, −4.3, −4.1, −3.9, −3.7, −3.5, off, −3.3, −3.1, −2.9, −2.7, −2.5, off, −2.0, −1.8, −1.6, −1.4, −1.2, off, −1.0, −0.8, −0.6, −0.4, −0.2, off, 0, 0.2, 0.4, 0.6, 0.8, off, 1.0, 1.2, 1.4, 1.6, 1.8, off, 2.0, 2.5, 2.7, 2.9, 3.1, off, 3.3, 3.5, 3.7, 3.9, 4.1, off, 4.3, 4.5, 4.7, 5.0, 7.0, off, 8.0, 10.0, 12.0, 14.0, 18.0 ppm (relative to the water resonance), off, and off.
Data processing
All data processing was performed using a combination of the Analysis of Functional Neuroimages37 and MATLAB (The MathWorks, Inc., Natick, MA). For pre-processing, all CEST data were registered to the saturated volume (3.5ppm) using the rigid body registration algorithm with a mutual information cost function and bicubic resampling. Second, a smoothed B-spline function was fitted to the unsaturated data in each voxel for the signal drift correction. Then the signals were reordered to generate a Z-spectrum, which displays the water intensity as a function of RF saturation frequency offset. Last, a Lorentzian curve fit was used to correct for B0 field inhomogeneity effects. The Z-spectra were interpolated with the interval step of 0.01 ppm and aligned correspondingly on a pixel-by-pixel basis with the water frequency in each voxel at 0 ppm.
Data points of small frequency offsets between 8 and −8 ppm were excluded prior to MTC fitting to avoid possible downfield CEST and upfield NOE contributions, and the frequency offsets between 0 and −1 ppm were included to improve the fitting quality. The wide-offset Z-spectra were fitted to an asymmetric two-pool MTC model with a super-Lorentzian lineshape based on the nonlinear least-squares fitting approach, which implemented the Levenberg-Marquardt algorithm. The super-Lorentzian lineshape function was evaluated by numerical integration. During the MTC fitting, on-resonance singularity can be avoided because the wide-frequency offsets were not defined at on-resonance. However, the super-Lorentzian function extrapolated from a 298 Hz offset to the asymptotic limit at zero offset was used to model the semi-solid macromolecular pool lineshape during on-resonance irradiation when drawing ZEMR curves. Fit parameter errors were estimated as the root of the sum of the signal-normalized squared difference between the fitted and experimental data, and the χ2 goodness-of-fit metric. For convenience, T1m was set as a constant value of 1.7 s because it could not be determined well from fits. was normalized to 1. Finally, quantitative APT# and NOE# were calculated by subtracting the B0-corrected experimental Z-spectra from the ZEMR curve. The quantitative APT# and NOE# were compared with the commonly used APTw parameter, namely MTRasym at 3.5ppm22, where MTR = 1 − Ssat/S0:
| [5] |
A region of interest (ROI) analysis was performed to compare the APT# and NOE# signals across all grade gliomas. Two ROIs, enclosing the normal-appearing white matter and glioma were carefully drawn on the unsaturated image. The APT#, NOE#, and MTRasym(3.5ppm) were statistically compared using a one-way ANOVA, followed by Tukey’s post-hoc test. Statistical analyses were performed using the Statistical Package for the Social Sciences (SPSS, Chicago, IL, USA). Statistical significance was accepted for p < 0.05.
RESULTS
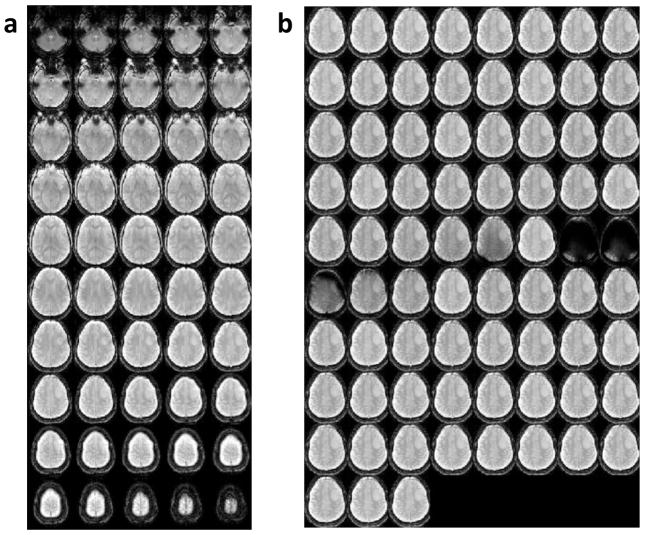
Figure 1a shows representative 3D unsaturated images of the steady-state acquisition covering the whole brain. A montage of images from a single slice image as a function of saturation frequency is shown in Fig. 1b, indicating sufficient direct water saturation on or near water resonance.
Figure 1.
A representative 3D whole-brain pulsed steady-state CEST image using low RF saturation power for a low-grade (grade II) oligodendroglioma patient. (a) 3D unsaturated images of the steady-state acquisition covering the whole brain. (b) A montage of a single slice image for saturation offset frequencies ranging from −18 to 18 ppm.
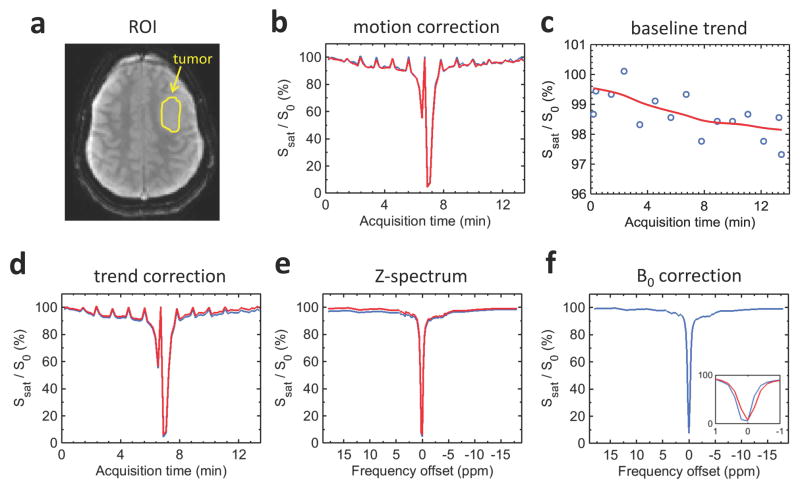
Figure 2 shows the pre-processing procedures for the CEST data including three-dimensional motion correction, baseline trend removal, and B0 correction. The normalized acquired signal of the unsaturated and saturated images is shown within the ROI defined in the tumor (yellow outline in Fig. 2a). Baseline drifts calculated based on S0 variation over the scan period are shown by a non-linear function of time due to B0 drift from heating of the passive shims when using high gradient duty cycle as shown in Fig. 2c and 2d. The motion-corrected and detrended signals were used to generate a Z-spectrum (Fig. 2e). Then, Lorentzian curve fitting was used to correct for the frequency shift of the Z-spectrum due to B0 field inhomogeneity as shown in Fig. 2f. These pre-processing steps should be performed prior to EMR fitting; otherwise it could be tracking the large scale variation in the signal, instead of the CEST effect.
Figure 2.
Pulsed steady-state CEST image preprocessing procedure. (a) Axial unsaturated image and tumor ROI (yellow outline) for a low-grade (grade II) oligodendroglioma patient. (b) Illustration of the variation of CEST signal intensity before (blue line) and after (red line) motion correction. (c) Signal drift estimate (red line) based on multiple unsaturated data (blue circles). (d) Illustration of the variation of CEST signal intensity before (blue line) and after (red line) detrending. (e) Illustration of Z-spectrum before (blue line) and after (red line) motion and trend correction. (f) Illustration of Z-spectrum before (blue line) and after (red line) B0 correction using Lorentzian fitting. The inset shows the CEST signal intensity before (blue line) and after (red line) B0 correction in the frequency offset range of −1 to 1 ppm.
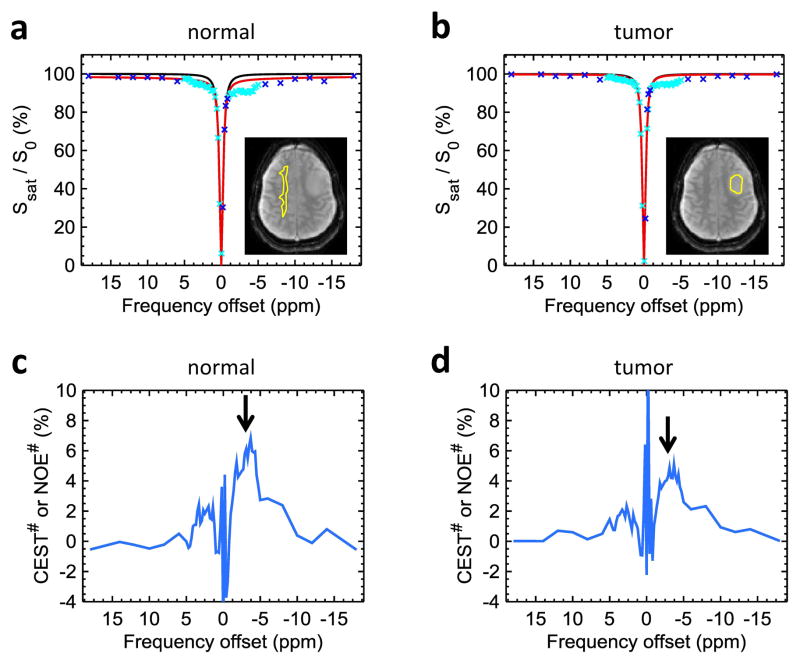
Figure 3a and 3b show the representative two-pool MTC-fitted results from the tumor and normal tissue ROIs in a low-grade (grade II) oligodendroglioma patient. The EMR model using the super-Lorentzian lineshape predicted the behavior of the conventional MTC system for wide-frequency offsets (blue crosses). Even with the low RF saturation power, the residual conventional MTC effect was observed in the normal tissue while the conventional MTC signal was largely removed in the glioma region. Figure 3c and 3d show the experimentally measured downfield CEST# (including APT# and AmineCEST#) and upfield NOE# signal features as a function of frequency offset, which were obtained by subtracting the experimental data (sky-blue crosses in Fig. 3a and 3b) from the corresponding ZEMR curves (red solid line in Fig. 3a and 3b; mainly direct water saturation effect for this tumor case). The upfield NOE# signals show a composite broad resonance between −1.5 ppm and −5 ppm as shown in Fig. 3c and 3d. The upfield NOE# signals of the normal tissue were much higher than those of the tumor (p < 0.01) as shown in Fig. 3c and 3d (black arrows) while downfield APT# (3.3 ~ 3.7 ppm) and AmineCEST# (2.0 ~ 3.1 ppm) signals showed a trend towards reduction, but this was not significant (p = 0.08, M = 2.91 % and 3.04 %, 95% CI = 2.72 % ~ 3.08 % and 3.07 % ~ 3.22% for APT# and AmineCEST# of the normal tissue, respectively, and M = 2.79 % and 2.82 %, 95% CI = 2.59 % ~ 2.97 % and 2.64 % ~ 3.00 % for APT# and AmineCEST# of the tumor tissue, respectively).
Figure 3.
Quantification of downfield CEST# and upfield NOE# signals using EMR approach. Two-pool MTC (red line) and DS models (black line) were fitted with experimental data (blue crosses) obtained from the normal-appearing white matter tissue (a) and the tumor region (b) for a low-grade (grade II) oligodendroglioma patient. Quantitative CEST# and NOE# signals were obtained by subtracting the experimental measured Z-spectra (sky-blue crosses as shown in Fig 3a and 3b) from the ZEMR data (red lines as shown in Fig 3a and 3b) in the normal tissue (c) and the tumor region (d).
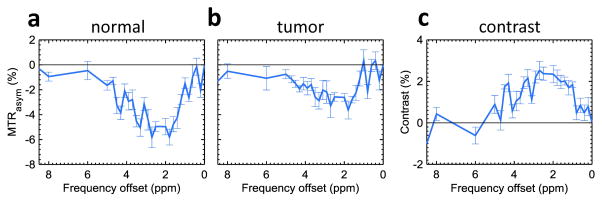
Figure 4 shows a comparison of the MTRasym spectra of the normal (Fig. 4a) and tumor tissue (Fig. 4b). As observed before, the MTRasym values were negative at most frequency offsets due to larger upfield NOE effects at the lower RF saturation power. The MTRasym signals in the frequency offset range of 1 to 5 ppm were all dominated by the upfield NOE signals. However, the NOE (positive confounding factor) enhanced the MTRasym image contrast (Fig. 4c).
Figure 4.
MTRasym spectra of the normal tissue (a) and tumor (b) ROIs as shown in Fig. 3a and 3b and MTRasym image contrast between the tumor and normal tissue (= MTRasym(3.5ppm)tumor–MTRasym(3.5ppm)normal) (c). The MTRasym values were negative at most frequency offsets due to larger upfield NOE effects at the low RF saturation power. Error bars depict standard errors.
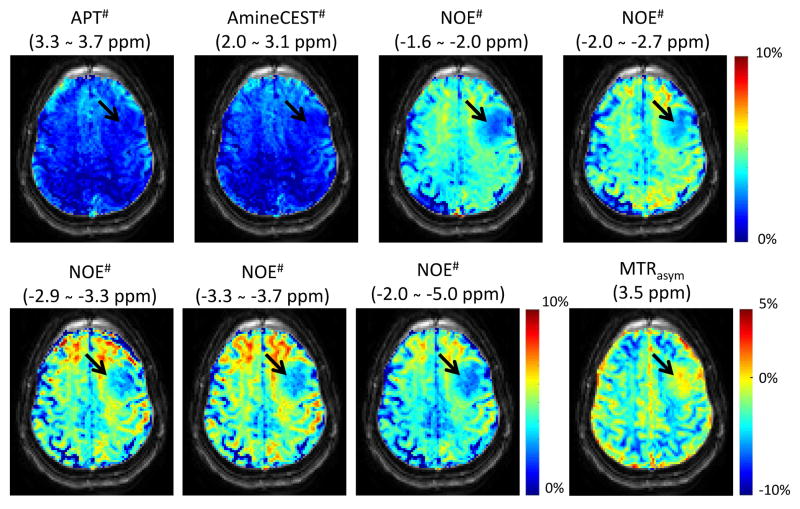
Figure 5 shows the CEST# and NOE# maps for several frequency offset ranges in the Z-spectrum. The downfield APT# map showed contrast similar to the AmineCEST# map and both were quite uniform in the white matter and gray matter. However, NOE# maps not only had much higher signals compared to the downfield CEST#, but also showed contrast between the white matter and gray matter probably due to the residual conventional MTC effect. The highest NOE# signal was observed in the frequency offset range between −3.3 ppm and −3.7 ppm. Notably, the NOE# signals of the tumor were significantly lower than those of the normal tissue (p < 0.01) while there was no contrast between tumor and normal tissue in both APT# and AmineCEST# maps due to the use of the relatively lower RF saturation power (average power ≈ 0.54 μT). The MTRasym(3.5ppm) image contrast were all dominated by the NOE# image contrast under the low RF saturation power condition.
Figure 5.
Downfield CEST#, upfield NOE#, and MTRasym(3.5ppm) maps for a low-grade (grade II) oligodendroglioma patient (black arrow: tumor core).
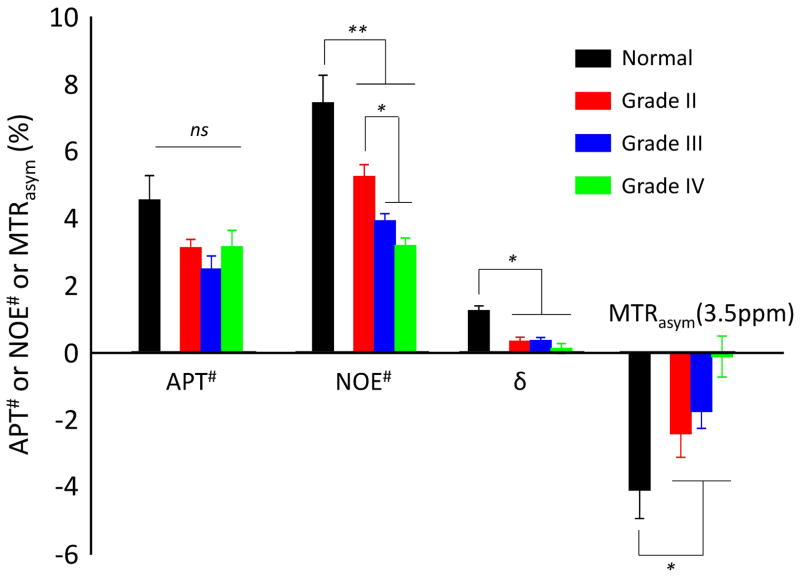
Figure 6 quantitatively compares the APT# (3.3 ~ 3.7 ppm), NOE# (−3.3 ~ −3.7 ppm), δ (MT asymmetry, = ZEMR(3.5ppm) – ZEMR(−3.5ppm)) and MTRasym(3.5ppm) signals in the normal tissue and glioma in each grade (grades II to IV). Several important results can be observed. (i) The downfield APT# signals showed no significant difference between the glioma (2.94 ± 0.41 % for average grade II, III, and IV) and normal tissue (4.29 ± 1.12 %), but a trend towards lower APT (p = 0.08). This can be explained as a consequence of the low RF saturation power used. (ii) The upfield NOE# signals of the gliomas (4.06 ± 1.03 % for average grade II, III, and IV) were significantly lower than those of the normal tissue (7.36 ± 0.82 %) (p < 0.01). (iii) The upfield NOE# signals of the grade III and IV gliomas (3.50 ± 0.52 % for average grade II and III) were significantly lower than those of grade II gliomas (5.18 ± 0.36 %) (p < 0.05) due to high water content and high intratumoral heterogeneity in the higher-grade gliomas. (iv) The upfield NOE# signals seemed lower in the grade IV gliomas (3.14 ± 0.22 %) than in the grade III gliomas (3.87 ± 0.21 %), even though this difference was not statistically significant. (v) The MTRasym(3.5ppm) signal of all grades of glioma (−1.44 ± 1.17 % for average grade II, III, and IV) was significantly higher than those of normal brain regions (−4.08 ± 0.74 %) (p < 0.05). (vi) δ of all grades of glioma (0.25 ± 0.13 % for average grade II, III, and IV) was significantly lower than those of normal brain regions (1.31 ± 0.14 %) (p < 0.05) due to large conventional MTC effect of the normal tissue.
Figure 6.
Group average APT#, NOE#, δ, and MTRasym(3.5ppm) signal intensities obtained from all three grades of glioma, as well as normal-appearing white matter tissue in a group of 10 patients. δ = ZEMR(3.5ppm) – ZEMR(−3.5ppm). Error bars depict standard errors.
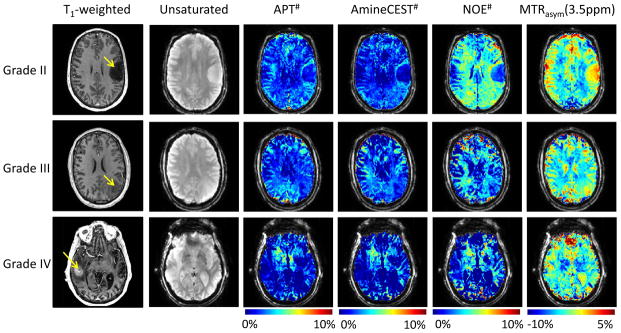
Figure 7 shows representative cases of grade II (oligodendroglioma), grade III (anaplastic astrocytoma), and grade IV (glioblastoma) gliomas, respectively. The downfield APT# and AmineCEST# signals seemed lower in the glioma (2.94 ± 0.41 % and 2.79 ± 0.88 % for APT# and AmineCEST#, respectively) than in the normal tissue (4.29 ± 0.92 % and 4.11 ± 1.01 % for APT# and AmineCEST#, respectively), even though the difference was not statistically significant (p = 0.08). However, the lower NOE# signals were observed in the all grades of gliomas while higher MTRasym(3.5ppm) signals were observed in the all grades of gliomas as compared to the normal tissue.
Figure 7.
T1-weighted and unsaturated, as well as APT#, AmineCEST#, NOE#, and MTRasym(3.5ppm) maps overlaid on a corresponding unsaturated image, for representative patients with each WHO tumor grade. Note the progressively decreasing NOE signal as the tumor grades vary from II to IV.
DISCUSSION
In this study, we assessed the ability of APT# and NOE# imaging to differentiate tumor grades of primary gliomas at 7T. The APT# and NOE# signals were compared among de novo primary gliomas of different WHO grades (I to IV). Quantitative results showed that the NOE# signals of all grades of glioma were significantly lower than those of the normal-appearing (contralesional) white matter regions. When the grade I and grade II cases were grouped as low-grade glioma and compared to the higher grade gliomas (grade III and grade IV), there was a significant difference in NOE# signals between the groups while no difference was observed between normal tissue and all glioma grades I-IV in APT# signals because the low RF saturation power used for suppressing conventional MTC also substantially reduced the detectability of the APT signal. Thus, our findings suggest that NOE# imaging may provide a promising biomarker for glioma grading at 7T MRI with low RF saturation power, in line with a previous suggestion.30
There have been many attempts to grade gliomas with unique histological features using MRI. Diffusion-weighted imaging,7,8 perfusion-weighted imaging,11, 12 susceptibility-weighted imaging,9, 10 and proton spectroscopy38, 39 have been investigated as potential imaging biomarkers for gliomas. A recent study25 by Togao et al. suggested that MTRasym(3.5ppm) signals are correlated with the cell proliferation marker Ki-67 and cell density. Further, it was also observed that MTRasym(3.5ppm) imaging has high sensitivity and specificity for discrimination between grade II and III, and high grade (IV) gliomas at 3T MRI. The MTRasym(3.5ppm) signal progressively increases with increasing glioma grade at 3T by using the MTR asymmetry approach.25 In our study, however, no difference was observed between low-grade (I and II) and high-grade (III and IV) gliomas in APT# and MTRasym(3.5ppm). Despite high cellular density in many tumors, water content in high-grade tumor enhancing regions (included in ROIs) is generally higher than in normal tissue due to the larger extravascular extracellular spaces. This leads to a general reduction in saturation in Z-spectra, conventional MTC, and CEST effects. Such an increase in extracellular water content leads to a reduction in cell-based APT/NOE saturation effects, but this should not be interpreted as an associated decrease in the mobile cellular protein and peptide contents. Previous studies25, 26 showed positive MTRasym(3.5ppm) contrast between the tumor and normal tissue with relatively higher RF saturation power (>2 μT) using asymmetry analysis. However, the NOE effects become more pronounced at the lower RF saturation power, resulting in a reduction of MTRasym(3.5ppm) signal in normal tissue, while the relative increase in tumor cells remains. One possible source for changes in APT and relayed-NOE signals is pH22, 30. The APT signal increases with pH in tissue because the amide proton exchange rate is base-catalyzed in the physiological pH range. However, the pH change is not the major contributor to the observed APT and NOE signals because there is only a small intracellular pH increase (< 0.1 pH) in the tumor with respect to normal brain tissue. Another potential factor affecting CEST and NOE signals is B1 inhomogeneity. As shown in Figure 1, however, this is not a major issue for these protons with relatively slow exchange rate (as long as variation is not more than 10~20% from the optimal B1). The inhomogeneity of the CEST# and NOE# maps as shown in Figure 5 is probably due to mild head tilt that likely contributes more to asymmetries rather than B1 field inhomogeneity.
Previous studies demonstrated the RF power dependencies of APT and NOE signals both in humans and animals.29, 40 The different power dependence of the APT and NOE peaks may result from the fact that the amide proton exchange rate is faster than the NOE-related proton exchange rate so that the NOE signal has relatively lower optimal saturation power level than the APT signal. Our NOE# data agree with the findings of Paech et al.,40 suggesting that NOE mediated CEST signal (B1 = 0.7 μT) based on MTRasym at 7T is significantly lower in glioblastoma tumors compared to contralateral normal tissue. However, the NOE mediated CEST signal based on the MTR asymmetry approach would be underestimated due to residual downfield amide protons (~ 3.5 ppm) and amine protons in glutamate (~ 2 ppm). On the contrary, the use of high RF power (~ 2 μT) can enhance the downfield APT effects relative to upfield NOE effects related to semi-solid macromolecules.
A fast low-power steady-state pulsed CEST sequence was used to acquire 3D whole-brain volumes with an acquisition time of 10.3 s per irradiation frequency at a 2 mm isotropic resolution28, 30. The pulsed CEST approach significantly reduces the repetition time (TR = 71 ms) by the interleaving of RF saturation pulses and readout gradients, and efficiently achieves steady-state CEST contrast over the whole brain by setting the readout to begin at the edge of k-space to allow a sufficient number of saturation pulses to be applied before the 3D phase encoding gradient scheme encodes near the center of k-space. The low RF saturation power was used to minimize contribution from direct water saturation and conventional MTC effect. In this study, an EMR approach based on the steady-state two-pool MTC model with a super-Lorentzian lineshape was used for the quantification of APT and NOE signals. We fitted asymmetric conventional MTC model with the wide-offset experimental data excluding the data points of small frequency offsets where possible CEST and NOE signals are present. Therefore, downfield CEST and upfield NOE contributions were largely removed in our conventional MTC model, and the obtained ZEMR baseline included only direct water saturation and conventional MTC effect. However, the observed NOE# signal with a narrower spectral width indicates an origin in mobile tissue components through a relayed transfer mechanism to the water signal. Similarly, the NOE# signal with broad lineshape under the fine structure originates from the relayed-NOE transfer mechanism, but based on fast dipolar transfer of NOEs through the semi-solid macromolecules and then to water. Thus, our measured results for the NOE# would be overestimated due to the overlapping contribution between the relayed-NOE and the semi-solid NOE via through-space dipolar coupling. Additional study limitations include use of a small patient sample size, which necessarily reduces overall statistical power. Additionally, sampling bias may have been introduced since recruitment of lower grade tumors into our research study was more readily accomplished than high grade (WHO grade IV) tumors due to the greater urgency of rapid surgical intervention immediately following the clinical presurgical fMRI examinations and generally greater neurological disability associated with glioblastomas. This accounts for the relatively small number (n=2) of glioblastomas in our study. Furthermore, a higher representation of oligodendroglial tumors was present in our sample (50%) than in the general population of glioma patients. Lastly, while the sole aim of this study was to explore differences in CEST and NOE signals among the different glioma grades, our study may have been enhanced by comparison of such results to those of more conventional MR imaging, including structural, perfusion or spectroscopic MR imaging.
In this study, we assessed the ability of APT# and NOE# imaging to differentiate histologic grades of de novo primary gliomas at 7T. We report significant differences in NOE# among tumors of varying grade. When acquiring Z-spectra using low RF power pulsed steady-state CEST acquisition with the purpose of reducing semi-solid MT contrast and reducing and narrowing direct saturation effects, saturation-transfer effects based on slow exchange are pronounced, such as upfield relayed NOE signals. Our findings suggest that NOE imaging may serve as a promising biomarker for glioma grading.
Acknowledgments
Grant Support: Johns Hopkins University Brain Science Institute grant (PI: J. Pillai), and grants from the National Institutes of Health (R01EB009731, R01CA166171, R01EB015032, and P41EB015909).
We would like to acknowledge the invaluable assistance provided by the MRI technologists at the F.M. Kirby Center for Functional Brain Imaging, led by Chief Technologist Terri Brawner, B.S., R.T.
We would like to acknowledge the invaluable assistance provided by the MRI technologists at ******.
References
- 1.Ostrom QT, Gittleman H, Liao P, et al. CBTRUS statistical report: primary brain and central nervous system tumors diagnosed in the United States in 2007–2011. Neuro Oncol. 2014 Oct;16(Suppl 4):iv1–63. doi: 10.1093/neuonc/nou223. [DOI] [PMC free article] [PubMed] [Google Scholar]
- 2.Grossman SA, Batara JF. Current management of glioblastoma multiforme. Semin Oncol. 2004 Oct;31(5):635–644. doi: 10.1053/j.seminoncol.2004.07.005. [DOI] [PubMed] [Google Scholar]
- 3.Glantz MJ, Burger PC, Herndon JE, 2nd, et al. Influence of the type of surgery on the histologic diagnosis in patients with anaplastic gliomas. Neurology. 1991 Nov;41(11):1741–1744. doi: 10.1212/wnl.41.11.1741. [DOI] [PubMed] [Google Scholar]
- 4.Law M, Yang S, Wang H, et al. Glioma grading: sensitivity, specificity, and predictive values of perfusion MR imaging and proton MR spectroscopic imaging compared with conventional MR imaging. AJNR Am J Neuroradiol. 2003;24:1989–1998. [PMC free article] [PubMed] [Google Scholar]
- 5.Felix R, Schorner W, Laniado M, et al. Brain tumors: MR imaging with gadolinium-DTPA. Radiology. 1985 Sep;156(3):681–688. doi: 10.1148/radiology.156.3.4040643. [DOI] [PubMed] [Google Scholar]
- 6.Scott JN, Brasher PM, Sevick RJ, Rewcastle NB, Forsyth PA. How often are nonenhancing supratentorial gliomas malignant? A population study. Neurology. 2002;59:947–949. doi: 10.1212/wnl.59.6.947. [DOI] [PubMed] [Google Scholar]
- 7.Bulakbasi N, Guvenc I, Onguru O, Erdogan E, Tayfun C, Ucoz T. The added value of the apparent diffusion coefficient calculation to magnetic resonance imaging in the differentiation and grading of malignant brain tumors. J Comput Assist Tomogr. 2004 Nov-Dec;28(6):735–746. doi: 10.1097/00004728-200411000-00003. [DOI] [PubMed] [Google Scholar]
- 8.Thoeny HC, Ross BD. Predicting and monitoring cancer treatment response with diffusion-weighted MRI. J Magn Reson Imaging. 2010 Jul;32(1):2–16. doi: 10.1002/jmri.22167. [DOI] [PMC free article] [PubMed] [Google Scholar]
- 9.Christoforidis GA, Yang M, Abduljalil A, et al. “Tumoral pseudoblush” identified within gliomas at high-spatial-resolution ultrahigh-field-strength gradient-echo MR imaging corresponds to microvascularity at stereotactic biopsy. Radiology. 2012 Jul;264(1):210–217. doi: 10.1148/radiol.12110799. [DOI] [PMC free article] [PubMed] [Google Scholar]
- 10.Rauscher A, Sedlacik J, Barth M, Mentzel HJ, Reichenbach JR. Magnetic susceptibility-weighted MR phase imaging of the human brain. AJNR Am J Neuroradiol. 2005 Apr;26(4):736–742. [PMC free article] [PubMed] [Google Scholar]
- 11.Aronen HJ, Gazit IE, Louis DN, et al. Cerebral blood-volume maps of gliomas - comparison with tumor grade and histologic-findings. Radiology. 1994;191:41–51. doi: 10.1148/radiology.191.1.8134596. [DOI] [PubMed] [Google Scholar]
- 12.Shin JH, Lee HK, Kwun BD, et al. Using relative cerebral blood flow and volume to evaluate the histopathologic grade of cerebral gliomas: preliminary results. AJR Am J Roentgenol. 2002 Sep;179(3):783–789. doi: 10.2214/ajr.179.3.1790783. [DOI] [PubMed] [Google Scholar]
- 13.van Zijl PCM, Yadav NN. Chemical exchange saturation transfer (CEST): What is in a name and what isn’t? Magn Reson Med. 2011;65:927–948. doi: 10.1002/mrm.22761. [DOI] [PMC free article] [PubMed] [Google Scholar]
- 14.Ward KM, Aletras AH, Balaban RS. A new class of contrast agents for MRI based on proton chemical exchange dependent saturation transfer (CEST) J Magn Reson. 2000;143:79–87. doi: 10.1006/jmre.1999.1956. [DOI] [PubMed] [Google Scholar]
- 15.Zhou J, Lal B, Wilson DA, Laterra J, van Zijl PCM. Amide proton transfer (APT) contrast for imaging of brain tumors. Magn Reson Med. 2003;50:1120–1126. doi: 10.1002/mrm.10651. [DOI] [PubMed] [Google Scholar]
- 16.Ling W, Regatte RR, Navon G, Jerschow A. Assessment of glycosaminoglycan concentration in vivo by chemical exchange-dependent saturation transfer (gagCEST) Proc Natl Acad Sci (USA) 2008;105:2266–2270. doi: 10.1073/pnas.0707666105. [DOI] [PMC free article] [PubMed] [Google Scholar]
- 17.Cai KJ, Haris M, Singh A, et al. Magnetic resonance imaging of glutamate. Nature Med. 2012;18(2):302–306. doi: 10.1038/nm.2615. [DOI] [PMC free article] [PubMed] [Google Scholar]
- 18.Chan KWY, McMahon MT, Kato Y, et al. Natural D-glucose as a biodegradable MRI contrast agent for detecting cancer. Magn Reson Med. 2012;68(6):1764–1773. doi: 10.1002/mrm.24520. [DOI] [PMC free article] [PubMed] [Google Scholar]
- 19.Walker-Samuel S, Ramasawmy R, Torrealdea F, et al. In vivo imaging of glucose uptake and metabolism in tumors. Nat Med. 2013 Aug;19(8):1067–1072. doi: 10.1038/nm.3252. [DOI] [PMC free article] [PubMed] [Google Scholar]
- 20.van Zijl PCM, Jones CK, Ren J, Malloy CR, Sherry AD. MRI detection of glycogen in vivo by using chemical exchange saturation transfer imaging (glycoCEST) Proc Natl Acad Sci (USA) 2007;104:4359–4364. doi: 10.1073/pnas.0700281104. [DOI] [PMC free article] [PubMed] [Google Scholar]
- 21.Haris M, Singh A, Cai K, et al. A technique for in vivo mapping of myocardial creatine kinase metabolism. Nat Med. 2014 Feb;20(2):209–214. doi: 10.1038/nm.3436. [DOI] [PMC free article] [PubMed] [Google Scholar]
- 22.Zhou J, Payen J, Wilson DA, Traystman RJ, van Zijl PCM. Using the amide proton signals of intracellular proteins and peptides to detect pH effects in MRI. Nature Med. 2003;9:1085–1090. doi: 10.1038/nm907. [DOI] [PubMed] [Google Scholar]
- 23.Zhang SR, Malloy CR, Sherry AD. MRI thermometry based on PARACEST agents. J Am Chem Soc. 2005;127:17572–17573. doi: 10.1021/ja053799t. [DOI] [PMC free article] [PubMed] [Google Scholar]
- 24.Zhou J, Tryggestad E, Wen Z, et al. Differentiation between glioma and radiation necrosis using molecular magnetic resonance imaging of endogenous proteins and peptides. Nature Med. 2011;17:130–134. doi: 10.1038/nm.2268. [DOI] [PMC free article] [PubMed] [Google Scholar]
- 25.Togao O, Yoshiura T, Keupp J, et al. Amide proton transfer imaging of adult diffuse gliomas: correlation with histopathological grades. Neuro Oncol. 2014;16:441–448. doi: 10.1093/neuonc/not158. [DOI] [PMC free article] [PubMed] [Google Scholar]
- 26.Zhou J, Zhu H, Lim M, et al. Three-dimensional amide proton transfer MR imaging of gliomas: Initial experience and comparison with gadolinium enhancement. J Magn Reson Imaging. 2013;38:1119–1128. doi: 10.1002/jmri.24067. [DOI] [PMC free article] [PubMed] [Google Scholar]
- 27.van Zijl PCM, Zhou J, Mori N, Payen J, Mori S. Mechanism of magnetization transfer during on-resonance water saturation. A new approach to detect mobile proteins, peptides, and lipids. Magn Reson Med. 2003;49:440–449. doi: 10.1002/mrm.10398. [DOI] [PubMed] [Google Scholar]
- 28.Jones CK, Polders D, Hua J, et al. In vivo 3D whole-brain pulsed steady state chemical exchange saturation transfer at 7T. Magn Reson Med. 2012;67:1579–1589. doi: 10.1002/mrm.23141. [DOI] [PMC free article] [PubMed] [Google Scholar]
- 29.Jin T, Wang P, Zong X, Kim SG. MR imaging of the amide-proton transfer effect and the pH-insensitive nuclear overhauser effect at 9.4 T. Magn Reson Med. 2013 Mar 1;69(3):760–770. doi: 10.1002/mrm.24315. [DOI] [PMC free article] [PubMed] [Google Scholar]
- 30.Jones CK, Huang A, Xu J, et al. Nuclear Overhauser enhancement (NOE) imaging in the human brain at 7T. Neuroimage. 2013;77:114–124. doi: 10.1016/j.neuroimage.2013.03.047. [DOI] [PMC free article] [PubMed] [Google Scholar]
- 31.Mori S, Eleff SM, Pilatus U, Mori N, van Zijl PCM. Proton NMR spectroscopy of solvent-saturable resonance: a new approach to study pH effects in situ. Magn Reson Med. 1998;40:36–42. doi: 10.1002/mrm.1910400105. [DOI] [PubMed] [Google Scholar]
- 32.Henkelman RM, Huang X, Xiang Q-S, Stanisz GJ, Swanson SD, Bronskill MJ. Quantitative interpretation of magnetization transfer. Magn Reson Med. 1993;1993:759–766. doi: 10.1002/mrm.1910290607. [DOI] [PubMed] [Google Scholar]
- 33.Morrison C, Henkelman RM. A model for magnetization transfer in tissues. Magn Reson Med. 1995 Apr;33(4):475–482. doi: 10.1002/mrm.1910330404. [DOI] [PubMed] [Google Scholar]
- 34.Hua J, Jones CK, Blakeley J, Smith SA, van Zijl PCM, Zhou J. Quantitative description of the asymmetry in magnetization transfer effects around the water resonance in the human brain. Magn Reson Med. 2007;58:786–793. doi: 10.1002/mrm.21387. [DOI] [PMC free article] [PubMed] [Google Scholar]
- 35.Heo HY, Zhang Y, Jiang S, Lee DH, Zhou J. Quantitative assessment of amide proton transfer (APT) and nuclear overhauser enhancement (NOE) imaging with extrapolated semisolid magnetization transfer reference (EMR) signals: II. Comparison of three EMR models and application to human brain glioma at 3 Tesla. Magn Reson Med. 2015 doi: 10.1002/mrm.25795. [DOI] [PMC free article] [PubMed] [Google Scholar]
- 36.Heo H-Y, Zhang Y, Lee D-H, Hong X, Zhou J. Quantitative assessment of amide proton transfer (APT) and nuclear Overhauser enhancement (NOE) imaging with extrapolated semi-solid magnetization transfer reference (EMR) signals: Application to a rat glioma model at 4.7 T. Magn Reson Med. 2015 doi: 10.1002/mrm.25581. [DOI] [PMC free article] [PubMed] [Google Scholar]
- 37.Cox RW. AFNI: software for analysis and visualization of functional magnetic resonance neuroimages. Comput Biomed Res. 1996 Jun;29(3):162–173. doi: 10.1006/cbmr.1996.0014. [DOI] [PubMed] [Google Scholar]
- 38.Dowling C, Bollen AW, Noworolski SM, et al. Preoperative proton MR spectroscopic imaging of brain tumors: correlation with histopathologic analysis of resection specimens. AJNR Am J Neuroradiol. 2001 Apr;22(4):604–612. [PMC free article] [PubMed] [Google Scholar]
- 39.Pirzkall A, McGue C, Saraswathy S, et al. Tumor regrowth between surgery and initiation of adjuvant therapy in patients with newly diagnosed glioblastoma. Neuro Oncol. 2009 Dec;11(6):842–852. doi: 10.1215/15228517-2009-005. [DOI] [PMC free article] [PubMed] [Google Scholar]
- 40.Paech D, Zaiss M, Meissner JE, et al. Nuclear overhauser enhancement mediated chemical exchange saturation transfer imaging at 7 Tesla in glioblastoma patients. PLoS One. 2014;9(8):e104181. doi: 10.1371/journal.pone.0104181. [DOI] [PMC free article] [PubMed] [Google Scholar]


