Abstract
Aims
Endothelin-1 (ET-1) is a potent vasoconstrictor which regulates the physiology of cardiorenal system. The aim of this study was to evaluate ET-1-mediated elevation of intracellular Ca2+ in smooth muscle cells (SMC) of renal resistance arteries.
Main methods
In in vitro studies of primary SMC, which were isolated from rat renal microvessels, the levels of intracellular Ca2+ were calculated from the ratio of emissions at 340 and 380 nm after loading cells with Fura 2-AM dye. In ex vivo studies we used two-photon imaging of intracellular Ca2+ handling in renal resistance arteries excised from rat kidneys and loaded with fluorescent Ca2+ indicator Fluo-4 AM.
Key findings
The two-photon imaging demonstrates that treatment of isolated rat renal resistance arteries with ET-1 causes a rapid increase of intracellular Ca2+ concentration in smooth muscle vasculature of these vessels. These ex vivo observations are in accordance with in vitro findings indicating that ET-1 mediates activation of TRPC channels and increases the level of intracellular Ca2+ in cultured SMC to 510±83 nM.
Significance
ET-1-mediated elevation of intracellular Ca2+ is strongly linked to renal microvascular contraction and is crucial for ET-1-induced contraction of SMC. The two-photon imaging of intracellular Ca2+ in intact SMC of rat renal resistance arteries is a powerful technique which allows the detailed ex vivo analysis of intracellular Ca2+ handling by ET-1, an important player in hypertension-related kidney diseases.
Keywords: contraction, microvasculature, Fluo-4 AM, renal resistance arteries
Introduction
Potent vasoconstrictor endothelin-1 (ET-1) is an important regulator of renal microcirculation which affects renal function through actions at multiple cell types in kidney, including vascular smooth muscle cells (SMC) (1;2). Stimulation of SMC with ET-1 evokes a wide variety of signaling events, including mobilization of intracellular Ca2+ ([Ca2+]i), which plays a principal role in cellular contractility (3;4). Even though primary SMC cultures are an exceptional resource for dissecting the activation mechanisms of SMC signaling, there is an unavoidable risk that the transfer to the status of cultured cells is accompanied by changes in the repertoire of expressed signaling proteins, including calcium channels and their regulatory proteins. To avoid this limitation, we have modified two-photon imaging technique previously used by us for analysis of Ca2+ handling in endothelial cells of an isolated rat aorta (5;6) to monitor the [Ca2+]i changes in individual SMC in the native setting of the freshly isolated rat renal resistance arteries. Since autoregulation of renal vasculature is one of the most important mechanisms of maintaining the blood pressure at a sustainable level, the ability to focus at small renal resistance arteries, such as afferent arterioles, is imperative for uncovering signaling mechanisms regulating the responsiveness of renal vasculature.
The aim of this study was to evaluate the feasibility of monitoring ET-1-mediated elevation of [Ca2+]i in SMC of rat renal resistance arteries using two-photon imaging. Two-photon microscopy of isolated renal vessels is a very powerful and the least invasive method for the analysis of [Ca2+]i handling ex vivo. For instance, recent studies utilized two-photon microscopy for the visualization of the binding of ET receptor agonists in isolated rat mesenteric resistance arteries (7). Using ET-1 and L.-ET-1 (linear ET-1) fluorescently labeled with an efficient donor–acceptor pair (OG488 and TAMRA, respectively) it was possible to visualize and analyze localization and fluorescent properties of the ETA and ETB receptor binding sites (7). However, two-photon microscopy has never been used previously to monitor ET-1 action on changes in [Ca2+]i in renal resistance arteries.
Materials and Methods
Calcium imaging and electrophysiological analysis in cultured cells
The fluorescent Ca2+ indicator Fura 2-AM was used to measure the [Ca2+]i concentration changes during 100 nM ET-1 applications. SMC isolated from renal interlobar arteries of Dahl salt-sensitive (SS) rats were loaded with physiological saline solution (PSS) (in mM: 140 NaCl, 2 CaCl2, 1.2 MgCl2, 4.5 KCl, 6 D-glucose, 10 HEPES; pH 7.4) containing 2 µM Fura 2-AM (Life Technologies) and 0.05 % pluronic acid (F-127; Sigma-Aldrich) and stored for 40 min in the dark on a slow moving shaker at room temperature. After incubation cells were washed with PSS for 15 min to remove excess dye. All fluorescent imaging experiments using cultured SMC were performed in PSS solution. Fluorescence images of changes in the [Ca2+]i level probed with Fura 2-AM were obtained using a Nikon TE-2000U inverted microscope equipped with a 40/1.3 DIC oil immersion objective lens (Nikon S Fluor) and a Zyla sCMOS camera (Andor Technologies). Excitation was provided by a Lambda XL xenon arc lamp at alternating wave lengths, and emission control was achieved using an optical filter changer with integrated shutter/filter wheel driver (Sutter Instrument, Novato, CA). Cells were alternately excited at 340 nm and 380 nm, and the respective 510 nm emissions was acquired every 8 s. Changes in [Ca2+]i were based on 340/380 ratios. To quantify [Ca2+]i concentration, fluorescence intensity was recorded in the baseline and after addition of ionomycin and MnCl2. Fluorescence signal changes in response to ionomycin (producing the maximum of the Fura 2-AM ratio) and MnCl2, which quenches the dye and results in the lowest Fura 2-AM ratio. Intensity of fluorescence was translated into the actual calcium concentrations as previously described (8). For electrophysiological analysis, standard patch clamp approach in the cell attached configuration was used as previously described (9). Nicardipine (5 mM), niflumic acid (100 µM) and DIDS (100 µM) were added to the pipette solution directly before experiments to block N-type Ca2+ and Ca2+-activated Cl− channels (10).
Two-photon imaging of intracellular Ca2+ handling in renal resistance arteries
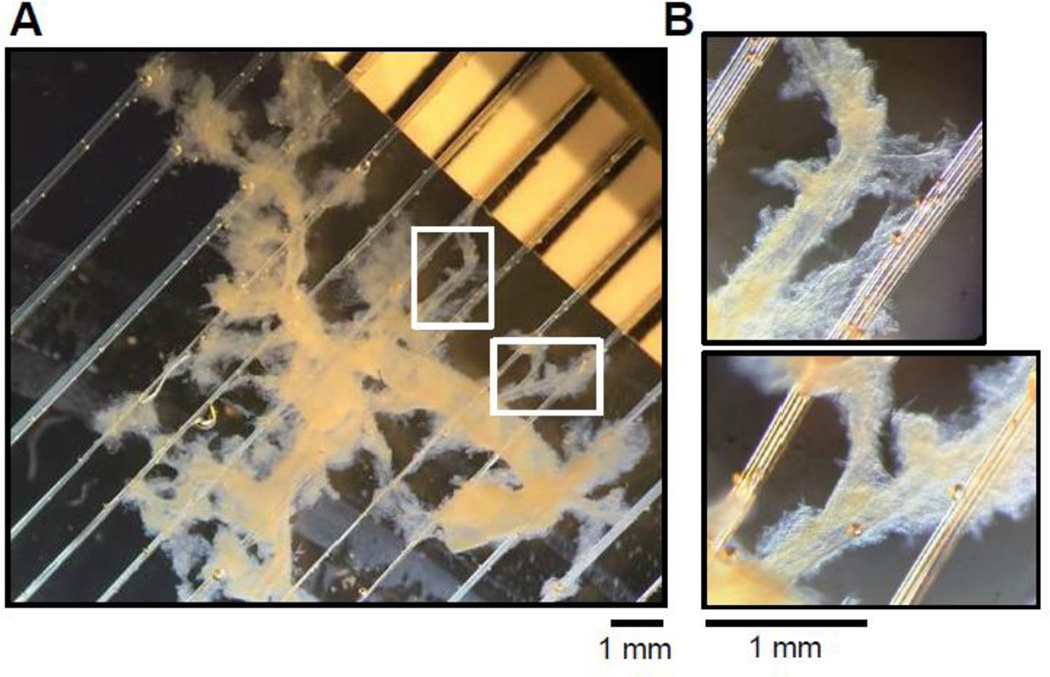
For isolation of renal resistance arteries, the kidneys were collected from male Dahl SS rats maintained on 1% salt Purina 5001 diet for 12 weeks. Animal use and welfare adhered to the NIH Guide for the Care and Use of Laboratory Animals following a protocol reviewed and approved by the IACUC of the Medical College of Wisconsin. Interlobar arteries of approximate 150–200 µm diameter were manually dissected in an ice-cold low calcium PSS (PSS-LC; in mM: 140 NaCl, 0.1 CaCl2, 1.2 MgCl2, 4.5 KCl, 6 D-glucose, 10 HEPES; pH 7.4). The tunica externa was then carefully stripped from the vessels in order to reduce non-specific fluorescence. As seen in Fig. 3, the combination of dissecting and sieving steps allowed us to isolate the intact renal vascular tree for further analysis. The vascular tree was isolated by sectioning the kidney longitudinally and removing the medulla. The tissue was then gently pressed through a 150 µm stainless steel mesh sieve with a spatula to carefully retain the vascular tree. The tissue was washed with PSS-LC to remove excess kidney tissue, and connective tissue was partially removed by manual dissection. The fluorescent Ca2+ indicator Fluo-4 AM (Life Technologies) was used to measure the [Ca2+]i changes after 100 nM ET-1 applications. Dissected renal microvessels were loaded with PSS-LC, supplemented with 5 µM Fluo-4 AM and 0.05 % pluronic acid, and stored for 1 hr on a rotating shaker at room temperature in the dark. After incubation, vessels were washed 2–3 times with PSS to remove extracellular dye and all further procedures were done in PSS. Renal vessels were transferred to a silicon-coated plate and fixed by anchor slice grid (Warner Instruments, Hamden, CT) for further application of ET-1. The plate was then transferred to the upright Olympus Fluoview FV1000 microscope equipped with Ti:sapphire lasers tuned to 820 nm and imaged with a 25× (N.A. 1.05 and working distance 2 mm) water-immersion objective lens (XLPL25XWMP; Olympus). Once the cells were in focus, sequential collection of images in a fast scan mode was started (raster scan, 512×512 pixel window with a frame collection frequency of 1.1 s). In parallel with Fluo-4 AM fluorescence, transmitted light images were collected in order to detect changes in vessel contraction and better visualize the experimental conditions. Fluorescent layer of SMC was identified using two-photon microscopy. After collection of baseline signal images, ET-1 was carefully applied while imaging. The increase of the fluorescent signal was observed within the loaded cells and measured as arbitrary units of fluorescence intensity (a.u.). In contrast to measurements in cultured cells, it is not possible to calculate the exact [Ca2+]i in intact vessels, because the calibration can’t be accurately done when cells are in the native setting of renal microvessels. The narrow focus of two-photon excitation significantly reduces auto fluorescence from collagen tissue but allows focusing only on small part of vessel. Due to round shape of vessel the longitudinal SMC could be located at upper or lower focus planes, which allowed monitoring of Ca2+ transient only in visible part of the SMC. Application of ET-1 produces rapid Ca2+ transient in SMC, detected by increase in fluorescence on non-ratiometric calcium indicator Fluo-4 AM. ROI (region of interest) for each cell (or cell fragment) was chosen using Image J software and changes in fluorescence were analyzed as was described previously (5).
Fig. 3. The isolation of intact vascular tree from renal tissues.
(A) The renal arteries isolated from renal cortex of a Dahl SS rat. (B) The magnified regions of the vessel tree shown in A illustrate the presence of small renal arteries responsible for renal blood flow regulation.
Results
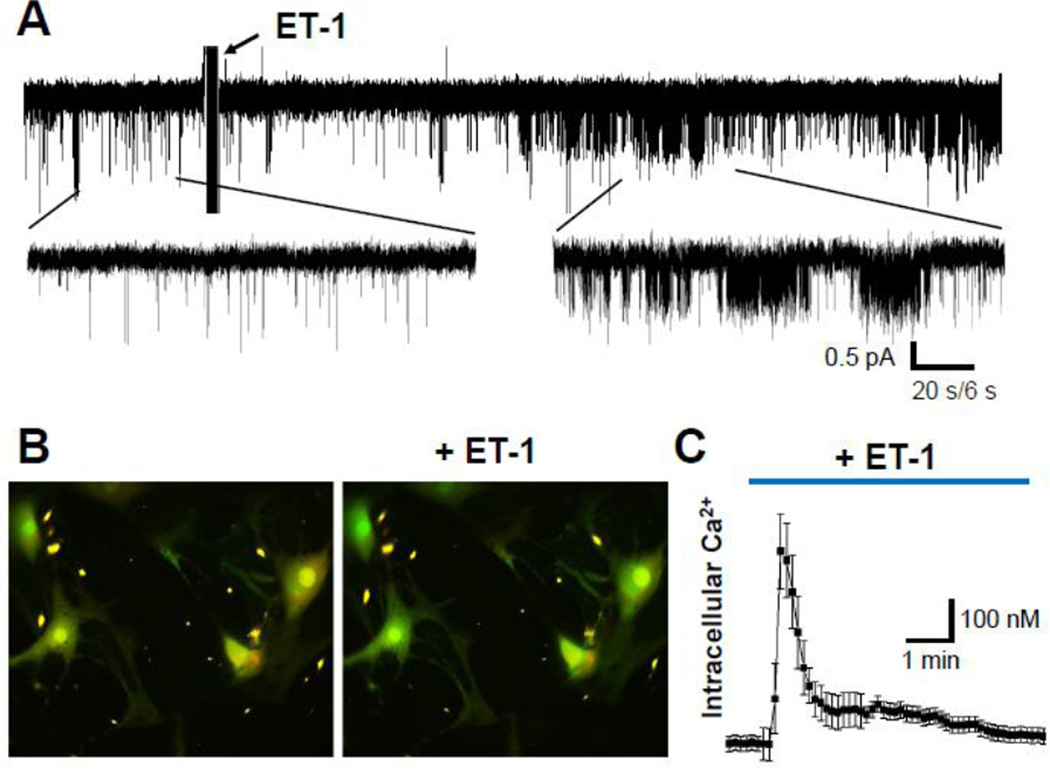
In primary SMC, isolated from rat renal microvessels, exposure to ET-1 (100 nM) caused rapid activation of TRPC channels (Fig. 1A) followed by dramatic intracellular [Ca2+] changes (Fig. 1B,C). The quantification of the SMC data revealed that ET-1 increases the basal calcium from 77±17 nM to 510±83 nM with a peak reached within 30 sec after ET-1 addition.
Fig. 1. Effect of ET-1 on calcium influx in cultured SMC.
(A) Representative electrophysiological recording showing the activity of single calcium channels obtained in cultured primary renal SMCs before and after ET-1 treatment (100 nM). Current trace was recorded at −80 mV holding potential. Insets show current traces with expanded scales. (B) Primary renal SMCs loaded with fluorescent Ca2+ indicator Fura 2-AM before and after ET-1 treatment. (C) ET-1 produced dynamic changes in cytosolic Ca2+ concentration in SMC. Presented are average time courses of [Ca2+]i changes in individual SMC following exposure to ET-1 (100 nM).
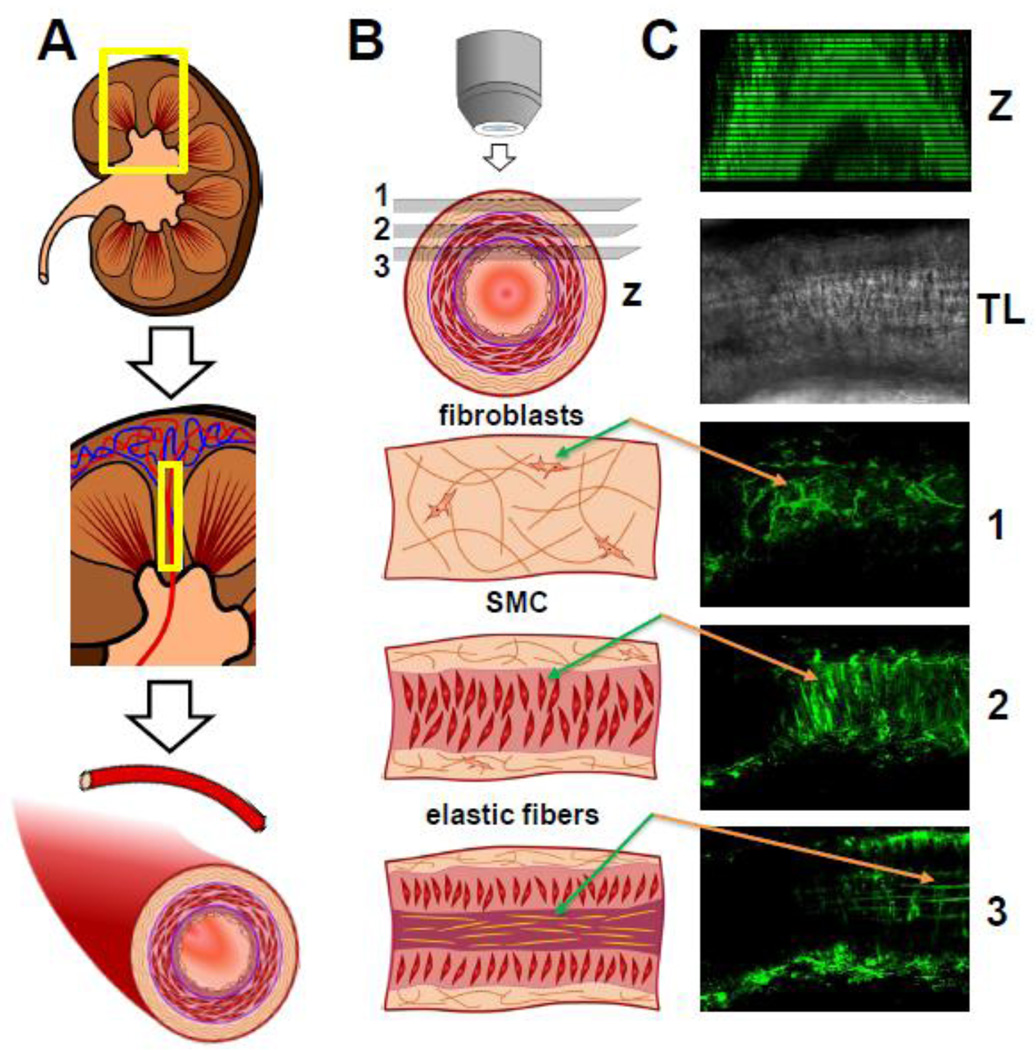
The basic strategy for isolation and imaging of rat renal resistance arteries is depicted in Fig. 2. It is of note, that two-photon imaging technique allows the efficient separation of fluorescent signal coming from other distinct layers of renal microvessels. As seen in Fig. 2C, the interference caused by fibroblast and collagen layer could be an extremely difficult problem to deal with, if it is not negated by the key features of the two-photon imaging: low background fluorescence and ability of fine focusing upon the SMC layer within the microvessel.
Fig. 2. The basic strategy for isolation and imaging of the renal vessels.
(A) Dissecting of renal resistance arteries. (B) Imaging renal vessels with two photon microscopy allows detecting three distinct tissue layers at different depths within the vessel wall: 1, fibroblasts rich in collagen; 2, smooth muscle cells (SMC) and 3, endothelial cells/elastic fibers. (C) Example of renal vessel imaging loaded with Fluo-4 AM Ca2+ indicator: Z-stack of the vessel, TL – vessel in transmitted light, 1, 2, and 3 corresponding layers are described in B.
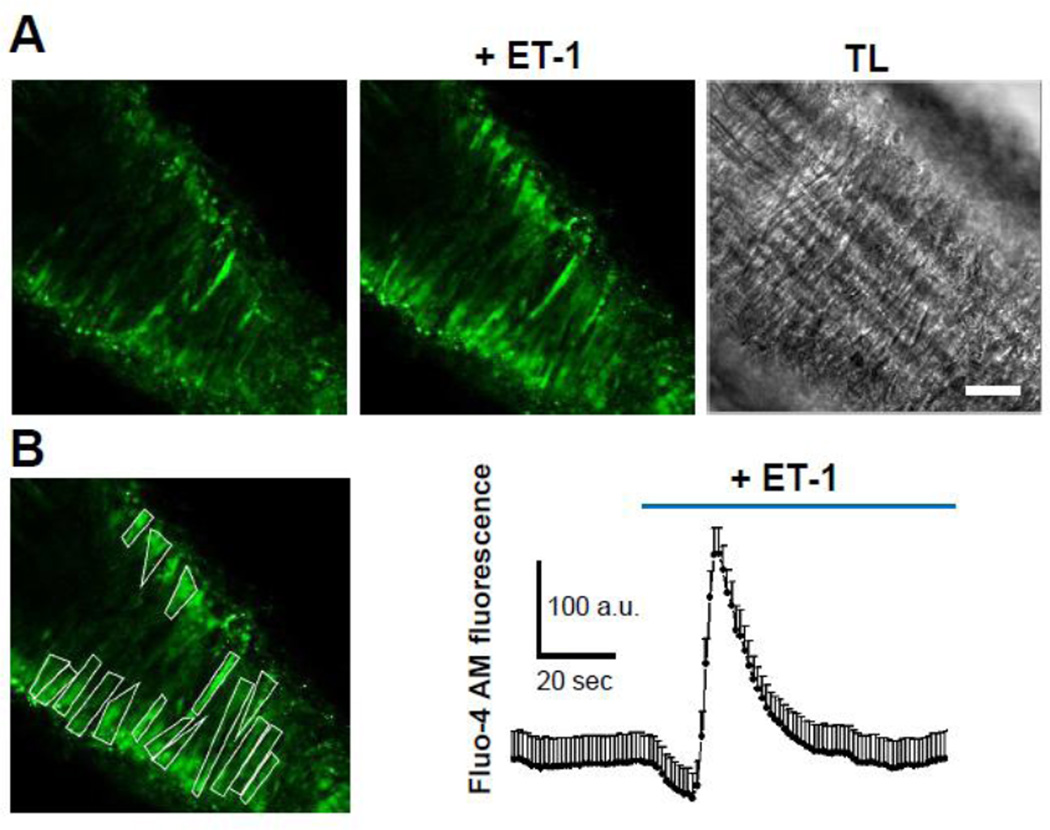
Isolation of intact vascular tree (Fig. 3) enabled us to evaluate ET-1 mediated [Ca2+]i changes in individual SMC ex vivo. Addition of ET-1 to isolated renal resistance arteries caused an influx of Ca2+ in individual SMC in the native setting of renal microvessel (Fig. 4). As shown in Fig. 4B, two-photon imaging allows quantification of [Ca2+]i changes in individual SMC of renal vasculature. ET-1 induces rapid initial increase in [Ca2+]i, most likely due to mobilization of Ca2+ from intracellular sources, followed by a prolonged extracellular influx of Ca2+, which is presumably mediated via TRPC channels activity. The quantitative analysis of 39 individual SMC, embedded in 6 vessels which were excised from 4 rats, allowed us to measure the ET-1-triggered increase of [Ca2+]i from baseline (zero) to a peak of 577±197 a.u. which is directly related to increase of [Ca2+]i. Figure 4 demonstrates the representative trace obtained from one vessel.
Fig. 4. ET-1-mediated calcium signaling in SMC of freshly isolated small resistance arteries measured with two-photon microscopy.
(A) Representative images of ET-1-mediated [Ca2+]i response in SMC of microvessels isolated from a Dahl SS rat kidney. Corresponding transmitted light (TL) image is shown on the right. Scale bar is 25 µm. (B) Quantification of [Ca2+]i release in response to ET-1 (100 nM). In the shown vessel [Ca2+]i increased to a peak concentration of 229±27 a.u. The quantification is done as described in Materials and Methods.
Discussion
Native vascular SMC contain diverse TRPC-mediated channels, which upon stimulation allow influx of Ca2+ ions contributing to SMC contractility (11). Many of the effects of ET-1 are due to an increase in [Ca2+]i concentration (12). ET-1 is inducing rapid changes in [Ca2+]i in a variety of cultured renal cells including glomerular mesangial cells, SMC and others (4;13;14). These and other studies provided crucial information about the ET-1-mediated Ca2+ handling in cultured cells of different origin. However, the responsiveness of individual cells to ET-1 in their native settings has not been sufficiently studied. We demonstrate here the dynamics of ET-1-triggered changes in [Ca2+]i in individual SMC of small renal resistance arteries isolated from rat renal tissues. The handling of [Ca2+]i by ET-1 in rat arteries is in a good accordance with results obtained using primary SMC isolated from renal tissues, indicating that two-photon imaging of individual SMC from renal vasculature is a feasible approach. Some slight difference in kinetic response to [Ca2+]i between cultured SMC and SMC in their native setting of microvessels is due the usage of different dyes (ratiometric and non-ratiometric) with dissimilar dissociation constants in different types of optical configurations (epifluorescence versus two-photon fluorescence). Two-photon imaging of individual SMC from renal vasculature could be now applied to renal vasculature from rats at different stages of renal pathologies to compare the ET-1 mediated Ca2+ signaling, the task which is beyond the possibilities of cell culture studies.
In this study we have used ET-1 in concentration of 100 nM, which could be considered relatively high. It must be taken into consideration that plasma levels of ET-1 might not accurately reflect local tissue-specific concentrations and those could be significantly higher. In experimental setup of isolated renal vessels we do not have the ability to control the concentration of ET-1 to which SMCs are exposed. The concentration is likely to be much lower than 100 nM and close to physiological concentration. Furthermore, 100 nM ET-1 was used by us previously in multiple studies in cultured cells (15–17). This ET-1 concentration generates a reproducible and potent cellular response.
The effectiveness of isolation of intact renal vascular trees will enable future studies to focus on ET-1 mediated Ca2+ handling in individual types of renal rat resistance arteries: interlobular arteries, afferent arterioles and others. The vascular wall of afferent arterioles contains only one layer of SMC, while these arterioles are exposed to high pressure and maintain a high vascular tone. Analysis of their responses to ET-1 and other bioactive factors using two-photon imaging would provide crucial missing details of signaling pathways responsible for the ability of afferent arterioles to provide a large pressure gradient in a short distance.
Conclusion
Two-photon microscopy allows monitoring intracellular Ca2+ mobilization in the native setting of renal microvessels. ET-1 induces rapid changes in [Ca2+]i in individual SMC cells of small renal resistance arteries. Two-photon imaging is a method of choice to study regulators of vascular tone ex vivo.
Acknowledgements
Supported by NIH grants DK088018 and DK098159 (to A. S.), HL108880 (to A. St.), American Diabetes Association grant 1-15-BS-172 (to A. St.), and the Young Investigator Grant of the National Kidney Foundation (to O. P.).
Footnotes
Publisher's Disclaimer: This is a PDF file of an unedited manuscript that has been accepted for publication. As a service to our customers we are providing this early version of the manuscript. The manuscript will undergo copyediting, typesetting, and review of the resulting proof before it is published in its final citable form. Please note that during the production process errors may be discovered which could affect the content, and all legal disclaimers that apply to the journal pertain.
Conflict of Interest statement
The authors declare that there are no conflicts of interest.
Reference List
- 1.Kohan DE, Rossi NF, Inscho EW, Pollock DM. Regulation of blood pressure and salt homeostasis by endothelin. Physiol Rev. 2011;91:1–77. doi: 10.1152/physrev.00060.2009. [DOI] [PMC free article] [PubMed] [Google Scholar]
- 2.Speed JS, Heimlich JB, Hyndman KA, Fox BM, Patel V, Yanagisawa M, Pollock JS, Titze JM, Pollock DM. Endothelin-1 as a master regulator of whole-body Na+ homeostasis. FASEB J. 2015 doi: 10.1096/fj.15-276584. [DOI] [PMC free article] [PubMed] [Google Scholar]
- 3.Pollock DM, Keith TL, Highsmith RF. Endothelin receptors and calcium signaling. FASEB J. 1995;9:1196–1204. doi: 10.1096/fasebj.9.12.7672512. [DOI] [PubMed] [Google Scholar]
- 4.Bouallegue A, Daou GB, Srivastava AK. Endothelin-1-induced signaling pathways in vascular smooth muscle cells. Curr. Vasc. Pharmacol. 2007;5:45–52. doi: 10.2174/157016107779317161. [DOI] [PubMed] [Google Scholar]
- 5.Endres BT, Staruschenko A, Schulte M, Geurts AM, Palygin O. Two-photon Imaging of Intracellular Ca2+ Handling and Nitric Oxide Production in Endothelial and Smooth Muscle Cells of an Isolated Rat Aorta. J. Vis. Exp. 2015:e52734. doi: 10.3791/52734. [DOI] [PMC free article] [PubMed] [Google Scholar]
- 6.Endres BT, Priestley JR, Palygin O, Flister MJ, Hoffman MJ, Weinberg BD, Grzybowski M, Lombard JH, Staruschenko A, Moreno C, et al. Mutation of Plekha7 attenuates salt-sensitive hypertension in the rat. Proc. Natl. Acad. Sci. U.S.A. 2014;111:12817–12822. doi: 10.1073/pnas.1410745111. [DOI] [PMC free article] [PubMed] [Google Scholar]
- 7.Kapsokalyvas D, Schiffers PM, Maij N, Suylen DP, Hackeng TM, van Zandvoort MA, De Mey JG. Imaging evidence for endothelin ETA/ETB receptor heterodimers in isolated rat mesenteric resistance arteries. Life Sci. 2014;111:36–41. doi: 10.1016/j.lfs.2014.07.007. [DOI] [PubMed] [Google Scholar]
- 8.Grynkiewicz G, Poenie M, Tsien RY. A new generation of Ca2+ indicators with greatly improved fluorescence properties. J. Biol. Chem. 1985;260:3440–3450. [PubMed] [Google Scholar]
- 9.Ilatovskaya DV, Palygin O, Chubinskiy-Nadezhdin V, Negulyaev YA, Ma R, Birnbaumer L, Staruschenko A. Angiotensin II has acute effects on TRPC6 channels in podocytes of freshly isolated glomeruli. Kidney Int. 2014;86:506–514. doi: 10.1038/ki.2014.71. [DOI] [PMC free article] [PubMed] [Google Scholar]
- 10.Ilatovskaya DV, Staruschenko A. Single-channel analysis of TRPC channels in the podocytes of freshly isolated Glomeruli. Methods Mol. Biol. 2013;998:355–369. doi: 10.1007/978-1-62703-351-0_28. [DOI] [PMC free article] [PubMed] [Google Scholar]
- 11.Albert AP, Saleh SN, Large WA. Identification of canonical transient receptor potential (TRPC) channel proteins in native vascular smooth muscle cells. Curr. Med. Chem. 2009;16:1158–1165. doi: 10.2174/092986709787581815. [DOI] [PubMed] [Google Scholar]
- 12.Tykocki NR, Watts SW. The interdependence of endothelin-1 and calcium: a review. Clin. Sci. (Lond) 2010;119:361–372. doi: 10.1042/CS20100145. [DOI] [PMC free article] [PubMed] [Google Scholar]
- 13.Malik R, Vlasicova K, Sedo A. Functional cross-talk of Ca2+-mobilizing endothelin receptors in C6 glioma cells. Physiol Res. 2002;51:73–78. [PubMed] [Google Scholar]
- 14.Sorokin A. Endothelin signaling and actions in the renal mesangium. Contrib. Nephrol. 2011;172:50–62. doi: 10.1159/000328680. [DOI] [PubMed] [Google Scholar]
- 15.Chahdi A, Sorokin A. Endothelin-1 Couples {beta}Pix to p66Shc: Role of {beta}Pix in Cell Proliferation Through FOXO3a Phosphorylation and p27kip1 Down-regulation Independently of Akt. Mol. Biol. Cell. 2008;19:2609–2619. doi: 10.1091/mbc.E07-05-0424. [DOI] [PMC free article] [PubMed] [Google Scholar]
- 16.Rufanova VA, Alexanian A, Wakatsuki T, Lerner A, Sorokin A. Pyk2 mediates endothelin-1 signaling via p130Cas/BCAR3 cascade and regulates human glomerular mesangial cell adhesion and spreading. J. Cell Physiol. 2009;219:45–56. doi: 10.1002/jcp.21649. [DOI] [PMC free article] [PubMed] [Google Scholar]
- 17.Schramek H, Sorokin A, Watson RD, Dunn MJ. Differential long-term regulation of MEK and of p42 MAPK in rat glomerular mesangial cells. Am. J. Physiol. 1996;270:C40–C48. doi: 10.1152/ajpcell.1996.270.1.C40. [DOI] [PubMed] [Google Scholar]


