Abstract
Genome-wide epigenetic reprogramming is required for successful preimplantation development. Inappropriate or deficient chromatin regulation can result in defective lineage specification and loss of genomic imprinting, compromising normal development. Here we report that two members of the RNA polymerase II associated factor, homolog (Saccharomyces cerevisiae) complex (PAF1 complex) components, Ctr9 and Rtf1, are required during mammalian preimplantation development. We demonstrate that Ctr9-deficient embryos fail to correctly specify lineages at the blastocyst stage. Expression of some lineage specific factors is markedly reduced in Ctr9 knockdown embryos, including Eomes, Elf5 and Sox2, while others are inappropriately expressed (Oct4, Nanog, Gata6, Fgf4 and Sox17). We also show that several imprinted genes (Mest, Peg3, Snrpn and Meg3) are aberrantly expressed although allele specific DNA methylation is not altered. We document a loss of histone H3 lysine 36 trimethylation (H3K36me3) in Ctr9-deficient embryos and confirm that knockdown of either Setd2 or Rtf1 results in similar phenotypes. These findings show that the PAF1 complex is required for mammalian development, likely through regulation of H3K36me3, and indicate functional conservation of the PAF1 complex from yeast to mammals in vivo.
Keywords: Ctr9, PAF1c, Blastocyst, H3K36me3, Setd2, Rtf1, Imprinting, Preimplantation
Introduction
Fusion of the highly differentiated mammalian oocyte and sperm results in the formation of a totipotent zygote that initiates embryogenesis. During preimplantation development, critical genome-wide epigenetic reprograming occurs to ensure successful embryonic development, including maintenance of genomic imprinting and establishment of pluripotency (reviewed in (Hemberger et al., 2009; Surani et al., 2007)).
Through a phenotype-driven RNAi screen, we identified mouse Ctr9, PAF1/RNA polymerase II complex component, homolog (S. cerevisiae) (Ctr9) as being required for developmental and epigenetic events during preimplantation development. CTR9 is a component of the PAF1 complex (PAF1c), which consists of the 5 core proteins PAF1, RTF1, CTR9, CDC73 and LEO1. The PAF1c was first identified in yeast where it has been shown to prevent transcriptional activation and regulate cell cycle (Koch et al., 1999). The yeast complex is also required for COMPASS-mediated H3K4 methylation and Dot1-mediated H3K79 methylation (Krogan et al., 2003a) as well as appropriate polyadenylation of some transcripts (Penheiter et al., 2005). Additionally, maintenance of histone H3K4me3 and H3K36me3 have been shown to require functional PAF1c in both yeast and human cells (reviewed in (Jaehning, 2010)). Adding to the challenges in understanding the biological role of PAF1c, the complex can also recruit CHD1, an ATP-dependent chromatin-remodeling enzyme.
Deletion of Paf1 and Ctr9 in yeast leads to aberrant cell growth and cell cycle control (Koch et al., 1999). PAF1c associates with RNA pol II at coding regions during transcription elongation and has been shown to promote phosphorylation of the RNA pol II C-terminal domain (Nordick et al., 2008). Furthermore, the PAF1c is crucial for appropriate transcription termination and 3′ mRNA end formation (Nordick et al., 2008). Currently, the mechanistic role of PAF1c during mammalian development in vivo remains largely unexplored.
Recently, both Ctr9 and Rtf9 were identified in an RNAi screen in embryonic stem cells (ESCs) as regulators of pluripotency (Ding et al., 2009). Ding et al. showed in ESCs that PAF1c components bind to the promoters of Oct4, Nanog and Sox2, which are essential to maintain ES identity, and that knockdown (KD) of Ctr9 or Rtf1 resulted in premature differentiation – specifically to endoderm in vitro. One member of PAF1c, Cdc73 (also called Parafibromin and Hrpt2), has been knocked out in the mouse and results in peri-implantation lethality as well as lethality when conditionally deleted in adult animals (Wang et al., 2008). Additionally, components of PAF1c have been shown to be required for heart and neural crest development in zebrafish (Langenbacher et al., 2011), developmental Hedgehog, Notch and Wnt signaling in flies (Bray et al., 2005; Mosimann et al., 2009; Tenney et al., 2006), as well as immune response and cancer progression in human cell lines (reviewed in (Tomson and Arndt, 2013)).
Here, we show that Ctr9 and Rtf1 are present in morula and blastocyst stage embryos and are necessary for normal preimplantation lineage identity and function. Ctr9-deficient embryos fail to form trophoblast outgrowths, and the differentiation potential of the ICM is suppressed. Some key lineage specific factors are reduced in the absence of Ctr9, including Eomes, Elf5 and Sox2, while others are inappropriately expressed (Oct4, Nanog, Gata6, Fgf4 and Sox17). Importantly, H3K36me3 was reduced in Ctr9-deficient embryos, indicating functional conservation of PAF1c from yeast to mammals in vivo.
Materials and methods
Production and culture of embryos
Superovulation of B6D2 F1 female mice (8 to10 weeks old) was performed using 10 IU PMSG (Sigma) followed by 10 IU hCG (Sigma) 46–48 h later. At 20–22 h post-hCG treatment, zygotes were collected from B6D2 F1 female mice mated to B6D2 F1 males. For allele specific analysis, widely derived mouse strains were used to distinguish parental alleles by transcribed SNPs – B6D2F1 dams were mated to PWD (mus. Molossinus) stud males. Hyaluronidase (ICN Pharmaceuticals, Costa Mesa, CA, USA) was used to remove cumulus cells. Zygotes were cultured in KSOM at 37 °C/5% CO2/5% O2 balanced in N2 in a mixed gas incubator. Use of vertebrate animals for embryo production was in accordance with the University of Massachusetts IACUC.
Outgrowth assay
After removal of zona pellucida, blastocysts were cultured individually in 10% DMEM in wells coated with 0.1% gelatin (Sigma). For ICM isolation, blastocysts were treated with anti-mouse antiserum, washed and exposed to guinea pig complement sequentially as described by (Solter and Knowles, 1975). The isolated ICMs were cultured individually in wells plated with 0.1% fibronectin. Outgrowths (intact blastocysts or isolated ICMs) were cultered at 37 °C/5% CO2 in air and were observed for three days.
Double-stranded RNA (dsRNA) preparation
DNA templates for T7-RNA polymerase mediated dsRNA production were amplified from genomic DNA or preimplantation embryo cDNA using primers that contained the T7 binding sequences followed by gene specific sequences as follows: dsGfp Forward: TAATACGACTCACTATAGGGCACATGAAGCAGCACGACTT and Reverse: TAATACGACTCACTATAGGGTGCTCAGGTAGTGGTTGTCG,dsCtr9-1 Forward: TAATACGACTCACTATAGGGCCATTTGGCAAACCACTTTT and Reverse:TAATACGACTCACTATAGGGAAGGGCACCCTGTATGTCAG,dsC tr9-2Forward:TAATACGACTCACTATAGGGCCATGGCCAGAGATAAAGG AandReverse:TAATACGACTCACTATAGGGCGAAAACATCACGAGCTTCA,dsRtf1Forward:TAATACGACTCACTATAGGGCATGAAGAAGCAAGCCAACA and Reverse: TAATACGACTCACTATAGGGAACGCCGTTCTTTATTGTGG,dsSetd2Forward:TAATACGACTCACTATAGGGGATGGCTTGCACTCATCAGA and Reverse: TAATACGACTCACTATAGGGTCTCCAACTCTTGCCTTCGT. dsRNA apmicons were BLASTed against the mouse genome to ensure the target sequence had less than 19-mer homology with any non-target transcripts. PCR products were purified by gel extraction (Qiagen spin column-Qiagen ♯ 28106). In vitro transcription was performed using T7 MEGAscript Kit (Ambion product ♯ AM1334) and 0.5 μl of TURBO RNase-free DNase was added to each 10 μl reaction to remove the DNA template. dsRNA was treated with NucAway Spin Columns (Ambion product ♯ AM10070) to recover the dsRNA while removing salts and unincorporated nucleotides. The dsRNA was then extracted with phenol: chloroform and precipitated with 70% ethanol and resuspended in RNase free water. The quality of dsRNA was confirmed by electrophoresis (after in vitro transcription as well as after precipitation). The concentration of dsRNA was measured by Nanodrop and diluted to 1 μg/μl and stored at −80 °C.
Microinjection
dsRNA was microinjected into the cytoplasm of zygote using a Piezo-drill (Prime Tech, Japan) and Eppendorf transferman micro-manipulators. 1 μg/μl dsRNA were loaded into microinjection pipette and constant flow was adjusted to allow successful microinjection. Approximately, 5–10 pl dsRNA was injected into the cytoplasm of each embryo. For dsOct4 rescue experiment, 25 ng/μl dsOct4 was co-microinjected with dsCtr9.
RNA extraction, PCR and real-time PCR
Total RNA from embryos (n=5–10/pool) was extracted using the Roche High Pure isolation kit (Roche product ♯ 1828665). cDNA synthesis was performed using M-MLV Reverse Transcriptase (product ♯ M1701). To quantify gene expression differences between KD and control groups, real-time PCR was performed on a Stratagene MX3005p using Applied Biosystems Gene Expression Assays and Quanta Supermix (product ♯ 95078) probe based reactions. All qPCR reactions included Gapdh Vic-labeled multiplex control. One embryo equivalent of cDNA was used for each real-time PCR reaction with a minimum of three replicates for all results shown. Taqman Gene Expression Assays from Applied Biosystems used: Ctr9, Mm00493862_m1; Rtf1, Mm01324605_m1; Setd2, Mm01250225_m1; Elf5, Mm00468732_m1; Eomes, Mm01351985_m1; Mest, Mm00485003_m1; Peg3, Mm01337379_m1; Snrpn, Mm02391920_g1; Cdx2, Mm01212280_m1; Oct4, Mm00656129_gH; Nanog, Mm01617761_g1; Sox2, Mm00488369_s1. Unless otherwise stated, quantification was normalized to Gapdh (ABI, 4352339E-080 6018) mRNA.
Immunofluorescence
Preimplantation embryos were fixed with 4% paraformaldehyde in PBS for 25 min at room temperature, permeabilized with 0.2% Triton X-100 for 25 min, then blocked in 10% FBS/0.1% Triton X-100/PBS for 1 h after 3 times washing in 0.1% Triton X-100 PBS, and incubated with antibodies for 1 h at room temperature or overnight at 4 °C followed by incubation with Alexa Flour secondary antibodies 488, 543, 647 (Invitrogen) at 37 °C for 1 h. DNA was stained with DAPI and samples were mounted and observed with the Nikon Eclipse TE-2000-S microscope (Nikon). Identical image capture settings were used for embryos in experiment. Antibodies used are listed as follows: Immunogen (Vendor, Catalog ♯, Dilution, and Species). CDH1 (Abcam, Ab53033, 1:200, Rabbit); CDX2 (Biogenex, AM392-5 M, 1:200, Mouse); CTR9 (Abcam, Ab84487, 1:200, Rabbit); ELF5 (Santa Cruz, sc9645, 1:100, Goat); EOMES (Abcam, Ab23345, 1:200, Rabbit); GATA6 (R&D Systems, AF1700, 1:200, Goat); H3K36me3 (Abcam, Ab9050, 1:200, Rabbit); H3K4me3 (Abcam, Ab8580, 1:200, Rabbit); H3K9me3 (Abcam, Ab8988, 1:200 Rabbit); NANOG (CosmoBio, RCAB0002P-F, 1:200, Rabbit); OCT4 (Santa Cruz, sc5279, 1:200, Mouse); SOX17 (R&D Systems, NL1924R, 1:300, Goat); and SOX2 (Santa Cruz, sc17320, 1:200, Goat). For IF experiments, we performed at least 3 replicates with at least 3 embryos/group with each antibody combination (although typically groups of 5–10 were used). We only present results where at least 75% of embryos show the same/similar result.
Bisulfite sequencing
Bisulfite sequencing of Mest (GenBank™ accession number AF017994; nucleotides 2220–2556) and Peg3 DMRs (NT_039413.7; 3683033–3682588) was done as follows: Groups of 3–7 blastocysts were lysed and bisulfite-converted according to the manufacturer’s instruction using (EZ DNA Methylation-Direct™ Kit, Zymo). Bisulfite converted DNA primers were used: Mest outside forward: GATTTGGGATATAAAAGGTTAATGAG, outside reverse: TCATTAAAAACACAAACCTCCTTTAC; inside forward: TTTTAGATTTTGAGGGTTTTAGGTTG, inside reverse: AATCCCTTAAAAATCATCTTTCACAC; Peg3: outside forward: TTTTGATAAGGAGGTGTTT, outside reverse: ACTCTAATATCCACTATAATAA; inside forward: AGTGTGGGTGTATTAGATT, inside reverse: TAACAAAACTTCTACATCATC. Oct4 bisulfite assay exactly as previously published (Hattori et al., 2004) with primers, PRO F, 5′-TGGGTTGAAATATTGGGTTTATTT-3′; PRO R, 5′-CTAAAACCAAATATCCAACCATA-3′. One-half embryo equivalent of the mutagenized DNA was used for each first round PCR reaction. 5 μl of first round PCR product was used as template for second round PCR reactions. The PCR products were subcloned into pCR®II-TOPO® (Invitrogen) and individual clones were sequenced by Eton Biosciences Inc. Sequence data was analyzed using CodonCode Aligner software.
Allele specific assays
Meg3 RFLP: RT-PCR was performed with intron spanning primers: Meg3-Lc: CACGGACACAGACACCTGC and Meg3-Lb: AAGCACCATGAGCCACTAGG in order to amplify a product containing a useful SNP (position 834 in ENSMUSG00000021696, B6=A, PWD=G). Restriction digestion with Bsrd1 was performed in order to resolve parental specific bands on a 0.7% acrylamide gel (Maternal B6=321 and 33 base pair bands, Paternal PWD=354 base pair uncut amplicons).
Mest RFLP: RT-PCR was performed with intron spanning primers: Peg1_F1: 5′-TTCGCAACAATGACGGCAAC-3′ and Peg1_R1: 5′-GAGGTGGACTATTGTGTCAC-3′ in order to amplify a product containing a useful SNP (position 1021 in ENSMUSG00000051855, B6=G, PWD=A). Restriction digestion with Xmn1 was performed in order to resolve parental specific bands on a 0.7% agarose gel (Maternal B6=422 and 63 base pair bands, Paternal PWD=485 base pair uncut amplicons).
Statistical analysis
All experiments were repeated at least three times unless otherwise stated. Student t test was used to evaluate the difference between groups and a value of P<0.05 was considered to be statistically significant. Data are expressed as mean±s.e.m.
Results
Expression of Ctr9 in preimplantation embryos
Ctr9 mRNA was detected in all stages examined during preimplantation development (Fig. 1A), with highest levels at the 4-cell and 8-cell stage, and a dramatic reduction in morula and blastocysts. This pattern suggests Ctr9 is zygotically transcribed and that only limited maternal Ctr9 (if any) contributes to preimplantation development. Immunofluorescent (IF) analysis revealed no nuclear localization of CTR9 during cleavage stages, with the highest accumulation in nuclei of morulae, and then reduced (but present) signal in blastocysts (Fig. 1B). The exclusive detection of CTR9 protein in morula and blastocysts is consistent with the highest Ctr9 mRNA at slightly earlier stages. This dynamic expression pattern suggests precise regulation of CTR9 function, at both the mRNA (transcriptional) and protein (translational and/or degradation) levels within blastomeres. CTR9 was detected in all blastomeres of morula and blastocysts, and no difference in localization was detected between inner cell mass (ICM) and trophectoderm (TE).
Fig. 1.
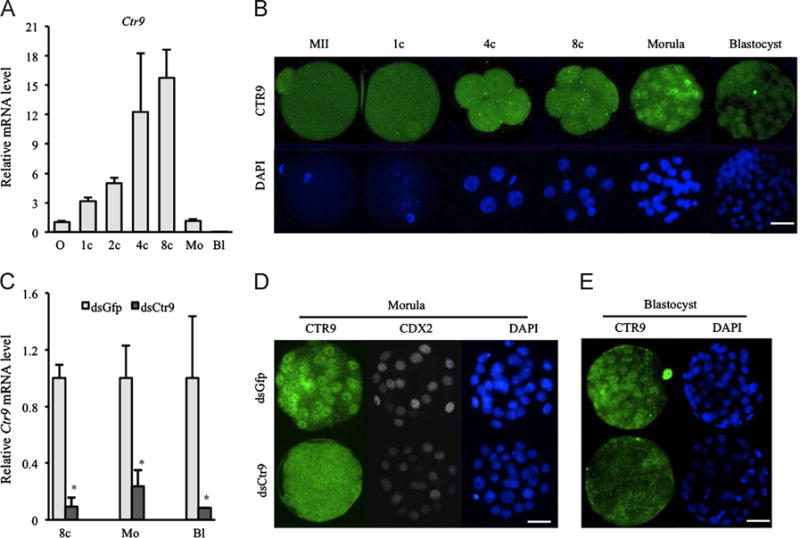
Efficient depletion of Ctr9 in preimplantation embryos. (A) qPCR analysis shows that Ctr9 mRNA is present throughout preimplantation development. (B) CTR9 protein is detected in nuclei of morulae and blastocysts but not during cleavage stages. (C) Endogenous Ctr9 mRNA is significantly depleted by dsCtr9 injection. Asterisks indicate P<0.05. Error bars represent SEM. (D,E) CTR9 protein is efficiently knockdown in morula (D, 11 dsGFP and 10 dsCtr9 examined) and blastocysts (E, 9 dsGFP and 12 dsCtr9 examined) after microinjection of dsCtr9. O, MII oocytes; 1c, 1-cell stage; 2c, 2-cell stage; 4c, 4-cell stage; 8c, 8-cell stage; Mo, morula; Bl, blastocyst stage. Scale bar: 50 μm.
Efficient depletion of CTR9 by microinjection of dsRNA
We routinely microinject double-stranded RNA designed against specific transcripts (dsRNA) into zygotes to silence genes of interest by RNAi (Maserati et al., 2011, 2012; Zhang et al., 2013). This approach has been widely demonstrated as a robust tool to achieve RNAi in mammalian preimplantation embryos without off-target effects (Svoboda et al., 2000; Wianny and Zernicka-Goetz, 2000). Microinjection of dsCtr9 greatly reduced endogenous Ctr9 mRNA abundance at all stages examined (Fig. 1C). Furthermore, CTR9 protein was undetectable in nuclei of dsCtr9 morula (Fig. 1D, control: n=11, KD: n=10) and blastocysts (Fig. 1E, control: n=9; KD: n=12) after dsCtr9 injection.
Loss of CTR9 compromises both TE and ICM outgrowth potential
We observed normal blastocyst formation rates and blastocyst morphology in dsCtr9 embryos. When cultured in vitro for three additional days, the majority of control blastocysts (18/21 dsGFP) hatch and form outgrowths with characteristic trophoblast giant cells and a single stalk- like colony of ICM cells (Fig. 2A, upper panel and B). However, only one quarter (7/28) of Ctr9 KD embryos form blastocyst outgrowths, while the majority (21/28) remain with blastocyst-like morphology (Fig. 2A, lower panel and B). dsCtr9 embryos that did show outgrowth were markedly reduced in both overall size of outgrowth area and cell number. In order to confirm that the observed defects were due to loss of Ctr9, microinjection of a second, non-overlapping dsRNA against Ctr9 showed the same outgrowth defects (not shown).
Fig. 2.
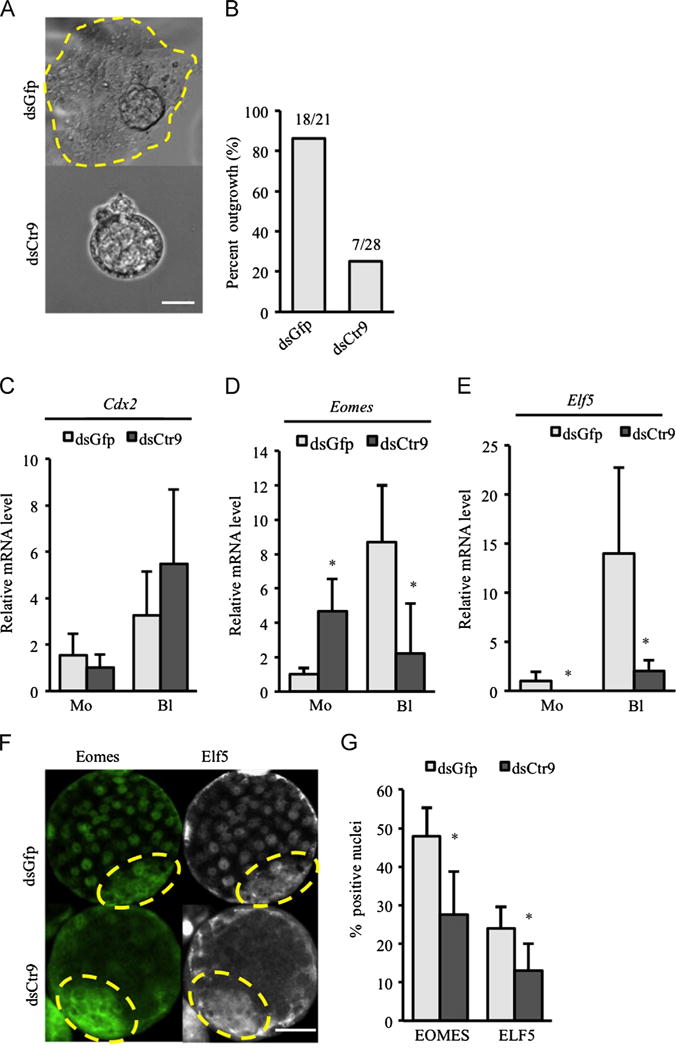
CTR9 deficiency results in failure of trophectoderm outgrowth. (A) Typical outgrowths are observed in control embryos after 3 days in culture (A, circle in upper panel). Failure of blastocyst outgrowth was observed in dsCtr9 embryos (A, lower panel). Scale bar: 20 μm. (B) Quantification of outgrowth potential for dsGfp and dsCtr9 embryos (21 dsGfp and 28 dsCtr9 blastocysts were analyzed). (C–E) Expression of trophectoderm specific genes Cdx2 (C), Eomes (D) and Elf5 (E) in dsGfp and dsCtr9 embryos at morula and blastocyst stages (5–10 embryos/pool, two independent experiments). Asterisks indicate P<0.05. Error bars represent SEM. (F) EOMES and ELF5 protein are reduced in dsCtr9 blastocysts. ICM area is circled with dotted line. Scale bar: 50 μm. (G) Graph representing percent EOMES positive or ELF5 positive cells in dsGfp and dsCtr9 blastocysts (EOMES: 12 dsGfp and 12 dsCtr9 examined; ELF5: 7 dsGfp and 9 dsCtr9 embryos examined). Asterisks indicate P<0.05. Error bars represent SEM.
Trophectoderm lineage defects in dsCtr9 embryos
The failure of Ctr9-deficient blastocysts to form outgrowths suggested a defect in proliferation or differentiation of the trophectoderm (TE). However, cell counting revealed normal numbers of cells (both total and ICM, Supplemental Fig. 1A) in dsCtr9 embryos, suggesting that defects in proliferation are not a major factor. We therefore assessed Cdx2, Eomes and Elf5 expression (genes required for trophectoderm lineage identity (Donnison et al., 2005; Niwa et al., 2005; Russ et al., 2000, Strumpf et al., 2005)) by qPCR and IF. No significant differences were found in Cdx2 expression (Fig. 2C) or localization (Fig. 1D). CDX2 expression in dsCtr9 embryos indicated that TE are specified and present. However, both Eomes and Elf5, were notably reduced in Ctr9-deficient blastocysts by both qPCR (Fig. 2D,E) and IF (Fig. 2F,G, Eomes: control: n=12 and KD: n=12; Elf5: control: n=7 and KD: n=9). These data suggest that while TE cells are specified from ICM in the absence of Ctr9, their molecular identity is compromised, which likely contributes to their outgrowth failure.
Molecular defects in dsCtr9 inner cell mass
To evaluate the developmental potential of Ctr9-deficient pluripotent cells, ICM cells were isolated by immunosurgery and cultured on fibronectin plates which has been shown to enhance PE growth/differentiation (Behrendtsen et al., 1995). After 3 days, wild type ICM outgrowths have visible parietal endoderm cells (derivatives of primitive endoderm (PE) cells) migrating away from the ICM colony (as reported by others (Behrendtsen et al., 1995), arrow in Fig. 3A). However, the majority of Ctr9-deficient ICMs showed no evidence of PE outgrowth (Fig. 3A, lower left and 3B) or markedly reduced numbers of cells (Fig. 3A, lower right and 3C). This result suggests defects in both ICM potential as well as PE differentiation in the absence of Ctr9 function.
Fig. 3.
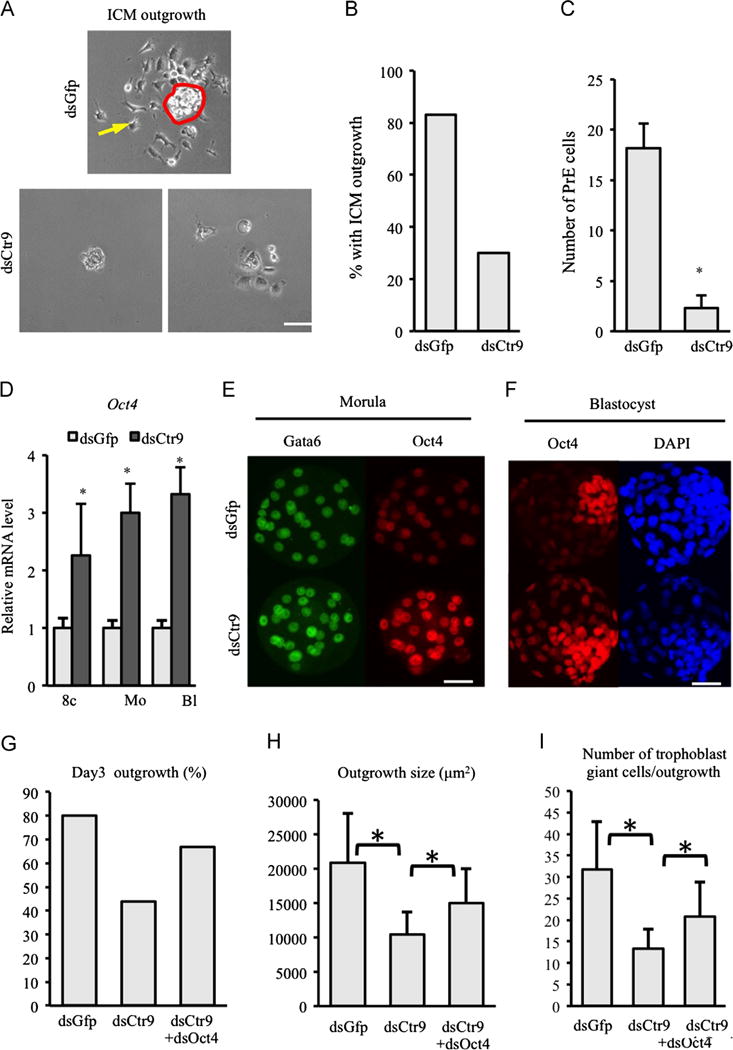
Depletion of CTR9 abrogates ICM identity and differentiation potential. 3 days in culture following immunosurgical removal of TE, primitive endoderm cells (yellow arrow upper panel in A) migrate away from control ICM (red circle, upper panel in A). Very few cells (either ICM or PE) are present when Ctr9-deficient ICMs are plated in culture (A, lower panels). Scale bar: 20 μm. (B) Graph representing outgrowth potential of isolated ICM. (C) Quantification of the number of primitive endoderm cells observed per ICM. (D) Oct4 mRNA abundance is increased consistently beginning at the 8-cell after Ctr9 knockdown. (E,F) OCT4 protein level is enhanced in morula (15 dsGfp, 14 dsCtr9 morula examined) and trophectoderm cells of blastocysts (16 dsGfp, 25 dsCtr9 blastocysts examined) in dsCtr9 embryos. Scale bar: 50 μm. (G–I) Reduction of Oct4 partially rescues dsCtr9 outgrowth potential (G), average outgrowth size (H) and number of trophoblast giant cells observed (I, 5 dsGfp, 9 dsCtr9, 6 dsGfpþdsOct4 embryos examined). Asterisks indicate P<0.05 by student T-test. Error bars represent SEM.
We next examined molecular markers of pluripotent cells in control and dsCtr9 embryos. qRT-PCR revealed that Oct4 mRNA was consistently increased from the 8-cell to blastocyst stage in dsCtr9 embryos (Fig. 3D), while Nanog and Sox2 mRNA were unchanged in Ctr9 KD embryos (not shown). IF analysis also revealed increased OCT4 signal intensity in OCT4-positive blastomeres at the morula stage as well as in presumptive TE (outer cells) at the blastocyst stage (Fig. 3E and F).
It has been previously established that suppression of Oct4 in trophectoderm stem cells is controlled by epigenetic modification to the locus, including DNA methylation (Hattori et al., 2004). We examined the DNA methylation status in the Oct4 promoter in control and KD embryos. However, we observed no DNA methylation in either control or KD embryos (Supplemental Fig. 1B), suggesting that the regulation of Oct4 expression in trophectoderm by CTR9 in vivo is independent of DNA methylation.
In order to test the possibility that OCT4 overexpression contributes to the outgrowth failure of dsCtr9 embryos, we microinjected dsCtr9 plus a titrated amount of dsOct4. As anticipated, reduction of Oct4 partially restored the outgrowth potential in embryos lacking CTR9 (Fig. 3G–I), indicating that mis-regulation of OCT4 levels does indeed alter the potential of dsCtr9 embryos.
In control embryos, NANOG becomes restricted to epiblast (EPI) cells in late blastocysts (Fig. 4A, upper panel, n=13). Interestingly, in addition to EPI expression, ectopic NANOG was detected in some TE cells in the absence of Ctr9 (Fig. 4A, arrows lower panel, n=21). In contrast, SOX2 positive nuclei, which are also restricted to ICM/EPI in expanded blastocysts, were severely reduced in dsCtr9 embryos (Fig. 4B, control: n=18, KD: n=23). Fgf4 is expressed specifically by ICM and is critical for PE formation and TE proliferation (Frankenberg et al., 2011; Kang et al., 2013; Tanaka et al., 1998; Yamanaka et al., 2010; Yuan et al., 1995). qPCR showed that Fgf4 mRNA was reduced in dsCtr9 blastocysts but not at earlier stages (not shown), likely a consequence of the absence of nuclear SOX2 (Yuan et al., 1995). Together, these data suggest that in the absence of CTR9, failure to repress OCT4 in the TE cells combined with a lack of SOX2-meditated FGF4 signaling from the ICM results in the outgrowth/TE defects.
Fig. 4.
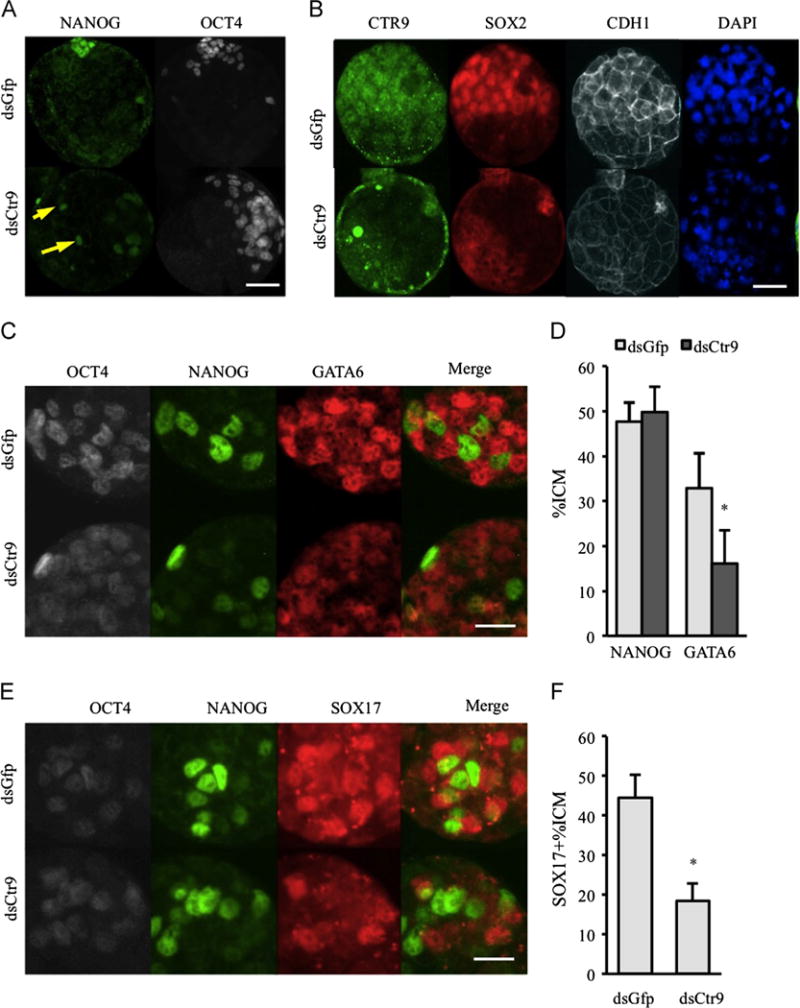
Molecular specification of ICM/EPI and PE is abnormal in absence of Ctr9. (A) NANOG is restricted to future epiblast cells in control embryos, but is ectopically detected in some trophectoderm cells (arrows) in dsCtr9 embryos (13 dsGfp and 21 dsCtr9 expanded blastocysts analyzed). (B) SOX2 positive cells are reduced in absence of CTR9 (18 dsGfp and 23 dsCtr9 blastocysts analyzed). (C) GATA6 is restricted to primitive endoderm cells in control blastocysts. However, it remains expressed in the majority of blastomeres in dsCtr9 embryos (21 dsGfp and 22 dsCtr9 expanded blastocysts analyzed). (D) The percent of ICM cells that are NANOG positive is normal and the percent of highly expressing GATA6 (putative PE cells) cells is reduced in dsCtr9 blastocysts. (E,F) The number of SOX17 positive cells is greatly reduced in dsCtr9 expanded blastocysts (14 dsGfp and 13 dsCtr9 embryos analyzed). Scale bars in A,B are 50 μm. Scale bars in C and E are 25 μm. Asterisks indicate P<0.05. Error bars represent SEM.
GATA6 and SOX17 are transcription factors that are essential for proper PE formation and differentiation (Artus et al., 2011; Koutsourakis et al., 1999). GATA6 is initially expressed in each blastomere in morula and then observed in a salt-and-pepper distribution in ICM blastomeres by E3.75 (Chazaud et al., 2006). SOX17 is initially expressed after GATA6 in small number of ICM cells prior to E3.5 and is found coexpressed with GATA6 in PE by E3.75 (Frum et al., 2013; Morris et al., 2010; Niakan et al., 2010). In control embryos, GATA6 becomes highly expressed in PE cells (high GATA6, low NANOG) although low levels of expression are seen in some TE (Fig. 4C, upper panel, n=21). However, GATA6 levels remain low among the majority of ICM cells in the absence of Ctr9 (Fig. 4C, lower panel, n=22). Additionally, the number of NANOG positive cells is not increased in dsCtr9 ICMs, suggesting that the compromised expression of GATA6 is not due to an increase in NANOG (Fig. 4D). Furthermore, very few SOX17 positive cells are present in dsCtr9 blastocysts (Fig. 4E and F, n=14 for dsGfp and n=13 for dsCtr9), indicating defects in PE formation and/or molecular patterning of ICM derivatives in dsCtr9 embryos.
Ctr9 deficiency leads to aberrant expression of imprinted genes
Genomic imprinting is an epigenetic phenomenon that causes mono-allelic parent-of-origin expression of a small subset of mammalian genes. Aberrant genomic imprinting is associated with numerous disorders (reviewed in (Lee and Bartolomei, 2013)). Allele-specific epigenetic modifications are established in the parental germline and must be faithfully maintained to ensure successful development, particularly during preimplantation when dramatic epigenetic reprogramming occurs. As mentioned above, we initially identified Ctr9 through a phenotype-driven RNAi screen designed to identify genes required for imprinted gene expression.
Mest (Peg1) is a paternally expressed, maternally imprinted (silent) gene, such that only paternal mRNA is detected in control blastocysts (dsGFP, Fig. 5A). However, in dsCtr9 blastocysts we observed biallelic Mest expression – the maternal allele was not repressed (imprinted). We also observed a loss of imprinting (LOI) of the paternally imprinted (maternally expressed) Meg3 transcript (Fig. 5B). In addition to biallelic expression of Mest and Meg3, we observed increased levels of Mest in dsCtr9 and dsRtf1 (another component of PAF1c complex) embryos (Fig. 5C). Furthermore, we also observed increased expression of Peg3 and Snrpn, 2 other paternally expressed imprinted loci (Fig. 5C) in dsCtr9 blastocysts. To determine if the loss of imprinting was due to defects in allele-specific methylation, we examined the status of the differentially methylated region (DMR) at the Mest and Peg3 loci. Bisulfite sequencing revealed no significant differences in overall methylation patterns between control and Ctr9 KD blastocysts (Fig. 5D). At both DMRs, the imprinted allele was hypermethylated in control and dsCtr9 embryos (Fig. 5D), indicating that loss of DNA methylation is not responsible for the failure to repress the maternal Peg1 and paternal Meg3 alleles in the absence of Ctr9.
Fig. 5.
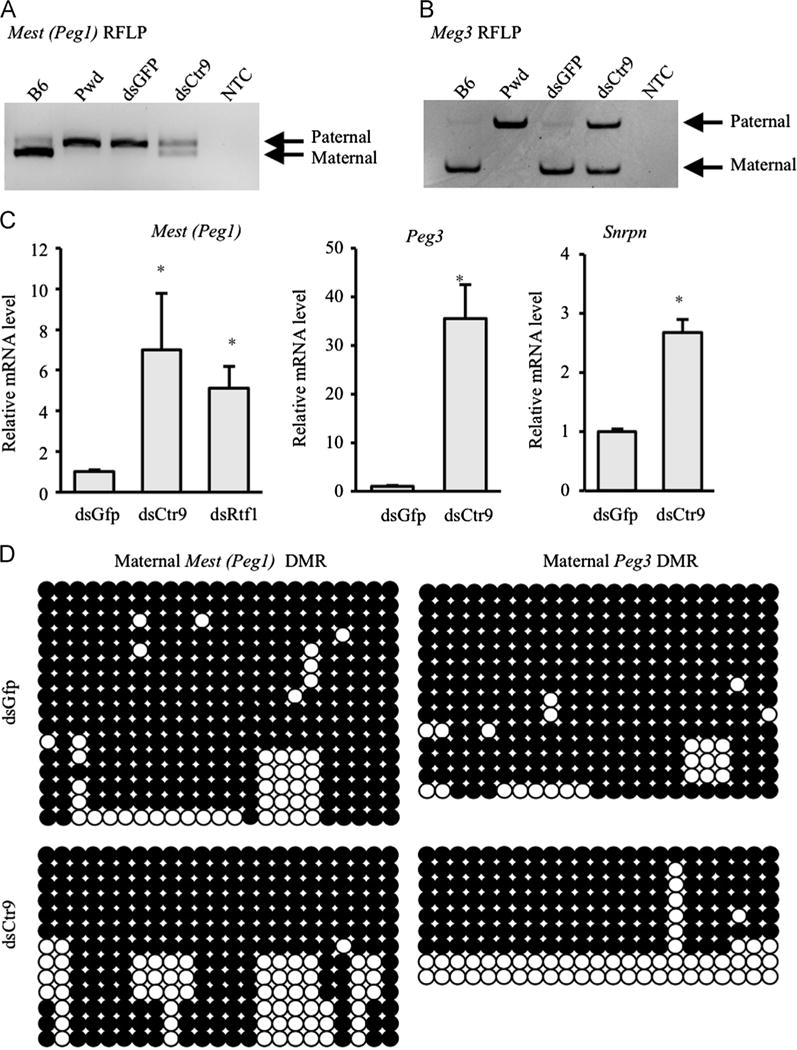
Loss of imprinting in dsCTR9 blastocysts. Restriction Fragment Length Polymorphism (RFLP) assays assessed allele specific (imprinted) expression of the Mest (A) and Meg3 (B) transcripts. Loss of imprinting was observed at both loci in dsCtr9 blastocysts where biallelic expression is obvious in ds dsCtr9 blastocysts, but control dsGFP blastocysts show parent of origin mono-allelic (imprinted) expression as expected (only the Paternal allele of Mest, and only the Maternal allele of Meg3 are expressed in control embryos). NTC: No template control. (C) Mest, Peg3 and Snrpn mRNA levels are significantly increased in the absence of Ctr9 or Rtf1. Asterisks indicate P<0.05. Error bars represent SEM. (D) Bisulfite sequencing of Mest (GenBank™ accession number AF017994; nucleotides 2220–2556) and Peg3 DMRs (NT_039413.7; 3683033–3682588) in dsCtr9 and dsGfp blastocysts revealed no significant loss of DNA methylation on the repressed allele. Note that only the maternal alleles (identified by SNP) are shown. Paternal alleles were entirely unmenthylated as expected (not shown). Open circle: unmethylated CpG; Filled circle: methylated CpG; Asterisks indicate P<0.05. Error bars represent SEM.
Loss of histone H3K36me3 in dsCtr9 embryos
The PAF1c has been shown to be required for SET2-mediated H3K36me3 in yeast (Chu et al., 2007). Additionally, interaction of SET2 with elongating RNA polymerase II has been shown to be PAF1c-dependent (Krogan et al., 2003b). Interestingly, H3K36me3 also influences histone acetylation status by recruiting HDACs (Keogh et al., 2005). Setd2 is detected at all preimplantation stages with highest expression at the 2–4 cell stage (Fig. 6E). IF indicates that H3K36me3 is localized at low levels in 8-cell embryos and obvious in all nuclei at the morula stage (Fig. 6A). However, in blastocysts, only a subset of cells are H3K36me3 positive (Fig. 6F), consistent with previous reports (Boskovic et al., 2012). We found normal expression of Setd2 in dsCtr9 embryos (Supplemental Fig. 2). However, H3K36me3 was greatly reduced at all stages examined in dsCtr9 embryos (Fig. 6A,B), indicating SET2-mediated H3K36me3 in vivo requires CTR9 and is functionally conserved from yeast to mammals. In contrast, no difference was observed in H3K4me3 or H3K9me3 in dsCtr9 embryos (Fig. 6C,D). To examine if embryos lacking SET2 would share phenotypic characteristics with PAF1c components, we knocked down Setd2 by microinjection of dsSetd2 RNA. As expected, H3K36me3 signal was also reduced after injection of dsSetd2 (Fig. 6F), and we observed similar defects in the potential of dsSetd2 blastocysts, including reduced outgrowth area and reduced numbers of trophoblast giant cells per outgrowth (Fig. 6G–I). Additionally, Eomes and Elf5 are slightly reduced in dsSetd2 blastocysts, as they are in dsCtr9 embryos (Supplemental Fig. 2).
Fig. 6.
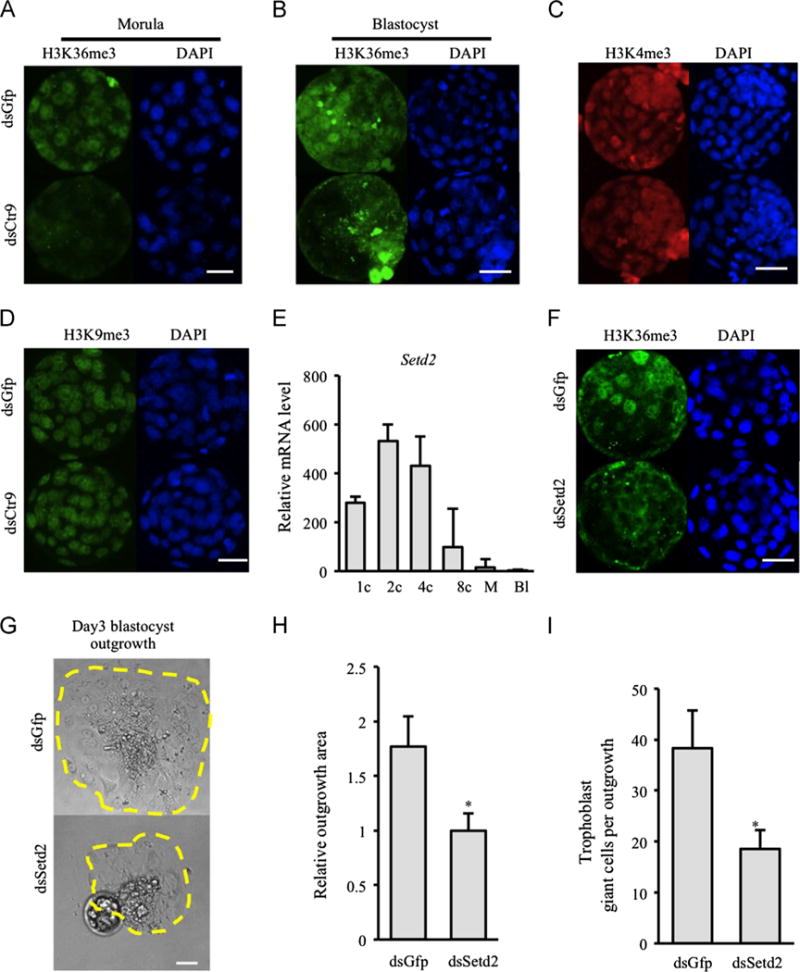
CTR9 deficiency results in global reduction of H3K36me3 in vivo. H3K36me3 is severely reduced in dsCtr9 morula (A) and blastocysts (B) (9 control and 10 dsCtr9 morula; 9 control and 13 dsCtr9 blastocysts were analyzed). Scale bar: 50 μm. (C–D) Normal level and distribution of H3K4me3 and H3K9me3 were observed in dsCtr9 embryos at all stages examined. Scale bar: 50 μm. Knock down of Setd2 (that mediates H3K36me3) similarly compromised blastocyst outgrowth potential (E), outgrowth area (F), as well as the number of trophoblast giant cells observed (G). Scale bar in E is 20 μm. Asterisks indicate P<0.05. Error bars represent SEM.
Knock-down of Rtf1 phenocopies Ctr9
To confirm that the defects observed in dsCtr9 embryos was due to loss of PAF1c function, we also performed loss of function analysis of another PAF1c member, Rtf1, which is expressed in a similarly dynamic pattern to Ctr9 during preimplantation development (Fig. 7A). We knocked down Rtf1 by dsRtf1 microinjection (Fig. 7B), and found normal developmental rate and morphology in preimplantation embryos (not shown). We observed similar outgrowth defects in Rtf1-deficient blastocysts (Fig. 7C) as well as reduced Eomes and Elf5 mRNAs (Fig. 7D). Additionally, blastomeres with SOX2 positive nuclei were reduced and OCT4 signal is increased in dsRtf1 blastocysts (Fig. 7F). The similarity of dsCtr9 and dsRtf1 phenotypes strongly suggests that the defects observed in each KD are due to disruption of PAF1c function.
Fig. 7.
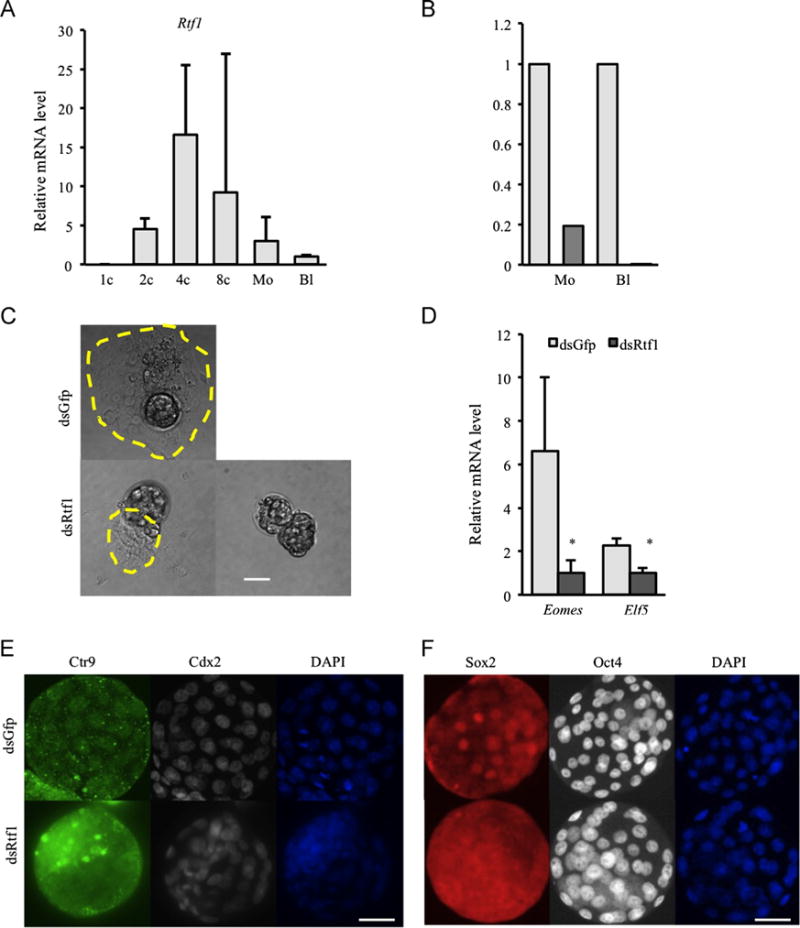
dsRtf1 phenocopies dsCtr9. (A) Rtf1 mRNA is expressed in a similar pattern to Ctr9 during preimplantation development. (B) Rtf1 mRNA is efficiently depleted by microinjection of dsRtf1. (C) Rtf1 deficiency results in compromised blastocyst outgrowth potential. Scale bar: 20 μm. (D) As in dsCtr9 embryos, Eomes and Elf5 are reduced in the absence of Rtf1. Asterisks indicate P<0.05 significance. Error bars represent SEM (E) SOX2 positive cells are reduced in dsRtf1 blastocysts (13 control and 17 dsRtf1 blastocysts were analyzed). Scale bar: 50 μm.
Independent knock-down of Ctr9, Rtf1 and Setd2 in early embryos provided a unique opportunity to examine the possibility that these PAF1c complex members transcriptionally regulate each other’s expression in vivo. We therefore examined expression of each transcript in the absence of the others. Neither Setd2 nor Rtf1 mRNAs we altered when other PAF1c members were disrupted (Supplementary Fig. 2A and C). However, in dsRtf1 embryos, Ctr9 mRNA was significantly increased (Supplementary Fig. 2B) and CTR9 protein was diminished (Fig. 7E). These results indicate that Rtf1 is critical for the stability of CTR9 protein and suggest a feedback mechanism within early embryos that can modulate Ctr9 mRNA in response to CTR9 protein abundance.
Discussion
The first lineage decision occurs during preimplantation when reciprocal inhibition of CDX2 and OCT4 help establish and maintain proper ICM/TE cell fate (Niwa et al., 2005). Several transcription factors, such as Eomes and Elf5, are required for TE lineage differentiation and function, but are not essential for initial TE specification (Donnison et al., 2005; Russ et al., 2000; Zhou et al., 2005). Here we document normal Cdx2 levels but reduced expression of Eomes and Elf5 in Ctr9 and Rtf1 depleted embryos, suggesting that although TE is initially specified, the molecular identity is perturbed in the absence of PAF1c. The reduced lineage specific expression likely contributes to the failure of trophoblast outgrowth, as Eomes−/− blastocysts fail to attach and form TE outgrowths (Russ et al., 2000). Our findings are consistent with experiments showing that deletion of Cdc73, another member of PAF1, also results in a failure of TE outgrowth (Wang et al., 2008).
Additionally, the ICM of Ctr9-depleted embryos failed to proliferate in isolated ICM outgrowth assays. Oct4, Nanog and Sox2 are critical transcription factors each essential for maintaining pluripotency of ICM and embryonic stem cells (Avilion et al., 2003; Chambers et al., 2003; Mitsui et al., 2003; Nichols et al., 1998). We observed increased Oct4 expression – both RNA and protein - in dsCtr9 embryos, and a failure of OCT4 restriction to ICM. Ding et al. reported that PAF1c is required to activate and maintain proper levels of Oct4 in ES cells (Ding et al., 2009). These contrasting results show that PAF1 regulates the Oct4 locus in both systems, but indicates a distinction between ES cell models and in vivo ICM, highlighting the need to confirm in vitro findings in vivo. One explanation may be a difference in the status of the cells when PAF1c is disrupted. Ding et al. used ES cells, which have already established and maintained appropriate epigenetic gene expression programs. Our study abrogated PAF1c function in blastomeres in vivo, precisely during the process of epigenetic lineage specific programming.
Nanog is normally expressed in subsets of ICM that give rise to the epiblast after differentiation of PE. Surprisingly, NANOG is ectopically detected in TE of dsCtr9 embryos. As with regulation of the Oct4 locus, this result is inconsistent with Ding et al.’s ES cell experiments, which indicate that PAF1c binds to and activates the Nanog locus (Ding et al., 2009). However, both our data and Ding et al. show that loss of PAF1c inhibits PE differentiation. Further experiments will be necessary to define lineage specific relationships between PAF1c and Oct4/Nanog loci, although both studies support a role for PAF1c in PE lineage specification and/or differentiation.
Chromatin immunoprecipitation experiments have revealed that H3K36me3 differentially marks the active alleles of imprinted loci, including Dlk-Dio3, Snrpn, Grb10, Impact and Peg3 (Mikkelsen et al., 2007). We observed increased expression of Mest, Peg3 and Snrpn as well as DNA methylation-independent loss of imprinting at Mest and Meg3 in the absence of Ctr9. Similar to the loss of imprinting that we document, previous experiments have shown that knockdown of either MBD3 and MTA2 (both NuRD complex components) results in loss of imprinting at specific loci, including H19(Ma et al., 2010; Reese et al., 2007). The increased locus-specific expression that we observe in dsCtr9 embryos suggests that during preimplantation development, PAF1c may act as a locus specific repressor in addition to regulator of global H3K36me3. Repression by PAF1c through recruitment of Suv39H1 (and resulting repressive histone modifications) has been shown to occur at the cyclin D1 locus in mammalian tissue culture models (Yang et al., 2010). Furthermore, the increase in expression of imprinted genes that we observe in dsCtr9 embryos is greater than 2-fold, suggesting that PAF1c may contribute to appropriate regulation of both alleles at imprinted loci. Many previous studies have shown the critical importance of appropriate levels of imprinted gene expression during preimplantation in both normal and cloned embryos, and that overexpression (loss of imprinting) can result in developmental failure in various mammals (reviewed in (Bartolomei and Ferguson-Smith, 2011)). Interestingly, loss of function (KO) of each of the imprinted genes that we find over-expressed in dsCtr9 embryos (Meg3, Mest, Peg1 and Peg3) results in growth defects during development. However, experiments to specifically overexpress these genes during preimplantation have not been performed – so it remains unclear to what degree the loss of imprinting that we observe contributes to the overall phenotype of dsCtr9 embryos.
In yeast, it is well established that PAF1c recruits Set2 resulting in H3K36me3 (Chu et al., 2007). Here, we have shown that H3K36me3 is CTR9-dependent in vivo, while global levels of H3K4me3, and H3K9me3 are not altered in dsCtr9 embryos, indicating a specific role of PAF1c in regulation of H3K36me3 in mammalian embryos. Although many molecular functions of PAF1c have been documented in disparate cell types and organisms, relatively little is known about the developmental role of PAF1c in mammalian embryos. Here we have demonstrated that CTR9 and RTF1, both components of mammalian PAF1c are required for epigenetic events and lineage specification and/or function during preimplantation development (summarized in Fig. 8). We show that CTR9 is required for H3K36me3 in vivo and that PAF1c is required for DNA methylation-independent regulation of imprinted loci during preimplantation development.
Fig. 8.
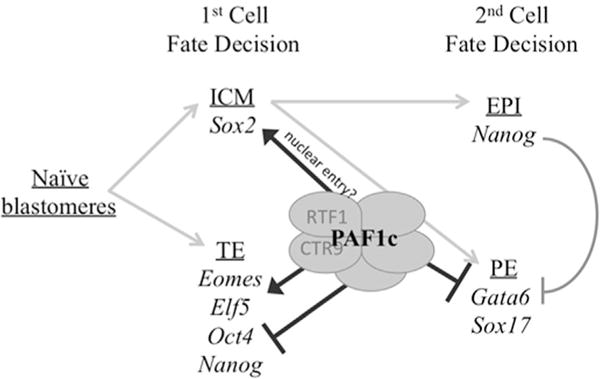
PAF1c function during early lineage decisions. Our data suggests that PAF1c is required for molecular identity of ICM and TE cells after the first cell fate decision. Loss of function of CTR9 or RTF1 results in increased OCT4 and NANOG positive TE cells, suggesting that PAF1c normally represses Oct4 and Nanog in TE. Additionally, we document an absence of nuclear SOX2 in the ICM, indicating that PAF1c function may be required for nuclear entry of SOX2 which also contributes to TE and PE lineage specification through FGF signaling. Additionally, fewer GATA6-positive and Sox17-positive cells are present in dsCtr9 embryos suggesting that PAF1c is required for activation of these PE markers. Together, these findings suggest a theme that at each lineage decision, PAF1c regulates some factors that must be repressed in pluripotent cells (OCT4, NANOG) and others that must be activated in differentiating cells (EOMES and ELF5 in TE, GATA6 and SOX17 in PE) in order for successful lineage decisions and function.
Supplementary Material
Acknowledgments
We thank members of the Mager and Tremblay Labs for discussion and suggestions. This work was supported by Grant no. 6-FY11-367 from the March of Dimes Foundation to JM.
Appendix A. Supplementary materials
Supplementary data associated with this article can be found in the online version at http://dx.doi.org/10.1016/j.ydbio.2013.09.005.
References
- Artus J, Piliszek A, Hadjantonakis AK. The primitive endoderm lineage of the mouse blastocyst: sequential transcription factor activation and regulation of differentiation by Sox17. Dev Biol. 2011;350:393–404. doi: 10.1016/j.ydbio.2010.12.007. [DOI] [PMC free article] [PubMed] [Google Scholar]
- Avilion AA, Nicolis SK, Pevny LH, Perez L, Vivian N, Lovell-Badge R. Multipotent cell lineages in early mouse development depend on SOX2 function. Genes Dev. 2003;17:126–140. doi: 10.1101/gad.224503. [DOI] [PMC free article] [PubMed] [Google Scholar]
- Bartolomei MS, Ferguson-Smith AC. Mammalian genomic imprinting. Cold Spring Harbor Perspect Biol. 2011;3 doi: 10.1101/cshperspect.a002592. [DOI] [PMC free article] [PubMed] [Google Scholar]
- Behrendtsen O, Alexander CM, Werb Z. Cooperative interactions between extracellular matrix, integrins and parathyroid hormone-related peptide regulate parietal endoderm differentiation in mouse embryos. Development. 1995;121:4137–4148. doi: 10.1242/dev.121.12.4137. [DOI] [PubMed] [Google Scholar]
- Boskovic A, Bender A, Gall L, Ziegler-Birling C, Beaujean N, Torres-Padilla ME. Analysis of active chromatin modifications in early mammalian embryos reveals uncoupling of H2A.Z acetylation and H3K36 trimethylation from embryonic genome activation. Epigenetics: Off J DNA Methylation Soc. 2012;7:747–757. doi: 10.4161/epi.20584. [DOI] [PubMed] [Google Scholar]
- Bray S, Musisi H, Bienz M. Bre1 is required for Notch signaling and histone modification. Dev Cell. 2005;8:279–286. doi: 10.1016/j.devcel.2004.11.020. [DOI] [PubMed] [Google Scholar]
- Chambers I, Colby D, Robertson M, Nichols J, Lee S, Tweedie S, Smith A. Functional expression cloning of Nanog, a pluripotency sustaining factor in embryonic stem cells. Cell. 2003;113:643–655. doi: 10.1016/s0092-8674(03)00392-1. [DOI] [PubMed] [Google Scholar]
- Chazaud C, Yamanaka Y, Pawson T, Rossant J. Early lineage segregation between epiblast and primitive endoderm in mouse blastocysts through the Grb2-MAPK pathway. Dev Cell. 2006;10:615–624. doi: 10.1016/j.devcel.2006.02.020. [DOI] [PubMed] [Google Scholar]
- Chu Y, Simic R, Warner MH, Arndt KM, Prelich G. Regulation of histone modification and cryptic transcription by the Bur1 and Paf1 complexes. EMBO J. 2007;26:4646–4656. doi: 10.1038/sj.emboj.7601887. [DOI] [PMC free article] [PubMed] [Google Scholar]
- Ding L, Paszkowski-Rogacz M, Nitzsche A, Slabicki MM, Heninger AK, de Vries I, Kittler R, Junqueira M, Shevchenko A, Schulz H, Hubner N, Doss MX, Sachinidis A, Hescheler J, Iacone R, Anastassiadis K, Stewart AF, Pisabarro MT, Caldarelli A, Poser I, Theis M, Buchholz F. A genome-scale RNAi screen for Oct4 modulators defines a role of the Paf1 complex for embryonic stem cell identity. Cell Stem Cell. 2009;4:403–415. doi: 10.1016/j.stem.2009.03.009. [DOI] [PubMed] [Google Scholar]
- Donnison M, Beaton A, Davey HW, Broadhurst R, L’Huillier P, Pfeffer PL. Loss of the extraembryonic ectoderm in Elf5 mutants leads to defects in embryonic patterning. Development. 2005;132:2299–2308. doi: 10.1242/dev.01819. [DOI] [PubMed] [Google Scholar]
- Frankenberg S, Gerbe F, Bessonnard S, Belville C, Pouchin P, Bardot O, Chazaud C. Primitive endoderm differentiates via a three-step mechanism involving Nanog and RTK signaling. Dev Cell. 2011;21:1005–1013. doi: 10.1016/j.devcel.2011.10.019. [DOI] [PubMed] [Google Scholar]
- Frum T, Halbisen MA, Wang C, Amiri H, Robson P, Ralston A. Oct4 cell-autonomously promotes primitive endoderm development in the mouse blastocyst. Dev Cell. 2013;25:610–622. doi: 10.1016/j.devcel.2013.05.004. [DOI] [PMC free article] [PubMed] [Google Scholar]
- Hattori N, Nishino K, Ko YG, Ohgane J, Tanaka S, Shiota K. Epigenetic control of mouse Oct-4 gene expression in embryonic stem cells and trophoblast stem cells. J Biol Chem. 2004;279:17063–17069. doi: 10.1074/jbc.M309002200. [DOI] [PubMed] [Google Scholar]
- Hemberger M, Dean W, Reik W. Epigenetic dynamics of stem cells and cell lineage commitment: digging Waddington’s canal. Nat Rev Mol Cell Biol. 2009;10:526–537. doi: 10.1038/nrm2727. [DOI] [PubMed] [Google Scholar]
- Jaehning JA. The Paf1 complex: platform or player in RNA polymerase II transcription? Biochim Biophys Acta. 2010;1799:379–388. doi: 10.1016/j.bbagrm.2010.01.001. [DOI] [PMC free article] [PubMed] [Google Scholar]
- Kang M, Piliszek A, Artus J, Hadjantonakis AK. FGF4 is required for lineage restriction and salt-and-pepper distribution of primitive endoderm factors but not their initial expression in the mouse. Development. 2013;140:267–279. doi: 10.1242/dev.084996. [DOI] [PMC free article] [PubMed] [Google Scholar]
- Keogh MC, Kurdistani SK, Morris SA, Ahn SH, Podolny V, Collins SR, Schuldiner M, Chin K, Punna T, Thompson NJ, Boone C, Emili A, Weissman JS, Hughes TR, Strahl BD, Grunstein M, Greenblatt JF, Buratowski S, Krogan NJ. Cotranscriptional set2 methylation of histone H3 lysine 36 recruits a repressive Rpd3 complex. Cell. 2005;123:593–605. doi: 10.1016/j.cell.2005.10.025. [DOI] [PubMed] [Google Scholar]
- Koch C, Wollmann P, Dahl M, Lottspeich F. A role for Ctr9p and Paf1p in the regulation G1 cyclin expression in yeast. Nucleic Acids Res. 1999;27:2126–2134. doi: 10.1093/nar/27.10.2126. [DOI] [PMC free article] [PubMed] [Google Scholar]
- Koutsourakis M, Langeveld A, Patient R, Beddington R, Grosveld F. The transcription factor GATA6 is essential for early extraembryonic development. Development. 1999;126:723–732. [PubMed] [Google Scholar]
- Krogan NJ, Dover J, Wood A, Schneider J, Heidt J, Boateng MA, Dean K, Ryan OW, Golshani A, Johnston M, Greenblatt JF, Shilatifard A. The Paf1 complex is required for histone H3 methylation by COMPASS and Dot1p: linking transcriptional elongation to histone methylation. Mol Cell. 2003a;11:721–729. doi: 10.1016/s1097-2765(03)00091-1. [DOI] [PubMed] [Google Scholar]
- Krogan NJ, Kim M, Tong A, Golshani A, Cagney G, Canadien V, Richards DP, Beattie BK, Emili A, Boone C, Shilatifard A, Buratowski S, Greenblatt J. Methylation of histone H3 by Set2 in Saccharomyces cerevisiae is linked to transcriptional elongation by RNA polymerase II. Mol Cell Biol. 2003b;23:4207–4218. doi: 10.1128/MCB.23.12.4207-4218.2003. [DOI] [PMC free article] [PubMed] [Google Scholar]
- Langenbacher AD, Nguyen CT, Cavanaugh AM, Huang J, Lu F, Chen JN. The PAF1 complex differentially regulates cardiomyocyte specification. Dev Biol. 2011;353:19–28. doi: 10.1016/j.ydbio.2011.02.011. [DOI] [PMC free article] [PubMed] [Google Scholar]
- Lee JT, Bartolomei MS. X-inactivation, imprinting, and long noncoding RNAs in health and disease. Cell. 2013;152:1308–1323. doi: 10.1016/j.cell.2013.02.016. [DOI] [PubMed] [Google Scholar]
- Ma P, Lin S, Bartolomei MS, Schultz RM. Metastasis tumor antigen 2 (MTA2) is involved in proper imprinted expression of H19 and Peg3 during mouse preimplantation development. Biol Reprod. 2010;83:1027–1035. doi: 10.1095/biolreprod.110.086397. [DOI] [PMC free article] [PubMed] [Google Scholar]
- Maserati M, Dai X, Walentuk M, Mager J. Identification of four genes required for mammalian blastocyst formation. Zygote. 2012:1–9. doi: 10.1017/S0967199412000561. [DOI] [PubMed] [Google Scholar]
- Maserati M, Walentuk M, Dai X, Holston O, Adams D, Mager J. Wdr74 is required for blastocyst formation in the mouse. PloS One. 2011;6:e22516. doi: 10.1371/journal.pone.0022516. [DOI] [PMC free article] [PubMed] [Google Scholar]
- Mikkelsen TS, Ku M, Jaffe DB, Issac B, Lieberman E, Giannoukos G, Alvarez P, Brockman W, Kim TK, Koche RP, Lee W, Mendenhall E, O’Donovan A, Presser A, Russ C, Xie X, Meissner A, Wernig M, Jaenisch R, Nusbaum C, Lander ES, Bernstein BE. Genome-wide maps of chromatin state in pluripotent and lineage-committed cells. Nature. 2007;448:553–560. doi: 10.1038/nature06008. [DOI] [PMC free article] [PubMed] [Google Scholar]
- Mitsui K, Tokuzawa Y, Itoh H, Segawa K, Murakami M, Takahashi K, Maruyama M, Maeda M, Yamanaka S. The homeoprotein Nanog is required for maintenance of pluripotency in mouse epiblast and ES cells. Cell. 2003;113:631–642. doi: 10.1016/s0092-8674(03)00393-3. [DOI] [PubMed] [Google Scholar]
- Morris SA, Teo RT, Li H, Robson P, Glover DM, Zernicka-Goetz M. Origin and formation of the first two distinct cell types of the inner cell mass in the mouse embryo. Proc Natl Acad Sci USA. 2010;107:6364–6369. doi: 10.1073/pnas.0915063107. [DOI] [PMC free article] [PubMed] [Google Scholar]
- Mosimann C, Hausmann G, Basler K. The role of Parafibromin/Hyrax as a nuclear Gli/Ci-interacting protein in Hedgehog target gene control. Mech Dev. 2009;126:394–405. doi: 10.1016/j.mod.2009.02.002. [DOI] [PubMed] [Google Scholar]
- Niakan KK, Ji H, Maehr R, Vokes SA, Rodolfa KT, Sherwood RI, Yamaki M, Dimos JT, Chen AE, Melton DA, McMahon AP, Eggan K. Sox17 promotes differentiation in mouse embryonic stem cells by directly regulating extraembryonic gene expression and indirectly antagonizing self-renewal. Genes Dev. 2010;24:312–326. doi: 10.1101/gad.1833510. [DOI] [PMC free article] [PubMed] [Google Scholar]
- Nichols J, Zevnik B, Anastassiadis K, Niwa H, Klewe-Nebenius D, Chambers I, Scholer H, Smith A. Formation of pluripotent stem cells in the mammalian embryo depends on the POU transcription factor Oct4. Cell. 1998;95:379–391. doi: 10.1016/s0092-8674(00)81769-9. [DOI] [PubMed] [Google Scholar]
- Niwa H, Toyooka Y, Shimosato D, Strumpf D, Takahashi K, Yagi R, Rossant J. Interaction between Oct3/4 and Cdx2 determines trophectoderm differentiation. Cell. 2005;123:917–929. doi: 10.1016/j.cell.2005.08.040. [DOI] [PubMed] [Google Scholar]
- Nordick K, Hoffman MG, Betz JL, Jaehning JA. Direct interactions between the Paf1 complex and a cleavage and polyadenylation factor are revealed by dissociation of Paf1 from RNA polymerase II. Eukaryot Cell. 2008;7:1158–1167. doi: 10.1128/EC.00434-07. [DOI] [PMC free article] [PubMed] [Google Scholar]
- Penheiter KL, Washburn TM, Porter SE, Hoffman MG, Jaehning JA. A posttranscriptional role for the yeast Paf1-RNA polymerase II complex is revealed by identification of primary targets. Mol Cell. 2005;20:213–223. doi: 10.1016/j.molcel.2005.08.023. [DOI] [PubMed] [Google Scholar]
- Reese KJ, Lin S, Verona RI, Schultz RM, Bartolomei MS. Maintenance of paternal methylation and repression of the imprinted H19 gene requires MBD3. PLoS Genet. 2007;3:e137. doi: 10.1371/journal.pgen.0030137. [DOI] [PMC free article] [PubMed] [Google Scholar]
- Russ AP, Wattler S, Colledge WH, Aparicio SA, Carlton MB, Pearce JJ, Barton SC, Surani MA, Ryan K, Nehls MC, Wilson V, Evans MJ. Eomesodermin is required for mouse trophoblast development and mesoderm formation. Nature. 2000;404:95–99. doi: 10.1038/35003601. [DOI] [PubMed] [Google Scholar]
- Solter D, Knowles BB. Immunosurgery of mouse blastocyst. Proc Natl Acad Sci USA. 1975;72:5099–5102. doi: 10.1073/pnas.72.12.5099. [DOI] [PMC free article] [PubMed] [Google Scholar]
- Strumpf D, Mao CA, Yamanaka Y, Ralston A, Chawengsaksophak K, Beck F, Rossant J. Cdx2 is required for correct cell fate specification and differentiation of trophectoderm in the mouse blastocyst. Development. 2005;132:2093–2102. doi: 10.1242/dev.01801. [DOI] [PubMed] [Google Scholar]
- Surani MA, Hayashi K, Hajkova P. Genetic and epigenetic regulators of pluripotency. Cell. 2007;128:747–762. doi: 10.1016/j.cell.2007.02.010. [DOI] [PubMed] [Google Scholar]
- Svoboda P, Stein P, Hayashi H, Schultz RM. Selective reduction of dormant maternal mRNAs in mouse oocytes by RNA interference. Development. 2000;127:4147–4156. doi: 10.1242/dev.127.19.4147. [DOI] [PubMed] [Google Scholar]
- Tanaka S, Kunath T, Hadjantonakis AK, Nagy A, Rossant J. Promotion of trophoblast stem cell proliferation by FGF4. Science. 1998;282:2072–2075. doi: 10.1126/science.282.5396.2072. [DOI] [PubMed] [Google Scholar]
- Tenney K, Gerber M, Ilvarsonn A, Schneider J, Gause M, Dorsett D, Eissenberg JC, Shilatifard A. Drosophila Rtf1 functions in histone methylation, gene expression, and Notch signaling. Proc Natl Acad Sci USA. 2006;103:11970–11974. doi: 10.1073/pnas.0603620103. [DOI] [PMC free article] [PubMed] [Google Scholar]
- Tomson BN, Arndt KM. The many roles of the conserved eukaryotic Paf1 complex in regulating transcription, histone modifications, and disease states. Biochim Biophys Acta. 2013;1829:116–126. doi: 10.1016/j.bbagrm.2012.08.011. [DOI] [PMC free article] [PubMed] [Google Scholar]
- Wang P, Bowl MR, Bender S, Peng J, Farber L, Chen J, Ali A, Zhang Z, Alberts AS, Thakker RV, Shilatifard A, Williams BO, Teh BT. Parafibromin, a component of the human PAF complex, regulates growth factors and is required for embryonic development and survival in adult mice. Mol Cell Biol. 2008;28:2930–2940. doi: 10.1128/MCB.00654-07. [DOI] [PMC free article] [PubMed] [Google Scholar]
- Wianny F, Zernicka-Goetz M. Specific interference with gene function by double-stranded RNA in early mouse development. Nat Cell Biol. 2000;2:70–75. doi: 10.1038/35000016. [DOI] [PubMed] [Google Scholar]
- Yamanaka Y, Lanner F, Rossant J. FGF signal-dependent segregation of primitive endoderm and epiblast in the mouse blastocyst. Development. 2010;137:715–724. doi: 10.1242/dev.043471. [DOI] [PubMed] [Google Scholar]
- Yang YJ, Han JW, Youn HD, Cho EJ. The tumor suppressor, parafibromin, mediates histone H3 K9 methylation for cyclin D1 repression. Nucleic Acids Res. 2010;38:382–390. doi: 10.1093/nar/gkp991. [DOI] [PMC free article] [PubMed] [Google Scholar]
- Yuan H, Corbi N, Basilico C, Dailey L. Developmental-specific activity of the FGF-4 enhancer requires the synergistic action of Sox2 and Oct-3. Genes Dev. 1995;9:2635–2645. doi: 10.1101/gad.9.21.2635. [DOI] [PubMed] [Google Scholar]
- Zhang K, Dai X, Wallingford MC, Mager J. Depletion of Suds3 reveals an essential role in early lineage specification. Dev Biol. 2013;373:359–372. doi: 10.1016/j.ydbio.2012.10.026. [DOI] [PubMed] [Google Scholar]
- Zhou J, Chehab R, Tkalcevic J, Naylor MJ, Harris J, Wilson TJ, Tsao S, Tellis I, Zavarsek S, Xu D, Lapinskas EJ, Visvader J, Lindeman GJ, Thomas R, Ormandy CJ, Hertzog PJ, Kola I, Pritchard MA. Elf5 is essential for early embryogenesis and mammary gland development during pregnancy and lactation. EMBO J. 2005;24:635–644. doi: 10.1038/sj.emboj.7600538. [DOI] [PMC free article] [PubMed] [Google Scholar]
Associated Data
This section collects any data citations, data availability statements, or supplementary materials included in this article.


