Abstract
Since the discovery of the endocannabinoids anandamide and 2-arachidonoylglycerol (2-AG) in the early 1990’s, the endocannabinoid system has been implicated in a wide array of physiological processes, such as control of food intake and energy balance, fertility and obesity. As the importance of this system becomes apparent, there is a tremendous need for robust, sensitive and efficient analytical methodology for the examination of the endocannabinoids, their congeners and putative metabolites. This review will summarize quantitative analytical methodology as reported in the literature from 1992 to present for the analysis of endocannabinoids and related compounds.
Keywords: Endocannabinoids, Mass spectrometry, 2-Arachidonoyl glycerol, Anandamide, Prostaglandin glycerol, Cyclooxygenase
1. Introduction
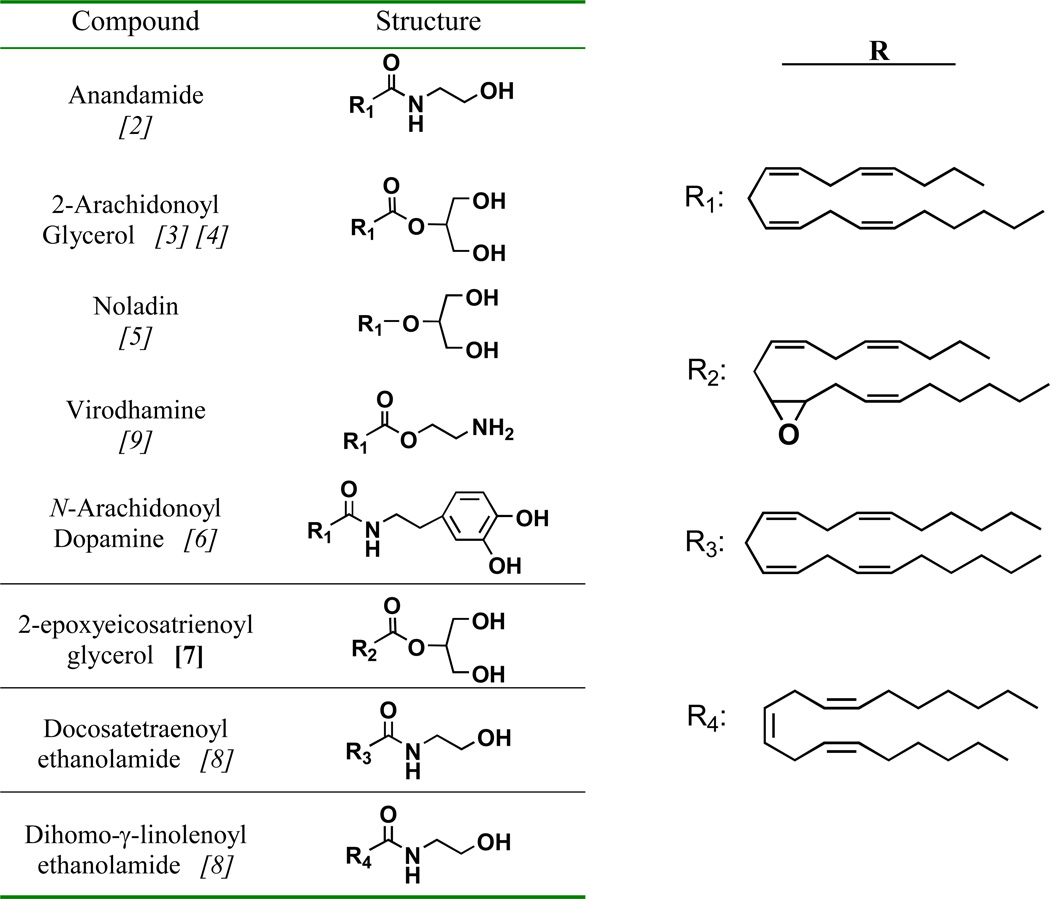
Endocannabinoids are defined as endogenously produced compounds that bind to and functionally activate the cannabinoid receptors, CB1 and CB2 [1]. Since the discovery of anandamide (AEA) in 1992 [2], approximately seven additional endogenous compounds that activate either of the CB receptors have been identified from mammalian tissues [3] [4] [5,6] [7] [8] [9]. Table 1 lists known endocannabinoids and their structures. Of these compounds, AEA and the monoacylglycerol, 2-arachidonoylglycerol (2-AG) have been the subject of the majority of scientific investigation.
Table 1.
Structure of current endocannabinoids.
References given in italics in the left-hand column.
Note: the epoxide oxygen in R2 may be between carbons 11 and 12 (shown) or between carbons 14 and 15.
Several enzymes regulate the generation and degradation of these compounds. The most well-characterized enzymes involved in endocannabinoid degradation are fatty acid amide hydrolase (FAAH), which cleaves AEA into free arachidonic acid and ethanolamine, and monoacylglycerol lipase (MAGL), which hydrolyzes monoacylglycerols (MAGs), including 2-AG, to generate free arachidonic acid and glycerol. Diacylglycerol lipase type-α (DAGL-α) has been shown to generate 2-AG from diacylglycerols, particularly 1-stearoyl, 2-arachidonoylglycerol [10] [11] while 2-AG and AEA have been shown to be substrates of oxygenating enzymes. In 1997, Yu et al. reported that AEA is a substrate for the cyclooxygenase-2 enzyme (COX-2) but not COX-1 [12]. The oxygenated products included PGH2-ethanolamide, which was shown to be isomerized by various PG synthases, resulting in a series of prostaglandin ethanolamides (PG-EAs). Later, Kozak et al. reported that 2-AG was similarly oxygenated by COX-2 (and not COX-1) and via PG synthases, gave rise to a series of prostaglandin glycerol esters (PG-Gs) [13].
The endocannabinoids given in Table 1, the enzymes discussed above (as well as putative endocannabinoid transporters), and the two characterized CB receptors comprise the endocannabinoid system. In the last decade, a significant body of evidence has developed implicating this system in a wide array of physiological processes, such as control of food intake and energy balance [14], emesis [15], fertility [16] and obesity [17]. Additionally, Nirodi et al. demonstrated that PGE2-G induces Ca2+ mobilization in RAW cells [18] and, recently, Hu et al. showed PGE2-G to have hyperalgesic properties in vivo and succeeded in recovering PGE2-G from the hindpaw of mice [19].
Endocannabinoids are often the only species within a larger class of lipid biomolecules to display activity at either CB receptor. The non-cannabimimetic members of these molecular classes, however, have been shown to effect the actions of true endocannabinoids. For example, Ben-Shabat et al. reported that in competitive binding assays in CHO cells transfected with the CB2 receptor, the Ki of 2-AG alone was 1640 nM. A mixture of 2-AG, 2-linoleoylglycerol (2-LG) and 2-palmitoylglycerol displayed a Ki of 273 nM, despite the lack of activity from 2-LG and 2-palmitoylglycerol below 20 µM [20]. The lowering of Ki values in the presence of inactive compounds – termed the “entourage effect” – was seen for 2-AG binding to CB1 as well.
Given the existence of several endocannabinoids throughout mammalian tissue and the realization that the endocannabinoid system is a highly relevant physiological pathway whose modulation may prove to be efficacious for the treatment of a wide variety of pathophysiological conditions, there is a tremendous need for robust, sensitive and efficient analytical methodology for the examination of the endocannabinoids, their congeners and putative metabolites. The whole of the signaling cascade must be taken in account if the fundamental nature of the endocannabinoid system is to be elucidated. It is the goal of this review to summarize quantitative analytical methodology as reported in the literature from 1992 to present for the analysis of endocannabinoids and related compounds.
2. Sample preparation and purification
Sample preparation for endocannabinoid analysis from tissue typically consists of homogenization of the tissue of interest in an organic solvent followed by further purification/isolation of the analytes via open-bed chromatography or solid phase extraction (SPE, also sometimes referred to as mini-columns). Purification of endocannabinoids from cell media is usually performed by SPE techniques. Despite the high degree of specificity afforded by current detection techniques, specifically liquid chromatography in-line with tandem mass spectrometry, it is desirable to subject samples to an efficient purification process prior to such analysis. This is especially so from biological matrices, where the number of endogenous lipids and low-molecular-weight compounds; all potential interferants for chromatographic and mass spectrometric analysis, is significant.
Some researchers have employed an intricate purification strategy. For example, Kirkham et al. homogenized dissected mouse hypothalamus and limbic forebrain in a solution of chloroform-methanol-Tris HCl (50 mM), 2:1:1, v/v [21]. The homogenate is centrifuged and the organic layer removed. The remaining aqueous layer is extracted two more times with chloroform and the pooled organic volumes are dried. The sample is reconstituted in chloroform-methanol, 99:1, v/v and fractionated on open-bed silica, and the 2-AG and AEA-containing fraction (CHCl3-MeOH, 9:1, v/v) is collected and dried. This sample is further purified via normal phase (NP) HPLC where the AEA- and 2-AG-containing fractions are collected and the analytes derivatized for GC-MS analysis. While thorough, such an approach is not amenable to large numbers of samples.
While many workers have used similar Folch-type extractions [22] to extract lipids from the tissue of interest, a simple SPE step is often the final purification prior to analysis. For example, Schmid et al. report the analysis of several N-acylethanolamides (NAEs) and MAGs from rodent tissue by Folch extraction followed by reconstitution in chloroform and SPE on silica cartridges. The reconstituted samples are loaded on silica SPE cartridges, washed with chloroform and eluted with a solution of chloroform-methanol, 98:2, v/v [23]. Kingsley et al. homogenized murine brain tissue in ethyl acetate [24] and purified the dried, reconstituted homogenate in the manner described by Schmid et al. [23]. This purification scheme provides a clean sample with a high percent recovery (greater than 50% for 2-AG and AEA [24]) and permits short workup times due to the high volatility of chloroform.
Alternatively, reverse-phase (RP) SPE may be used. Endocannabinoids, their congeners and COX-2 metabolites are typically retained strongly by RP modalities. This provides an opportunity to wash the loaded SPE cartridge with solvents containing a large percentage of organic solvent and still achieve high recovery of analyte. Bazinet et al. analyzed rat brain tissue for AEA by homogenization in chloroform-methanol, 2:1, v/v. The reconstituted sample is further purified by C18 SPE [25]. Likewise, Bradshaw et al. analyzed rat brain tissue for the endocannabinoids AEA, 2-AG and N-arachidonoyl dopamine as well as N-arachidonoyl glycine and N-arachidonoyl amino gamma butyric acid by homogenizing tissues of interest in a solution of acetonitrile-methanol, 1:1, v/v [26]. The homogenate is centrifuged and the supernatant diluted to achieve a ratio of aqueous-organic, 70:30, v/v. The loaded SPE cartridges are then washed with water and a solution of methanol-water, 55:45, v/v. Final analyte elution occurs with methanol. Similarly, Opitz et al. describe the purification of 2-AG and AEA from harvested cell media by dilution of the media with water and methanol to achieve a 70% aqueous proportion, which is then loaded onto a C18 SPE cartridge [27]. The sample is then purified and eluted as described by Bradshaw et al. [26].
Patel et al. described a simple preparation strategy where murine brain tissue is homogenized in acetonitrile, stored at −10°C and centrifuged to precipitate proteins [28]. The supernatant is removed, dried, reconstituted in methanol and analyzed. Finally, Wang et al. described the use of polymyxin B (PMB) resin to selectively adsorb AEA and 2-AG from biological fluids, including serum [29] [30]. The resin is introduced to the sample via PMB-immobilized beads (in suspension) and incubated for 1 hour at 4°C. The beads are pelleted by centrifugation and the analytes are eluted from the PMB beads with ethanol. Thus, investigators may prepare endocannabinoids and related compounds for analysis by a number of well-established techniques.
3. Separation and detection of endocannabinoids and related compounds
Quantitative analysis of endocannabinoids and related compounds is almost universally accomplished with chromatography-based techniques. The methodologies surveyed can be roughly divided into three categories; (1) HPLC separation of derivatized analytes with UV or fluorescence detection, (2) GC separation of analytes followed by MS detection and (3) LC separation followed by MS or tandem MS detection. The GC-MS and LC-MS techniques are the most prevalent assays in the literature.
3.1 HPLC Methods
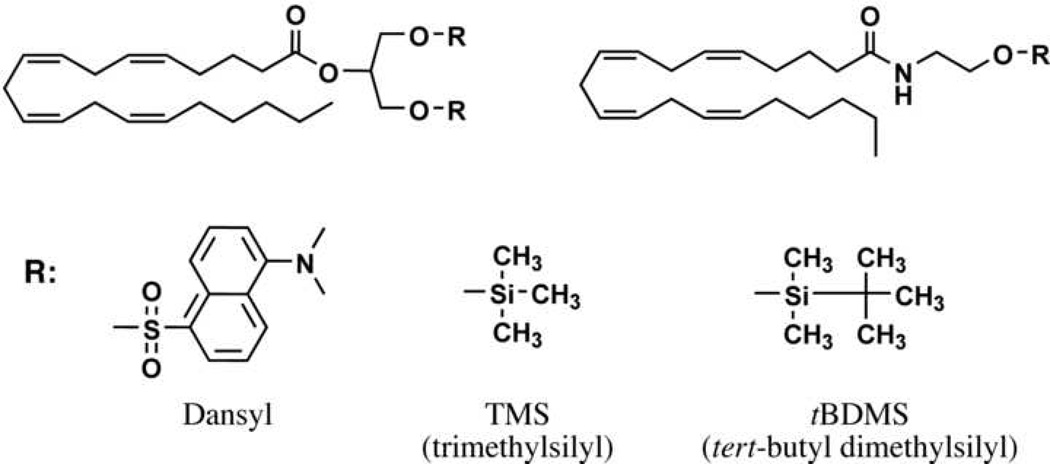
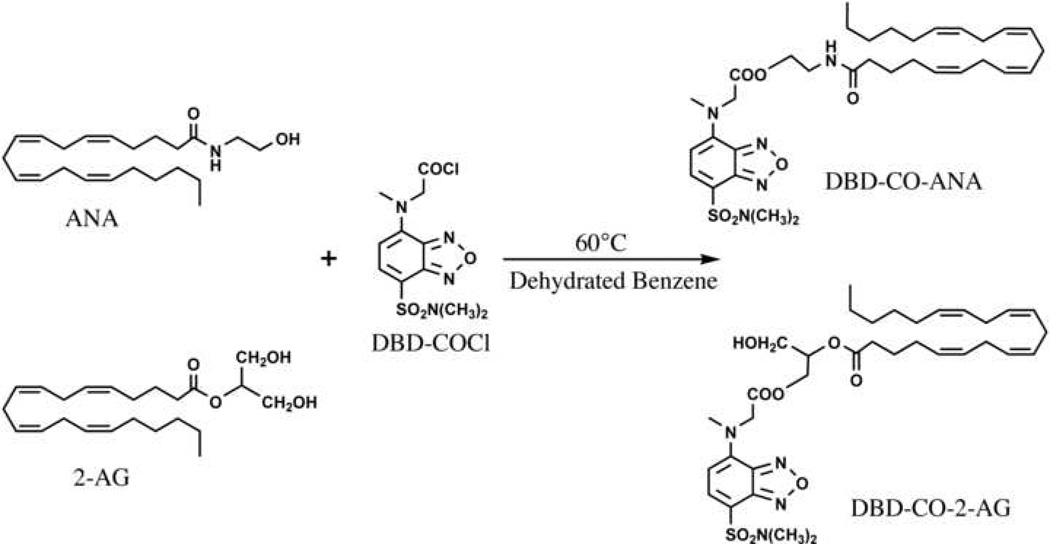
There are a number of HPLC methods reported in the literature that employ UV or fluorescence detection. Yagen et al. present a method for the analysis of AEA from cell media in which AEA is derivatized to its dansyl ester [31]. The derivatized AEA is detected by reverse-phase (RP) HPLC using an octadecylsilyl (also known as ODS or C18) column with UV detection at 255 nm. Several groups reported the preparation of 4-N-chloroformylmethyl-N-methylamino-7-N,N-dimethylaminosulfonyl-2,1,3-benzoxadiazole (DBD-COCl) derivatives of AEA or 2-AG (Figure 2) [32] [30] [33]. Wang et al. employed RP chromatography via an ODS column with fluorescence detection (excitation at 450 nm, detection at 560 nm) for both AEA and 2-AG from biological fluids [30]. Arai et al. analyzed AEA from rat brain tissue using a coupled-column HPLC system, wherein the analyte was eluted from a phenyl column onto a trapping column (ODS) and then eluted from the trapping column to a second HPLC column (ODS) column [32]. Arai et al. employed fluorescence detection as described by Wang et al. [32] [30].
Figure 2.
Structures of common derivatives for 2-AG (top left) and AEA (top right).
These LC techniques rely on commonly used derivatization schemes, do not require costly mass spectrometric instrumentation and can deliver sensitivity in the fmol on-column range. Arai et al. reported a limit of detection (LOD) for AEA of 10 fmol on-column with a signal:noise ratio of 3 [32]. Wang et al. reported LODs of 20 and 50 fmol for AEA and 2-AG, respectively [30]. Additionally, they report a high degree of linearity for standard curves of AEA and 2-AG in the range of 1 – 500 pmol/mL (r2 values of 1.000 and 1.00, respectively) and deviations from the known concentration of less than 15% for the analysis of sera samples spiked with known amounts of AEA and 2-AG [30].
The majority of reported methods for endocannabinoid analysis, however, are GC-MS or LC-MS based. These hyphenated mass spectrometric techniques display very good sensitivity, usually providing a limit of detection on the order of pmol on-column. They also provide, via the combination of identification by retention time and mass spectrometric profile, a high degree of specificity. This latter point is crucial when one is considering a few lipid species from the hundreds-to-thousands that can be found in mammalian cells and tissues.
3.2 Gas chromatography-based mass spectrometric methods
The initial discoveries that established the field of endocannabinoid research employed GC-MS techniques where the analyte was derivatized with a traditional GC agent and subjected to GC separation followed by electron ionization (EI) or chemical ionization (CI) mass spectrometric detection. Among the evidence presented by Devane et al. for the presence of AEA in porcine brain were data from GC-MS and GC-MS/MS analyses. They established that synthetic and recovered AEA exhibited identical retention times and fragmentation patterns as both the trimethylsilyl (TMS) ether and the underivatized compound [2] (Fig. 2). Similarly, Mechoulam et al. established the presence of 2-AG in canine gut by comparison of isolated and synthetic 1- and 2-AG on a GC-MS system. Again, the native compound and the TMS ether derivative were shown to be identical in terms of their chromatographic retention time and mass spectrometric fragmentation patterns when analyzed with both CI and EI [3].
Schmid et al. described a quantitative assay for NAEs (including AEA) from mammalian brain tissue [34]. They isolated and derivatized NAEs to their tert-butyl dimethylsilyl (tBDMS) ethers. Analysis is accomplished on a GC-MS system wherein selected ion monitoring (SIM) of the [M-57] ion is performed by a single quadrupole mass analyzer. Quantification occurs via stable isotope dilution against deuterated analogs of AEA, as well as palmitoyl (PEA), oleoyl (OEA) and stearoyl ethanolamide [34]. Interestingly, Schmid et al. reported that AEA is a minor component of the NAEs present in the brain tissue of several mammals. This same group later extended this methodology to MAGs, including 2-AG [23]. They described the analysis of MAGs from various rat tissues as the di-tBDMS ether derivative (Fig. 2) via SIM of the [M-57] ion on a GC-MS system.
Giuffrida et al. described an assay for AEA as well as PEA and OEA in rat plasma, detecting the TMS derivatives via GC-MS with EI [35]. The sensitivity for this assay was reported to be in the low pmol range, with AEA, PEA and OEA having LODs of 0.4, 0.1 and 0.1 pmol on-column, respectively.
3.3 Liquid chromatography-based mass spectrometric methods
Presently, LC-MS methods are the most common for endocannabinoid analysis. HPLC in the RP mode via an ODS column is the most prevalent separation technique. This is not surprising considering the lipophilic nature of endocannabinoids.
A concern regarding the LC-MS analysis of endocannabinoids is their lack, in most cases, of an ionizable moiety. 2-AG and MAGs in general are neutral compounds. AEA and other NAEs contain a nitrogen but it is traditionally considered part of the neutral amide functionality. Of the eight endocannabinoids discussed in the introduction, only virodhamine, with its terminal primary amine is a readily ionizable molecule. However, in practice, the soft ionization techniques developed to join HPLC and mass spectrometry, namely electrospray ionization (ESI) and atmospheric pressure chemical ionization (APCI) prove capable of providing sufficient ionization of endocannabinoids to deliver limits of detection in the fmol-on-column range when used with current mass spectrometers. Several ionization strategies have been reported for endocannabinoids and related compounds including protonation (formation of the [M+H]+ ion), adduction to metal cations such as sodium or silver ([M+Na/Ag]+) and coordination with the ammonium cation ([M+NH4]+).
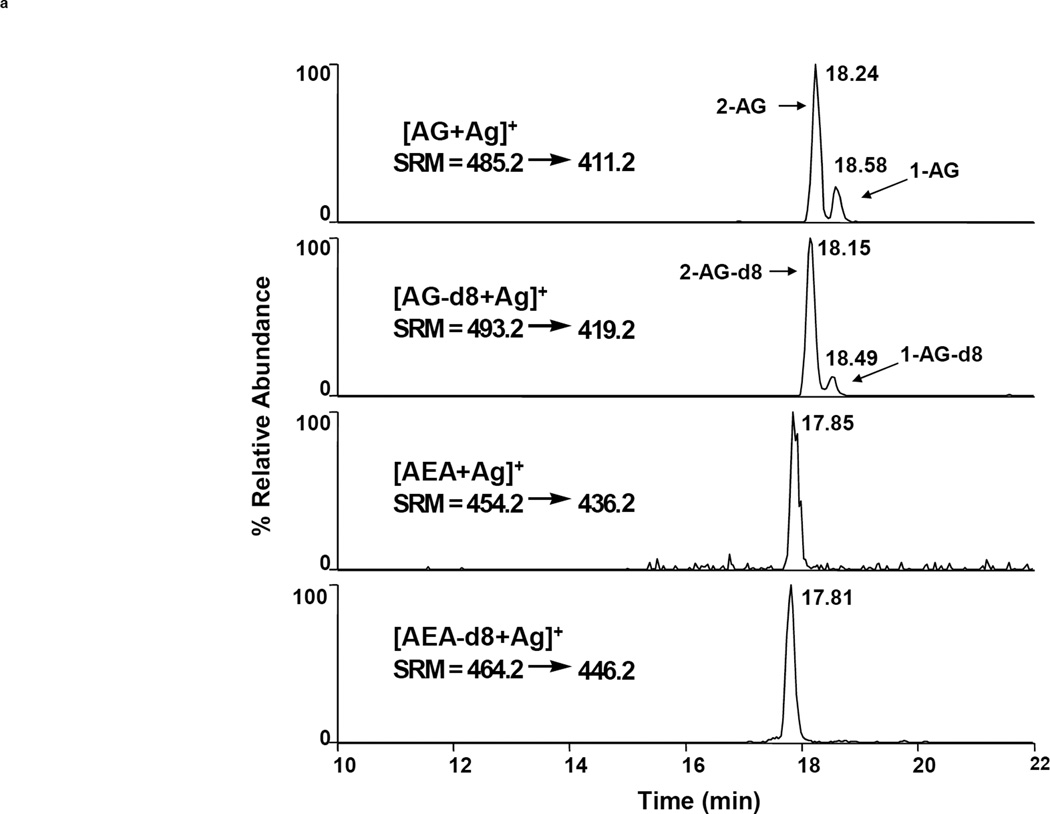
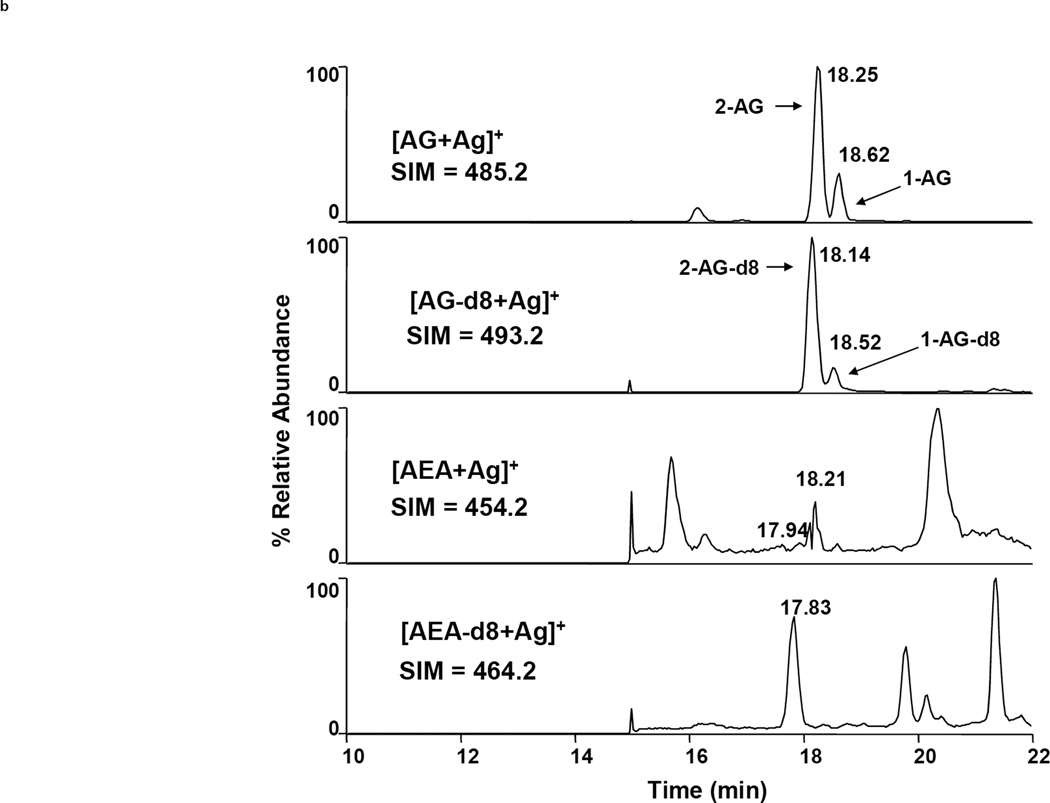
Many researchers have reported mass spectrometric quantification of chromatographed analytes via SIM. However, the tandem mass spectrometric technique ‘selected reaction monitoring’ (SRM, also referred to as ‘multiple reaction monitoring’ or MRM) is the most advantageous detection mode, resulting in a substantially lower level of background noise and correspondingly better sensitivity and specificity. Figure 3 illustrates the difference between SIM and SRM. Here, a purified sample of rodent brain tissue was injected twice onto an LC-MS system for analysis of AEA and 2-AG. The chromatograms on the left result from SRM whereas those on the right result from SIM (injection volumes, elution and ionization parameters are identical). The superior sensitivity afforded by SRM is especially evident in the AEA chromatograms, where AEA is not distinguished from noise in the SIM chromatogram but is clearly seen with a signal:noise ratio of >5 in the SRM chromatogram. The disadvantage of SRM is the requirement of a relatively expensive mass spectrometer capable of MSn analyses (such as a triple quadrupole or linear ion trap instrument), whereas SIM can be accomplished on a significantly cheaper single stage instrument.
Figure 3.
Comparison of LC-MS detection of AEA and 2-AG (as [M+Ag]+ ions) via SRM (left) and SIM (right) after extraction and purification from murine brain tissue. Chromatograms from top to bottom show AG, AG-d8, AEA and AEA-d8, respectively [24].
Di Marzo et al. analyzed 2-AG, AEA and the non-cannabimimetic congener PEA in murine brain tissue via LC-APCI-MS in SIM mode. They monitored the [M+H]+ ion for all three analytes (m/z 379, 348 and 300, respectively). 2-AG and AEA were quantified by stable isotope dilution while PEA was quantified by comparison to a non-deuterated internal standard [36]. Fezza employed similar methodology for the analysis of 2-AG, AEA and noladin from rat brain tissue. Again, the analytes were quantified by isotope dilution against deuterated analogs [37]. Fezza et al. reported an LOD for deuterated noladin of 100 fmol on-column.
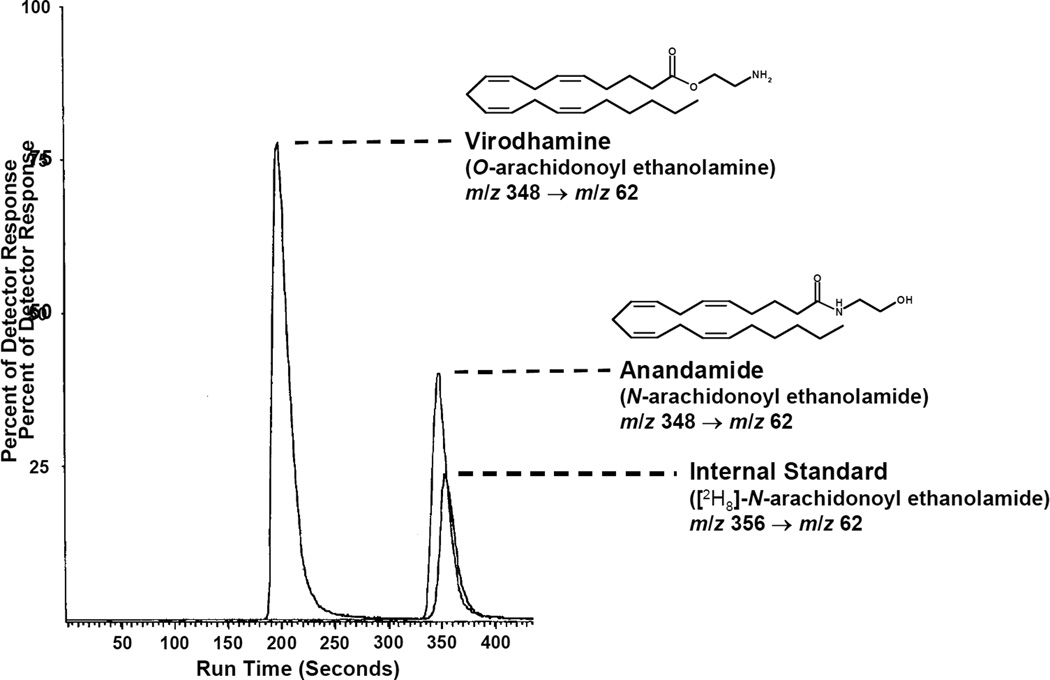
Porter et al. described the analysis of virodhamine and AEA in various rat tissues using an LC-APCI-MS/MS system (in SRM mode) [9]. They monitored the analytes via the m/z 348 → 62 transition, where the precursor (or Q1) m/z 348 corresponds to the [M+H]+ ion and the fragment (or Q3) m/z 62 represents the protonated ethanolamine cation. This m/z transition is applicable to both analytes, as they are isomeric. Mass spectral interference between the analytes is avoided as baseline chromatographic resolution is achieved (Figure 4) on a ODS column under isocratic conditions. AEA and virodhamine were quantified against deuterated AEA (m/z 352 → 62).
Figure 4.
LC-MS/MS chromatogram of virodhamine, AEA and AEA-d8 after extraction and purification from rat brain tissue [9].
Richardson et al. presented a comprehensive method for the analysis of eight endocannabinoid congeners (2-AG, AEA, noladin, virodhamine, 2-LG, arachidonoyl glycine, OEA, and PEA) from rat brain tissue via LC-ESI-MS/MS [38]. They achieved chromatographic separation using gradient elution on a HyPurity Advance column (C8 alkyl moiety tethered to silica particle via an amide linkage) and SRM was employed for all analytes. An LOD of 25 fmol on-column was reported for AEA, virodhamine, OEA, PEA and arachidonoyl glycine while an LOD of 250 fmol on-column was reported for 2-AG, noladin and 2-LG. Table 2 provides the precursor and fragment ions of all compounds discussed by Richardson as well as selected mass spectrometric parameters. Finally, Lam et al. reported an LC-ESI-MS/MS assay for AEA from human plasma utilizing ultra high pressure liquid chromatography (UPLC) [39]. The authors reported a LOD of 0.055 fmol on-column. Thus, we see that the broad class of lipids containing several endocannabinoids are amenable to analysis via ESI and APCI-LC-MSn techniques by the generation of an [M+H]+ ion.
Table 2.
Selected MS parameters for the analysis of selected endocannabinoids and congeners, as reported by Richardson et al. (referenced material includes table heading) [38].
| Analyte | Retention time (min) |
Precursor ion (m/z value) |
Product ion (m/z value) |
Cone voltage (eV) |
Collision energy (eV) |
|---|---|---|---|---|---|
| Palmitoyl ethanolamide | 6.13 | 300.26 | 62.00 | 35 | 15 |
| Heptadecanoyl ethanolamide | 7.15 | 314.47 | 62.00 | 60 | 20 |
| Oleoyl ethanolamide | 6.51 | 326.39 | 62.00 | 60 | 20 |
| Virodhamine | 1.79 | 348.33 | 62.00 | 35 | 11 |
| Anandamide | 5.43 | 348.33 | 62.00 | 35 | 11 |
| 2-Linoleoyl glycerol | 6.32 | 355.52 | 263.18 | 55 | 15 |
| Arachidonyl ethanolamide-d8 | 5.43 | 356.33 | 62.00 | 48 | 21 |
| Arachidonyl glycine | 7.85 | 362.24 | 287.11 | 50 | 15 |
| Noladin ether | 6.51 | 365.20 | 273.17 | 63 | 14 |
| 2-Arachidonyl glycerol | 6.26 | 379.24 | 287.02 | 55 | 15 |
| 2-Arachidonyl glycerol-d8 | 6.26 | 387.35 | 96.17 | 43 | 34 |
Selected precursor and product m/z values with appropriate retention times, cone and collision voltages used to identify and quantify analytes, using MRM with the LC-MS-MS method.
Metal cation coordination has also been used to ionize endocannabinoids and their oxygenated metabolites for mass spectral analysis. Kozak et al. used sodium-containing mobile phases to generate [M+Na]+ ions of prostaglandin glycerols and ethanolamides, HETE glycerols and 2-AG. Samples from rat plasma and in vitro protein incubations were analyzed underwent LC-MS and full scan mass spectral analysis [13] [40]. Once again, the chromatography was carried out in the reverse-phase mode using a ODS column. LC-MS detection was achieved via SIM of the [M+Na]+ ion and analytes were quantified by isotope dilution against deuterated analogs.
The affinity of Ag+ for π-electrons, an interaction long known in lipid chemistry, has been used as an ionization strategy by several groups. Schreiber et al. described the analysis of AEA and OEA via their [M+Ag]+ ions from human serum and plasma [41]. Kingsley et al. describe utilizing Ag+-coordination in an assay for AEA and 2-AG [24] from murine brain tissue. Both groups used ESI with SRM detection. Kingsley et al. reported LODs of 14 and 13 fmol on-column for AEA and 2-AG, respectively. Silver adduction does not extend to saturated lipids.
Finally, COX-2 oxygenation products of AEA and 2-AG may be observed in the positive ion mode by coordination with the ammonium cation (NH4+). Kingsley et al. described a method utilizing this technique for the analysis of PG-Gs and prostaglandins from cell media [42], as did Hu et al. in the first report of PGE2-G from an in vivo setting [19]. In both cases, the analytes are chromatographed on a ODS column and detected with SRM. The precursor ion is the [M+NH4]+ complex and the fragment ion is one of several masses. m/z 409 and 391 are dehydration products which result from the loss of NH3 and one or two molecules of H2O and are produced in abundance (Kingsley et al. employed m/z 444 → 391 for detection of PGE2-G and PGD2-G). Hu et al. also used these fragments as precursor ions and used m/z 91 and 79 as fragment ions to verify the presence of PGE2-G in rat tissue [19].
Generally, endocannabinoid congeners, such as OEA and various MAGs are amenable to the above-described techniques, with the noted limitations. Richardson et al. included in their method the non-cannabimimetic compounds PEA, 2-LG and arachidonoyl glycine [39]. The Marnett laboratory has analyzed the unsaturated 18-carbon MAGs (oleoyl, linoleoyl and linolenoyl glycerol) from murine brain tissue on a RP LC-MS system using ionization with Ag+ and SRM detection with the ([M+Ag]+ → [M+Ag]+ − 74) transition. The loss of 74 amu corresponds to the loss of the glycerol moiety [43].
3.4 Analyte quantification
Quantification of analytes is typically accomplished by either stable isotope dilution or with a standard curve. Stable isotope dilution, which is applicable only to mass spectrometric-based techniques, involves spiking the sample, prior to purification, with a known amount of an internal standard. This “stably labeled analog” is typically a compound chemically identical to the analyte except that it has several atoms of a stable, low-abundance isotope incorporated into the molecule. The stable isotope most commonly used is deuterium (indicated by –dn or [2Hn], where n is the number of deuterium atoms in the molecule). However a stably labeled internal standard may also contain 15N, 18O, etc. For example, 2-AG-d8, which is available commercially in high purity and is deuterated at the 5, 6, 8, 9, 11, 12, 14 and 15 carbons, is very commonly used for 2-AG analysis [38]. For analytes where a stably labeled analog is not available commercially, one may be synthesized from deuterated starting materials, as both deuterated free acids and terminal moieties (such as glycerol-d5) are commercially available. For example, PGE2-G-d5 is synthesized by condensing the penta-deuterated glycerol with PGE2 [13] and a synthetic scheme for deuterated NAEs and MAGs has been reported [23].
When a standard curve is used for quantification, the standards are usually prepared as stock solutions due to the fact that endocannabinoids are endogenous compounds. For mass spectrometric-based methods, deuterated compounds are often used as internal standards even when a standard curve is used for quantification. Quantification is achieved by comparing the response of unknown samples against the standard curve. While the standard addition technique is appropriate for this situation, it is rarely encountered in the literature, perhaps because sample mass is limited and the considerable extra material needed for standard addition cannot be spared.
4. Complicating pre-analytical factors
4.1 Acyl migration
Acyl migration in MAGs results in conversion of the 2-isomer to 1-(3)-isomer, and 2-AG is highly susceptible to this process. Numerous authors have observed 1-AG in endocannabinoid assays [44] [23]. Rouzer et al. investigated this isomerization event and reported that in RPMI culture medium, 2-AG converts to 1-AG with a half-life of 10 min and the half-life is reduced to 2.3 min when the medium contains 10% serum [45]. Additionally, Rouzer et al. reported that acyl migration of 2-AG is limited when RP SPE using water and acetonitrile is employed, possibly due to 2-AG being in an aprotic environment in which it is stable to acyl migration [45]. Di Marzo has theorized that most observed 1-AG is artifactually produced during sample purification and analysis as the arachidonate moiety is most often found at the 2-position of diacylglycerols and phosphoglycerides [46].
4.2 Post-mortem considerations
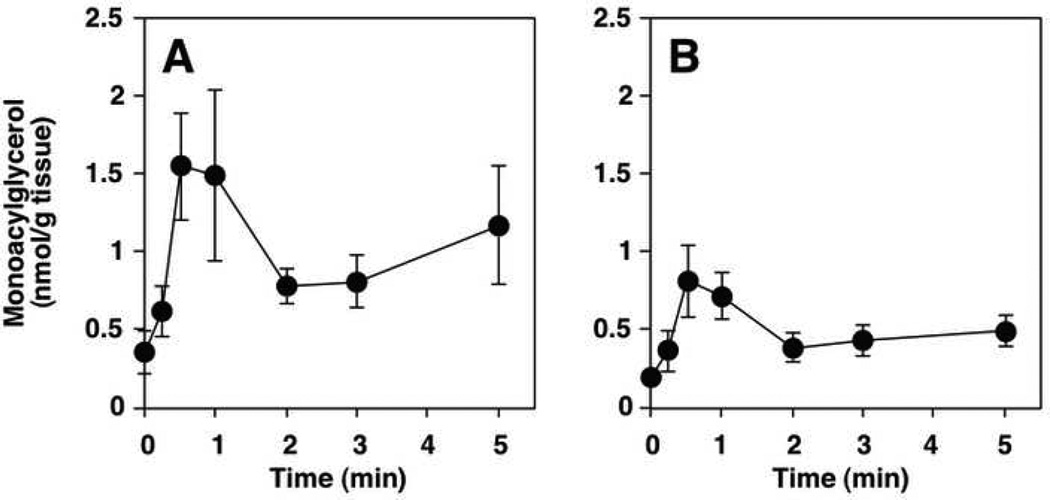
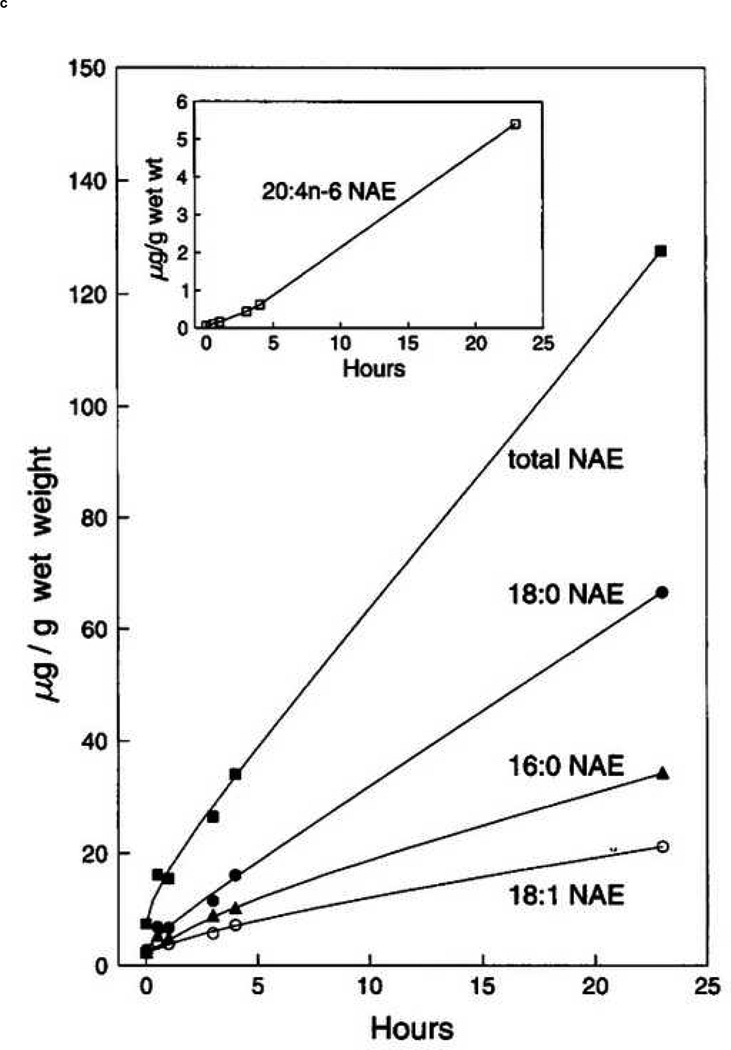
The analysis of endocannabinoids and related compounds from both in vitro and in vivo matrices is confounded by several factors. The most obvious is the possibility of post-mortem change in analyte concentrations following the sacrifice of an experimental animal. There is necessarily a delay on the order of many seconds to minutes between the time an animal has been euthanized and the time the tissue of interest is fixed (fixing typically involves flash freezing in liquid N2 or an organic/dry ice slurry). The biochemical changes that occur during this ischemic period have been known to biochemists for decades. Cenedella et al. reported that rat brain tissue allowed to remain in situ for 5 minutes following decapitation contained more than double the level of free fatty acids when compared to tissue frozen within 1 minute of sacrifice [47]. Of special interest in this report is the fact that of all fatty acids surveyed, only arachidonic acid displayed an absolute increase as well as an increase in its relative percentage of the total fatty acids surveyed. Bosisio et al. reported that PGE2 and PGF2α increased during the ischemic period following decapitation in rat brain cortex and cerebellum [48]. Only 3 years after its discovery in vivo, Schmid et al. described the postmortem rise in AEA in mammalian brain tissue [34], as did Kempe et al. [49]. Sugiura reported a similar phenomenon with 2-AG [50]. An important difference between the ischemic rise of AEA and 2-AG is that AEA, and NAEs in general, increase gradually over a period of hours whereas 2-AG increases over 50% within 2 minutes. Figure 5 shows post-mortem increases in NAEs (including AEA) and 2-AG. That other endocannabinoids and related compounds may experience similar and significant changes from the resting state as a result of brief ischemic conditions seems a reasonable assumption.
Figure 5.
Graphs showing post-mortem increases in 2- and 1-AG (top left (A) and top right (B) respectively) [50] and AEA (20:4n-6, bottom (inset)) [34] in mammalian brain tissue.
Several groups have turned to microwave irradiation to halt this ischemic rise. The efficacy of sacrificing experimental animals by cranial exposure to a brief, intense beam of microwave irradiation as a means of preventing postmortem increase in brain lipids was established in the 1970’s. Cenedella et al. showed that sacrifice by microwave exposure produced free fatty acid levels similar to those seen in rat brain tissue that was frozen within 1 minute of sacrifice, even though the microwaved sample was allowed to remain in situ for 5 minutes [47]. Anton et al. reported that PGE2 and TXB2 levels in murine brain tissue sacrificed by microwave irradiation are 5-fold lower than those observed in brain tissue from animals sacrificed by decapitation, where the time from sacrifice to sample fixation is equivalent [51]. More recently, Bazinet et al. reported that sacrifice by microwave irradiation prevents the ischemic rise in AEA levels in rat brain tissue [25]. Farias et al. and Golokov et al. showed that sacrifice by microwave irradiation prevents the ischemic rise of eicosanoid and docosanoid COX and lipoxygenase products in rodent brain tissue [52] [53]. These authors reported that the analytes of interest are stable to the heat necessarily produced by microwave exposure. The effect of microwave irradiation on concentrations of endogenous 2-AG, other endocannabinoids, congener MAGs and NAEs has not been addressed in the literature. Nor has the stability of endocannabinoids and related compounds to microwave exposure. Nonetheless, sacrifice by microwave irradiation remains a potentially useful tool for researchers interested in determining levels of endocannabinoids in in vivo settings.
4.3 Analyte hydrolysis
The hydrolysis of endocannabinoids is another potential problem. There are many enzymes that serve to cleave the amide or ester bond contained in nearly all endocannabinoids. MAG lipase and FAAH have been reasonably well-studied but non-specific esterases and amidases may also contribute to analyte loss. Kozak et al. reported the half-lives of arachidonoyl glycerol, PGE2-G and PGE2-EA when incubated at 37 °C in various bodily fluids (Table 3) [40]. There is significant interspecies variability but both PGE2-G and 2-AG display relatively short half-lives, on the order of minutes. Thus, care must be taken when analyzing endocannabinoids and related compounds from blood products. Some researchers have added inhibitors such as phenyl-methyl-sulfonyl-fluoride (PMSF, a serine hydrolase blocker and FAAH inhibitor) to whole blood immediately upon collection [54] or to tissue preparations used for Ki determinations [55].
Table 3.
Half-Lives of arachidonoylglycerol, PGE2-G and PGE2-EA in various mammalian fluids [39].
| Compound | Fluid | Half-Life |
|---|---|---|
| PGE2-G | Rat plasma | 14.4 s |
| PGE2-G | Human plasma | > 10 min |
| PGE2-G | Human whole blood | 7 min |
| 1-AG | Rat plasma | 0.8 min |
| 1-AG | Human plasma | 8 min |
| 2-AG | Rat plasma | 1.0 min |
| 2-AG | Human plasma | 16 min |
| PGE2-EA | Rat & human plasma | > 5 h |
| PGE2-G & -EA | CSF* | > 5 h |
Bovine, canine and human CSF tested.
5. Summary
As the increasing complexity and relevance of the endocannabinoid system becomes apparent, reliable and sensitive analytical techniques are crucial to the continued elucidation of this important signaling regime. State-of-the-art techniques of analytical biochemistry allow for the analysis of individual analytes at very low levels as analytical methodologies with low fmol-on-column sensitivities exist. However, given the intra-organ and even intracellular variances of proteins relevant to the endocannabinoid system, greater sensitivity is desirable as sample amounts necessary for mechanistic elucidation become ever smaller.
While traditional GC- and LC-MSn analyses can be utilized to investigate several compounds in a single analytical injection, ultimately global analytical approaches able to detect changes in the entire endocannabisome will most likely yield superior data regarding the function of the endocannabinoid system. Saghatelian and Cravatt have described such a technique – termed discovery metabolite profiling or DMP [56,57]. Briefly, the total lipid extracts of an organ of interest are generated from wild-type and enzyme-impaired animals and analyzed via LC-MS. The resulting profile is compared and differences between the experimental groups indicate the in vivo role of the enzyme in question. Saghatelian et al. [56] used this to identify N-acyl-taurines as a broad class of substrates for FAAH. It is the coupling of established bioanalytical techniques discussed in this review with novel experimental design and data collection strategies that are global in scope, such as DMP, which hold the greatest potential for gaining a more complete understanding of the complex endocannabinoid system.
Figure 1.
Scheme for the DBD-COCl derivatization of AEA and 2-AG from Wang et al. [30] (note: the abbreviation “ANA” in the figure refers to anandamide).
Acknowledgments
This research was supported by a research grant from the National Institutes of Health (GM15431).
Nomenclature
- 2-AG
2-arachidonoylglycerol
- 2-LG
2-linoleoylglycerol
- AEA
anandamide
- APCI
atmospheric pressure chemical ionization
- CB1(2)
cannabinoid receptor 1 (2)
- CI
chemical ionization
- COX
cyclooxygenase
- EI
electron ionization
- ESI
electrospray ionization
- FAAH
fatty acid amide hydrolase
- GC
gas chromatography
- HPLC
high-performance liquid chromatography
- LOD
limit of detection
- MAG
monoacylglycerol
- MS
mass spectrometry
- NAE
N-acylethanolamides
- NP
normal phase
- ODS
octadecylsilyl
- OEA
oleoyl ethanolamide
- PEA
palmitoyl ethanolamide
- PG
prostaglandin
- PG-EA
prostaglandin ethanolamide
- PG-G
prostaglandin glycerol ester
- RP
reverse-phase
- SIM
selected ion monitoring
- SPE
solid phase extraction
- SRM
selected reaction monitoring
Footnotes
Publisher's Disclaimer: This is a PDF file of an unedited manuscript that has been accepted for publication. As a service to our customers we are providing this early version of the manuscript. The manuscript will undergo copyediting, typesetting, and review of the resulting proof before it is published in its final citable form. Please note that during the production process errors may be discovered which could affect the content, and all legal disclaimers that apply to the journal pertain.
References
- 1.Bisogno T, Ligresti A, Di Marzo V. Pharmacol. Biochem. Behav. 2005;81:224. doi: 10.1016/j.pbb.2005.01.027. [DOI] [PubMed] [Google Scholar]
- 2.Devane WA, Hanus L, Breuer A, Pertwee RG, Stevenson LA, Griffin G, Gibson D, Mandelbaum A, Etinger A, Mechoulam R. Science. 1992;258:1946. doi: 10.1126/science.1470919. [DOI] [PubMed] [Google Scholar]
- 3.Mechoulam R, Ben-Shabat S, Hanus L, Ligumsky M, Kaminski NE, Schatz AR, Gopher A, Almog S, Martin BR, Compton DR, et al. Biochem. Pharmacol. 1995;50:83. doi: 10.1016/0006-2952(95)00109-d. [DOI] [PubMed] [Google Scholar]
- 4.Sugiura T, Kondo S, Sukagawa A, Nakane S, Shinoda A, Itoh K, Yamashita A, Waku K. Biochem. Biophys. Res. Commun. 1995;215:89. doi: 10.1006/bbrc.1995.2437. [DOI] [PubMed] [Google Scholar]
- 5.Hanus L, Abu-Lafi S, Fride E, Breuer A, Vogel Z, Shalev DE, Kustanovich I, Mechoulam R. Proc. Natl. Acad. Sci. U.S.A. 2001;98:3662. doi: 10.1073/pnas.061029898. [DOI] [PMC free article] [PubMed] [Google Scholar]
- 6.Bisogno T, Melck D, Bobrov M, Gretskaya NM, Bezuglov VV, De Petrocellis L, Di Marzo V. Biochem. J. 2000;351(Pt 3):817. [PMC free article] [PubMed] [Google Scholar]
- 7.Chen JK, Chen J, Imig JD, Wei S, Hachey DL, Guthi JS, Falck JR, Capdevila JH, Harris RC. J. Biol. Chem. 2008;283:24514. doi: 10.1074/jbc.M709873200. [DOI] [PMC free article] [PubMed] [Google Scholar]
- 8.Hanus L, Gopher A, Almog S, Mechoulam R. J. Med. Chem. 1993;36:3032. doi: 10.1021/jm00072a026. [DOI] [PubMed] [Google Scholar]
- 9.Porter AC, Sauer JM, Knierman MD, Becker GW, Berna MJ, Bao J, Nomikos GG, Carter P, Bymaster FP, Leese AB, Felder CC. J. Pharmacol. Exp. Ther. 2002;301:1020. doi: 10.1124/jpet.301.3.1020. [DOI] [PubMed] [Google Scholar]
- 10.Jung KM, Astarita G, Zhu C, Wallace M, Mackie K, Piomelli D. Mol. Pharmacol. 2007;72:612. doi: 10.1124/mol.107.037796. [DOI] [PubMed] [Google Scholar]
- 11.Bisogno T, Howell F, Williams G, Minassi A, Cascio MG, Ligresti A, Matias I, Schiano-Moriello A, Paul P, Williams EJ, Gangadharan U, Hobbs C, Di Marzo V, Doherty P. J. Cell Biol. 2003;163:463. doi: 10.1083/jcb.200305129. [DOI] [PMC free article] [PubMed] [Google Scholar]
- 12.Yu M, Ives D, Ramesha CS. J. Biol. Chem. 1997;272:21181. doi: 10.1074/jbc.272.34.21181. [DOI] [PubMed] [Google Scholar]
- 13.Kozak KR, Rowlinson SW, Marnett LJ. J. Biol. Chem. 2000;275:33744. doi: 10.1074/jbc.M007088200. [DOI] [PubMed] [Google Scholar]
- 14.Di Marzo V, Matias I. Nat. Neurosci. 2005;8:585. doi: 10.1038/nn1457. [DOI] [PubMed] [Google Scholar]
- 15.Van Sickle MD, Oland LD, Ho W, Hillard CJ, Mackie K, Davison JS, Sharkey KA. Gastroenterology. 2001;121:767. doi: 10.1053/gast.2001.28466. [DOI] [PubMed] [Google Scholar]
- 16.Wang H, Dey SK, Maccarrone M. Endocr. Rev. 2006;27:427. doi: 10.1210/er.2006-0006. [DOI] [PubMed] [Google Scholar]
- 17.Engeli S. J. Neuroendocrinol. 2008;20(Suppl 1):110. doi: 10.1111/j.1365-2826.2008.01683.x. [DOI] [PubMed] [Google Scholar]
- 18.Nirodi CS, Crews BC, Kozak KR, Morrow JD, Marnett LJ. Proc. Natl. Acad. Sci. U.S.A. 2004;101:1840. doi: 10.1073/pnas.0303950101. [DOI] [PMC free article] [PubMed] [Google Scholar]
- 19.Hu SS, Bradshaw HB, Chen JS, Tan B, Walker JM. Br. J. Pharmacol. 2008;153:1538. doi: 10.1038/bjp.2008.33. [DOI] [PMC free article] [PubMed] [Google Scholar]
- 20.Ben-Shabat S, Fride E, Sheskin T, Tamiri T, Rhee MH, Vogel Z, Bisogno T, De Petrocellis L, Di Marzo V, Mechoulam R. Eur. J. Pharmacol. 1998;353:23. doi: 10.1016/s0014-2999(98)00392-6. [DOI] [PubMed] [Google Scholar]
- 21.Kirkham TC, Williams CM, Fezza F, Di Marzo V. Br. J. Pharmacol. 2002;136:550. doi: 10.1038/sj.bjp.0704767. [DOI] [PMC free article] [PubMed] [Google Scholar]
- 22.Folch J, Lees M, Sloane Stanley GH. J. Biol. Chem. 1957;226:497. [PubMed] [Google Scholar]
- 23.Schmid PC, Schwartz KD, Smith CN, Krebsbach RJ, Berdyshev EV, Schmid HH. Chem. Phys. Lipids. 2000;104:185. doi: 10.1016/s0009-3084(99)00124-3. [DOI] [PubMed] [Google Scholar]
- 24.Kingsley PJ, Marnett LJ. Anal. Biochem. 2003;314:8. doi: 10.1016/s0003-2697(02)00643-7. [DOI] [PubMed] [Google Scholar]
- 25.Bazinet RP, Lee HJ, Felder CC, Porter AC, Rapoport SI, Rosenberger TA. Neurochem. Res. 2005;30:597. doi: 10.1007/s11064-005-2746-5. [DOI] [PubMed] [Google Scholar]
- 26.Bradshaw HB, Rimmerman N, Krey JF, Walker JM. Am. J. Physiol. Regul. Integr. Comp. Physiol. 2006;291:R349. doi: 10.1152/ajpregu.00933.2005. [DOI] [PubMed] [Google Scholar]
- 27.Opitz CA, Rimmerman N, Zhang Y, Mead LE, Yoder MC, Ingram DA, Walker JM, Rehman J. FEBS Lett. 2007;581:4927. doi: 10.1016/j.febslet.2007.09.032. [DOI] [PMC free article] [PubMed] [Google Scholar]
- 28.Patel S, Rademacher DJ, Hillard CJ. J. Pharmacol. Exp. Ther. 2003;306:880. doi: 10.1124/jpet.103.054270. [DOI] [PubMed] [Google Scholar]
- 29.Wang Y, Liu Y, Sarker KP, Nakashima M, Serizawa T, Kishida A, Akashi M, Nakata M, Kitajima I, Maruyama I. FEBS Lett. 2000;470:151. doi: 10.1016/s0014-5793(00)01313-2. [DOI] [PubMed] [Google Scholar]
- 30.Wang Y, Liu Y, Ito Y, Hashiguchi T, Kitajima I, Yamakuchi M, Shimizu H, Matsuo S, Imaizumi H, Maruyama I. Anal. Biochem. 2001;294:73. doi: 10.1006/abio.2001.5015. [DOI] [PubMed] [Google Scholar]
- 31.Yagen B, Burstein S. J. Chromatogr. B. 2000;740:93. doi: 10.1016/s0378-4347(00)00029-3. [DOI] [PubMed] [Google Scholar]
- 32.Arai Y, Fukushima T, Shirao M, Yang X, Imai K. Biomed. Chromatogr. 2000;14:118. doi: 10.1002/(SICI)1099-0801(200004)14:2<118::AID-BMC936>3.0.CO;2-O. [DOI] [PubMed] [Google Scholar]
- 33.Schmidt A, Brune K, Hinz B. Biomed. Chromatogr. 2006;20:336. doi: 10.1002/bmc.568. [DOI] [PubMed] [Google Scholar]
- 34.Schmid PC, Krebsbach RJ, Perry SR, Dettmer TM, Maasson JL, Schmid HH. FEBS Lett. 1995;375:117. doi: 10.1016/0014-5793(95)01194-j. [DOI] [PubMed] [Google Scholar]
- 35.Giuffrida A, Piomelli D. FEBS Lett. 1998;422:373. doi: 10.1016/s0014-5793(98)00046-5. [DOI] [PubMed] [Google Scholar]
- 36.Di Marzo V, Goparaju SK, Wang L, Liu J, Batkai S, Jarai Z, Fezza F, Miura GI, Palmiter RD, Sugiura T, Kunos G. Nature. 2001;410:822. doi: 10.1038/35071088. [DOI] [PubMed] [Google Scholar]
- 37.Fezza F, Bisogno T, Minassi A, Appendino G, Mechoulam R, Di Marzo V. FEBS Lett. 2002;513:294. doi: 10.1016/s0014-5793(02)02341-4. [DOI] [PubMed] [Google Scholar]
- 38.Richardson D, Ortori CA, Chapman V, Kendall DA, Barrett DA. Anal. Biochem. 2007;360:216. doi: 10.1016/j.ab.2006.10.039. [DOI] [PubMed] [Google Scholar]
- 39.Lam PM, Marczylo TH, El-Talatini M, Finney M, Nallendran V, Taylor AH, Konje JC. Anal. Biochem. 2008;380:195. doi: 10.1016/j.ab.2008.05.033. [DOI] [PubMed] [Google Scholar]
- 40.Kozak KR, Crews BC, Ray JL, Tai HH, Morrow JD, Marnett LJ. J. Biol. Chem. 2001;276:36993. doi: 10.1074/jbc.M105854200. [DOI] [PubMed] [Google Scholar]
- 41.Schreiber D, Harlfinger S, Nolden BM, Gerth CW, Jaehde U, Schomig E, Klosterkotter J, Giuffrida A, Astarita G, Piomelli D, Markus Leweke F. Anal. Biochem. 2007;361:162. doi: 10.1016/j.ab.2006.11.027. [DOI] [PubMed] [Google Scholar]
- 42.Kingsley PJ, Rouzer CA, Saleh S, Marnett LJ. Anal. Biochem. 2005;343:203. doi: 10.1016/j.ab.2005.05.005. [DOI] [PubMed] [Google Scholar]
- 43.Kingsley PJ, Marnett LJ. 2002 ASMS Conference. 2002 [Google Scholar]
- 44.Stella N, Schweitzer P, Piomelli D. Nature. 1997;388:773. doi: 10.1038/42015. [DOI] [PubMed] [Google Scholar]
- 45.Rouzer CA, Ghebreselasie K, Marnett LJ. Chem. Phys. Lipids. 2002;119:69. doi: 10.1016/s0009-3084(02)00068-3. [DOI] [PubMed] [Google Scholar]
- 46.Di Marzo V. Biochemistry (Mosc) 1998;63:13. [PubMed] [Google Scholar]
- 47.Cenedella RJ, Galli C, Paoletti R. Lipids. 1975;10:290. doi: 10.1007/BF02532702. [DOI] [PubMed] [Google Scholar]
- 48.Bosisio E, Galli C, Galli G, Nicosia S, Spagnuolo C, Tosi L. Prostaglandins. 1976;11:773. doi: 10.1016/0090-6980(76)90186-6. [DOI] [PubMed] [Google Scholar]
- 49.Kempe K, Hsu FF, Bohrer A, Turk J. J. Biol. Chem. 1996;271:17287. doi: 10.1074/jbc.271.29.17287. [DOI] [PubMed] [Google Scholar]
- 50.Sugiura T, Yoshinaga N, Waku K. Neurosci. Lett. 2001;297:175. doi: 10.1016/s0304-3940(00)01691-8. [DOI] [PubMed] [Google Scholar]
- 51.Anton RF, Wallis C, Randall CL. Prostaglandins. 1983;26:421. doi: 10.1016/0090-6980(83)90177-6. [DOI] [PubMed] [Google Scholar]
- 52.Farias SE, Basselin M, Chang L, Heidenreich KA, Rapoport SI, Murphy RC. J. Lipid Res. 2008;49:1990. doi: 10.1194/jlr.M800200-JLR200. [DOI] [PMC free article] [PubMed] [Google Scholar]
- 53.Golovko MY, Murphy EJ. J. Lipid Res. 2008;49:893. doi: 10.1194/jlr.D700030-JLR200. [DOI] [PubMed] [Google Scholar]
- 54.De Marchi N, De Petrocellis L, Orlando P, Daniele F, Fezza F, Di Marzo V. Lipids Health Dis. 2003;2:5. doi: 10.1186/1476-511X-2-5. [DOI] [PMC free article] [PubMed] [Google Scholar]
- 55.Lin S, Khanolkar AD, Fan P, Goutopoulos A, Qin C, Papahadjis D, Makriyannis A. J. Med. Chem. 1998;41:5353. doi: 10.1021/jm970257g. [DOI] [PubMed] [Google Scholar]
- 56.Saghatelian A, Trauger SA, Want EJ, Hawkins EG, Siuzdak G, Cravatt BF. Biochemistry. 2004;43:14332. doi: 10.1021/bi0480335. [DOI] [PubMed] [Google Scholar]
- 57.Saghatelian A, Cravatt BF. Life Sci. 2005;77:1759. doi: 10.1016/j.lfs.2005.05.019. [DOI] [PubMed] [Google Scholar]


