

Abstract
Purpose
Macular pigment, composed of lutein, zeaxanthin, and meso-zeaxanthin, is postulated to protect against age-related macular degeneration (AMD), likely due to filtering blue light and its antioxidant properties. Macular pigment optical density (MPOD) is reported to be associated with macular function evaluated by visual acuity and multifocal electroretinogram. Given the importance of macular pigment, reliable and accurate measurement methods are important. The main purpose of current study is to determine the reproducibility of MPOD measurement by two-wave length auto-fluorescence method using scanning laser ophthalmoscopy.
Methods
Sixty eight eyes of 39 persons were enrolled in the study, including 11 normal eyes, 16 eyes with wet AMD, 16 eyes with dry AMD, 11 eyes with macular edema due to diabetic mellitus, branch retinal vein occlusion or macular telangiectasia and 14 eyes with tractional maculopathy including vitreomacular traction, epiretinal membrane or macular hole. MPOD was measured with a two-wavelength (488 and 514 nm) auto-fluorescence method with the Spectralis HRA+OCT after pupil dilation. The measurement was repeated for each eye 10 minutes later. The Analysis of variance (ANOVA) and Bland-Altman plot were used to assess the reproducibility between the two measurements.
Results
The mean MPOD at eccentricities of 1° and 2° was 0.36±0.17 (range: 0.04–0.69) and 0.15±0.08(range: −0.03, 0.35) for the first measurement and 0.35±0.17 (range: 0.02, 0.68) and 0.15±0.08 (range: −0.01, 0.33) for the second measurement respectively. The difference between the two measurements was not statistically significant, and the Bland-Altman plot showed 7.4% and 5.9% points outside the 95% limits of agreement, indicating an overall excellent reproducibility. Similarly, there is no significant difference between the first and second measurements of MPOD volume within eccentricities of 1°, 2° and 6° radius, and the Bland-Altman plot showed 8.8%, 2.9% and 4.4% points outside the 95% limits of agreement respectively. The data for the reproducibility did not differ significantly among the various disease and normal eyes.
Conclusion
Under routine examination conditions with pupil dilation, MPOD measurement by two-wave length auto-fluorescence method showed a high reproducibility.
Keywords: Macular pigment optical density, Age-related macular degeneration, auto fluorescence, vitamins supplementation
Macular pigment, composed of lutein, zeaxanthin, and meso-zeaxanthin, has been shown to enhance visual function in normal subjects, and is postulated to protect against age-related macular degeneration (AMD), which is the leading cause of blindness in economically developed countries, likely through filtering blue light and its antioxidant properties1–5. Several reports show that the macular pigment level is associated with macular function evaluated by visual acuity, contrast sensitivity and multifocal electroretinogram6–8. Given the importance of macular pigment, it is clearly needed to measure it reliably and accurately in clinical practice.
A variety of methods have been used to measure macular pigment levels in clinical or research settings, which can be classified into subjective psychophysical techniques or objective optical techniques9–10. The subjective psychophysical techniques available include color matching motion photometry and heterochromatic flicker photometry (HFP). Among them, HFP is well known and widely used, for which there are instruments commercially available. However, previous studies showed that commercially available heterochromatic flicker photometers for macular pigment optical density assessment in clinical settings demonstrated poor coefficients of repeatability, which limit their application in clinical practice9. Optical techniques currently used for measuring MP include resonance Raman spectroscopy, fundus reflectance, and fundus auto-fluorescence. Dual wavelength auto fluorescencemethod has shown a concordance with HFP11,12. Recently, this technique for measurement of MPOD has been incorporated into Spectralis HRA+OCT (Heideberg Engineer, Heideberg, Germany), a common clinically used instruments. There is a paucity of data on reproducibility of MPOD measurement by dual wavelength auto-fluorescence (AF) with Spectralis HRA+OCT. It is the main purpose of current study to determine the repeatability of MPOD measurement by dual wavelength auto-fluorescence with Spectralis HRA+OCT in a clinical setting.
Methods
The study was approved by the Institute Review Board of University of California San Diego and was conducted in accordance with the tenets of the Declaration of Helsinki. Written informed consent was obtained. Thirty-nine consecutive patients referred to Jacobs retina center, Shiley Eye Institute, University of California San Diego during October to December were examined. Those with severe cataract or poor fixation due to severe macular lesion were excluded. Pupils of all the participants were dilated with 2.5% phenylephrine and 0.5% tropicamide to ≥6 mm in diameter. MPOD was measured with a two-wavelength (488 and 514 nm) autofluorescence method with Spectralis HRA+OCT after pupil dilation as part of clinically indicated Scanning Laser Ophthalmoscopy imaging for disease or to rule out retinal pathology. During imaging, the subject was asked to put his/her chin on chin rest and forehead against an upper bar to keep their head still, and he/she was instructed to fixate on an internal fixation target. Initial camera alignment, illumination and focus were done in infrared (IR) mode. Once the image was evenly illuminated and in good focus, the camera mode was switched to simultaneous blue AF and green AF imaging (BAF + GAF) mode for MPOD measurement. An additional adjustment to illumination and focus was performed to ensure optimal image quality, and then a 30 second video was recorded. Subsequently, a raster optical coherence tomography (OCT) scanning centered on the foveola and covering 30°×30° posterior pole was performed for clinical purpose. The measurement of MPOD was repeated for each eye after 10 minutes.
To simulate a second day measurement, we measured the right eye first then left eye as part of the first session. The patient also had other imaging performed as clinically indicated and was allowed to rest, move and walk to another area as needed. The second measurements were then performed. Both the focus and alignment were changed between the two measurements due to the refraction difference of the right and left eye and in between sessions. The two measurements were done by the same operator.
Heidelberg Eye Explorer software (HEYEX, version 1.7.1.0) was used to align and average the images in the videos, and an MP density map is created. Due to the variation in ocular transmission between people it is not possible to calculate an absolute calibration value for MPOD. Therefore, we have used the region of the macula known to be free of macular pigment as in-image normal control. All MPOD values are relationship to this normal control value. For analysis, the plateau (equivalent to the reference point) was set to 6-degree eccentricity automatically. The average MPOD at 1 and 2 degree radii and sum of MPOD volume corresponding to the eccentricities of 1-, 2- and 6-degree radii were recorded (Fig.1). Statistical analyses were conducted using SAS software version 9.4 (SAS Institutes, Cary, North Carolina, USA). The ANOVA and Bland-Altman plot were used to assess the reproducibility between the two measurements. P-values represent results for 2-sided tests, with values less than 0.05 considered statistically significant.
Figure 1.
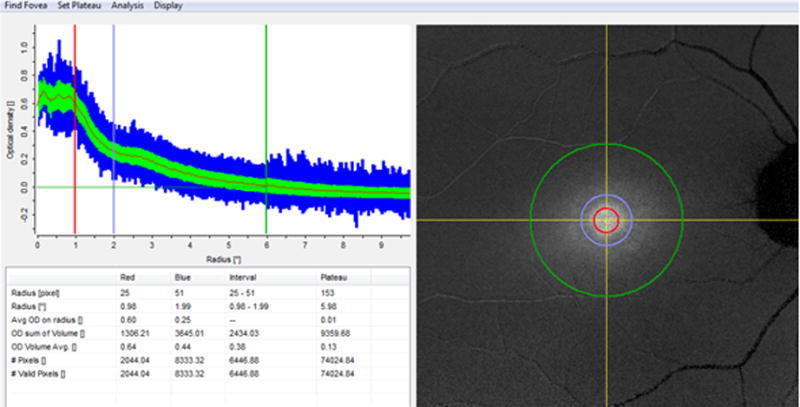
A snap shot of the macular pigment optical density analyzed by Heidelberg Eye Explorer software.The red, purple and green circle is corresponding to the eccentricities of 1-, 2- and 6-degree radii.
Results
Sixty eight eyes of 39 persons were enrolled in the study, including 11 normal eyes, 16 eyes with wet AMD, 16 eyes with dry AMD, 11 eyes with macular edema due to diabetic mellitus, branch retinal vein occlusion or macular telangiectasia and 14 eyes with tractional maculopathy including vitreomacular traction and epiretinal membrane. Control normal eyes recruited eyes without previous disease history and with best corrected visual acuity ≥ 20/20, intraocular pressure ≥ 10 mmHg and ≤ 21 mmHg, without any abnormality found on dilated fundus examination and OCT scanning. The mean age of the participants was 71.9±13.4 years (range: 34–99 years), and 57% of them were men. The demographic characteristics of the participants stratified by clinical diagnosis were summarized in table 1.
Table 1.
The demographic characteristics of study participants.
| Macular diseases | n | age | gender |
|---|---|---|---|
| mean± SD (range) |
male/female | ||
| Within normal limit | 11 | 63.4±14.9 (34–77) | 5/6 |
| Wet AMD | 16 | 83.3±9.2 (72–99) | 10/6 |
| Dry AMD | 16 | 75.6±10.7 (54–89) | 7/9 |
| Macular edema due to retinal vessel diseases | 11 | 62.8±13.0 (50–82) | 9/2 |
| Tractional maculopathy | 14 | 68.4±8.4 (54–81) | 8/6 |
| Combined | 68 | 71.9±13.4 (34–99) | 39/29 |
The mean MPOD at eccentricities of 1° and 2° radius was 0.36±0.17 (range: 0.04–0.69) and 0.15±0.08(range: −0.03, 0.35)for the first measurement and 0.35±0.17 (range: 0.02, 0.68), 0.15±0.08 (range: −0.01, 0.33) for second measurement respectively. The mean difference between the two measurements was −0.01 and 0.00 for the two eccentricities respectively. The difference between the first and second measurement was not statistically significant (P=0.81 and 0.26 respectively), and the Bland-Altman plot showed 7.4% and 5.9% points outside the 95% limits of agreement. (Table 2)
Table 2.
The reproducibility of MPOD measurements stratified by clinical diagnosis.
| N | the first measurement | the second measurement | mean difference of first and second measurement | P value | ||||||||
|---|---|---|---|---|---|---|---|---|---|---|---|---|
| Mean | standard deviation | minimum | maximum | Mean | standard deviation | minimum | maximum | |||||
| MPOD average at 1 degree radius eccentricity | normal | 11 | 0.42 | 0.14 | 0.22 | 0.67 | 0.41 | 0.15 | 0.18 | 0.66 | −0.01 | 0.29 |
| wet AMD | 16 | 0.42 | 0.19 | 0.07 | 0.68 | 0.41 | 0.18 | 0.05 | 0.63 | −0.01 | 0.28 | |
| dry AMD | 16 | 0.41 | 0.14 | 0.19 | 0.68 | 0.40 | 0.14 | 0.19 | 0.65 | −0.01 | 0.06 | |
| ME | 11 | 0.30 | 0.10 | 0.17 | 0.44 | 0.30 | 0.11 | 0.15 | 0.44 | 0.00 | 0.91 | |
| TM | 14 | 0.25 | 0.19 | 0.04 | 0.69 | 0.24 | 0.19 | 0.02 | 0.68 | 0.00 | 0.19 | |
| combined | 68 | 0.36 | 0.17 | 0.04 | 0.69 | 0.35 | 0.17 | 0.02 | 0.68 | −0.01 | 0.81 | |
| MPOD average at 2 degree radius eccentricity | normal | 11 | 0.17 | 0.08 | 0.06 | 0.26 | 0.16 | 0.08 | 0.06 | 0.25 | −0.01 | 0.11 |
| wet AMD | 16 | 0.17 | 0.11 | −0.03 | 0.35 | 0.17 | 0.10 | −0.01 | 0.33 | 0.00 | 0.38 | |
| dry AMD | 16 | 0.15 | 0.08 | 0.01 | 0.34 | 0.15 | 0.08 | 0.02 | 0.32 | 0.00 | 0.38 | |
| ME | 11 | 0.16 | 0.07 | 0.07 | 0.29 | 0.15 | 0.07 | 0.06 | 0.29 | 0.00 | 0.71 | |
| TM | 14 | 0.11 | 0.06 | 0.00 | 0.25 | 0.10 | 0.07 | 0.00 | 0.26 | −0.01 | 0.04 | |
| combined | 68 | 0.15 | 0.08 | −0.03 | 0.35 | 0.15 | 0.08 | −0.01 | 0.33 | 0.00 | 0.27 | |
ME: macular edema due to retinal vascular diseases. TM: tractional maculopathy.
Similarly, the difference between the two measurements of sum of MPOD volume within eccentricities of 1°,2° and 6° radius was not statistically significant (P=0.50, 0.43 and 0.62 respectively), and the Bland-Altman plot showed 8.8%, 2.9% and 4.4% points outside the 95% limits of agreement, indicating an overall excellent reproducibility (Fig.2–4).
Figure 2.
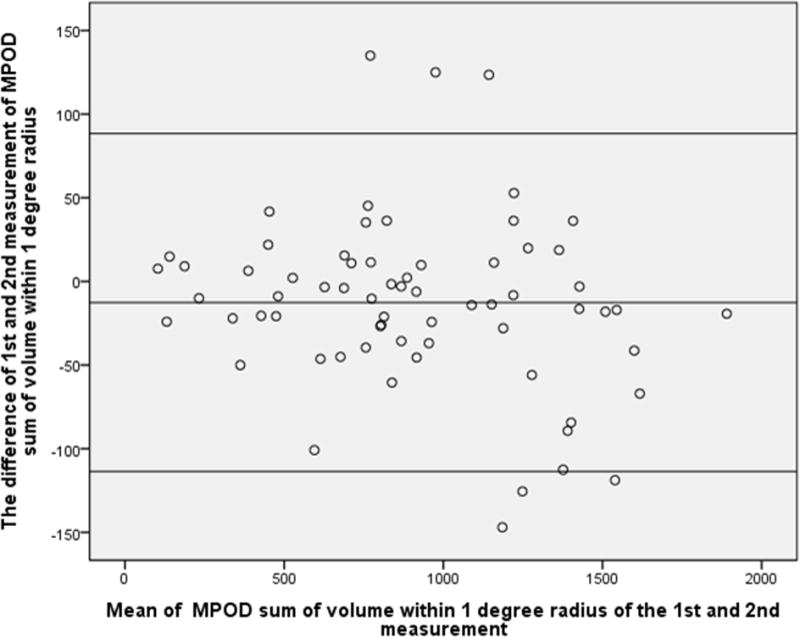
Bland-Altman plot of MPOD within 1-degree radius of the 1st and 2nd measurement. X-axial defined as mean of the MPOD volume sum of the 1st and 2nd measurement. Y-axial defined as the MPOD value of the first measurement minus the value of second measurement. The mean differences and the 95% confidence limits of the bias are shown as three lines.
Figure 4.
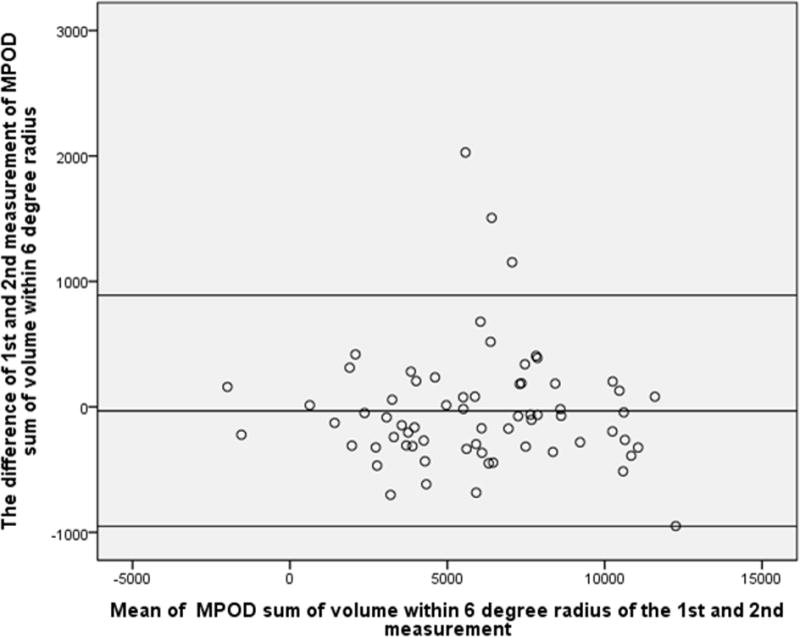
Bland-Altman plot of MPOD within 6-degree radius of the 1st and 2nd measurement. X-axial defined as mean of the MPOD volume sum of the 1st and 2nd measurement. Y-axial defined as the MPOD value of the first measurement minus the value of second measurement. The mean differences and the 95% confidence limits of the bias are shown as three lines.
The data for the reproducibility did not differ significantly among the various disease and normal eyes. (Table 2)
Discussion
Macular pigments play an important role in protecting the retina via filtering blue light and against oxidative stress13. It was reported that higher levels of macular pigments were associated with lower risk of AMD14,15. The retina itself cannot synthesize macular pigments, and supplementation of lutein and zeaxanthin is the only method to increase the macular pigment level16. It has been reported that reduced intake of lutein or zeaxanthin might be associated with an increased risk of AMD5,17,18. The Age-related Eye Disease Study (AREDS) group reported that dietary lutein/ zeaxanthin intake was inversely associated with the incidence of neovascular AMD; the incidence was lower in the high-carotenoid intake group than in the low-carotenoid intake group.19 Furthermore, the AREDS 2 study has discovered that micronutrient supplementation with lutein/zeaxathin together with multivitamins and zinc can suppress the rate of AMD progression20. Given the importance of macular pigment, in recent years, the interest in measuring MPOD has increased. To better evaluate the supplementation effect, an objective, simple, and reliable method is needed to evaluate macular pigment levels in clinical practice. Several methods have been proposed for measuring MPOD. However, to date, there is no clear gold standard method for measuring MPOD9,10. A key issue for the clinical applicability of any method is its repeatability. The finding reported herein showed in a clinical setting, under routine imaging examination conditions with pupil dilation, MPOD measurement by two-wave length auto-fluorescence method had a high reproducibility, both for normal eyes and for eyes with macular diseases. Although the accuracy of the measurement is yet to be determined, the high reproducibility suggested that this objective and simple method could be reliable in monitoring macular pigment levels in clinical practice. In terms accuracy, the only definite accurate way to measure macular pigment level is to be measured chemically in vitro, which is not clinically relevant.
Previous studies on young healthy subjects with normal eyes showed MPOD measurement by dual-wavelength auto-fluorescence had an overall good intra-session and inter-session repeatability21,22. And several studies have shown good agreement between dual-wave length auto-fluorescence technique andpsychophysical techniques such as heterochromatic flickerphotometry12 and motion photometry23. Very recently the dual-wavelength module for measuring MPOD was integrated into the Heidelberg Spectralis HRA+OCT (Heidelberg Engineering, Heidelberg, Germany), but few studies have evaluated this new device. It has been used in evaluating MPOD in early AMD24 and macular telangiectasia type 225,26. Our study evaluating this new device confirmed previously reported good repeatability of the method. Furthermore, our study showed that high repeatability is not only true for young healthy normal eyes, but also for eyes with macular diseases such as AMD in old age patients. The high repeatability of MPOD measurement by dual-wavelength auto-fluorescence found in diseased retina is clinically much more relevant than that for young healthy eyes.
Limitations of current study should be mentioned. Firstly, we didn’t validate the accuracy of the MPOD measurement by dual-wavelength auto-fluorescence. However, due to the lack of an in vivo gold standard method, any validation of accuracy of measuring MPOD by any method will be indefinite. Second, we did not perform any serum carotenoid measurements to assess the relation between serum carotenoids and macular pigment measurement. However, the purpose was not to evaluate the relation between MPOD and serum carotenoid, but rather to determine the reliability of the method. The strength of the current study is that we showed an excellent repeatability of MPOD measurement with a recently available module in a widely used device in an actual clinical setting on population of older patients with macular diseases.
In conclusion, under routine examination conditions with pupil dilation, MPOD measurement by two-wave length auto-fluorescence method showed a high reproducibility in a clinical setting.
Figure 3.
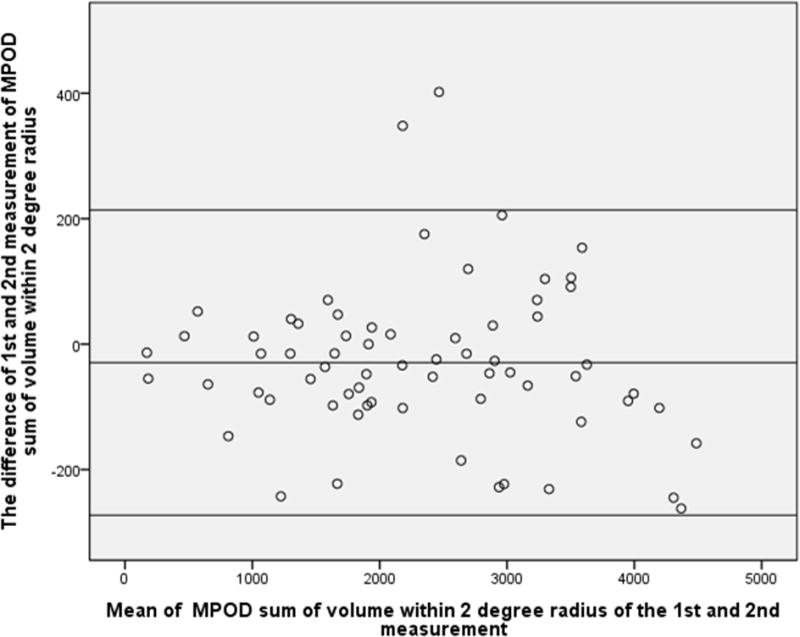
Bland-Altman plot of MPOD within 2-degree radius of the 1st and 2nd measurement. X-axial defined as mean of the MPOD volume sum of the 1st and 2nd measurement. Y-axial defined as the MPOD value of the first measurement minus the value of second measurement. The mean differences and the 95% confidence limits of the bias are shown as three lines.
Acknowledgments
Supported in part by UCSD Vision Research Center Core Grant P30EY022589, NIH grant EY016323 (DUB), an unrestricted grant from Research to Prevent Blindness, NY (WRF) andICO-Retina Research Foundation Helmerich Fellowship and National Natural Science Foundation of China (No. 81400422) (QSY)
References
- 1.Loane E, Kelliher C, Beatty S, Nolan JM. The rationale and evidence base for a protective role of macular pigment in age-related maculopathy. Br J Ophthalmol. 2008;92:1163–1168. doi: 10.1136/bjo.2007.135566. [DOI] [PubMed] [Google Scholar]
- 2.Weigert G, Kaya S, Pemp B, et al. Effects of lutein supplementation on macular pigment optical density and visual acuity in patients with age-related macular degeneration. Invest Ophthalmol Vis Sci. 2011;52:8174–8178. doi: 10.1167/iovs.11-7522. [DOI] [PubMed] [Google Scholar]
- 3.Ma L, Yan SF, Huang YM, Lu XR, Qian F, Pang HL, Xu XR, Zou ZY, Dong PC, Xiao X, Wang X, Sun TT, Dou HL, Lin XM. Effect of lutein and zeaxanthin on macular pigment and visual function in patients with early age-related macular degeneration. Ophthalmology. 2012;119:2290–2297. doi: 10.1016/j.ophtha.2012.06.014. [DOI] [PubMed] [Google Scholar]
- 4.Dawczynski J, Jentsch S, Schweitzer D, Hammer M, Lang GE, Strobel J. Long term effects of lutein, zeaxanthin and omega-3-LCPUFAs supplementation on optical density of macular pigment in AMD patients: the LUTEGA study. Graefes Arch Clin Exp Ophthalmol. 2013;251:2711–2723. doi: 10.1007/s00417-013-2376-6. [DOI] [PubMed] [Google Scholar]
- 5.Liu R, Wang T, Zhang B, Qin L, Wu C, Li Q, Ma L. Lutein and Zeaxanthin Supplementation and Association with Visual Function in Age-related Macular Degeneration: a Meta-Analysis. Invest Ophthalmol Vis Sci. 2014 Dec 16;:ii. doi: 10.1167/iovs.14-15553. IOVS-14-15553. [DOI] [PubMed] [Google Scholar]
- 6.Lien EL, Hammond BR. Nutritional influences on visual development and function. Prog Retin Eye Res. 2011;30:188–203. doi: 10.1016/j.preteyeres.2011.01.001. [DOI] [PubMed] [Google Scholar]
- 7.Puell MC, Palomo-Alvarez C, Barrio AR, Goómez-Sanz FJ, Peérez-Carrasco MJ. Relationship between macular pigment and visual acuity in eyes with early age-related macular degeneration. Acta Ophthalmol. 2013;91:e298–e303. doi: 10.1111/aos.12067. [DOI] [PubMed] [Google Scholar]
- 8.Sabour-Pickett S, Beatty S, Connolly E, Loughman J, Stack J, Howard A, Klein R, Klein BE, Meuer SM, Myers CE, Akuffo KO, Nolan JM. Supplementation with three different macular carotenoid formulations in patients with early age-related macular degeneration. Retina. 2014 Sep;34(9):1757–66. doi: 10.1097/IAE.0000000000000174. [DOI] [PubMed] [Google Scholar]
- 9.Bartlett H, Howells O, Eperjesi F. The role of macular pigment assessment in clinical practice: a review. Clin Exp Optom. 2010 Sep;93(5):300–8. doi: 10.1111/j.1444-0938.2010.00499.x. Epub 2010 Jul 14 Review. [DOI] [PubMed] [Google Scholar]
- 10.Howells O, Eperjesi F, Bartlett H. Measuring macular pigment optical density in vivo: a review of techniques. Graefes Arch Clin Exp Ophthalmol. 2011 Mar;249(3):315–47. doi: 10.1007/s00417-010-1577-5. [DOI] [PubMed] [Google Scholar]
- 11.Delori FC. Autofluorescence method to measure macular pigment optical densities fluorometry and autofluorescence imaging. Arch Biochem Biophys. 2004 Oct 15;430(2):156–62. doi: 10.1016/j.abb.2004.05.016. [DOI] [PubMed] [Google Scholar]
- 12.Dennison JL1, Stack J, Beatty S, Nolan JM. Concordance of macular pigment measurements obtained using customized heterochromatic flicker photometry, dual-wavelength autofluorescence, and single-wavelength reflectance. Exp Eye Res. 2013 Nov;116:190–8. doi: 10.1016/j.exer.2013.08.014. [DOI] [PubMed] [Google Scholar]
- 13.Kijlstra A, Tian Y, Kelly ER, Berendschot TT. Lutein: more thanjust a filter for blue light. Prog Retin Eye Res. 2012;31:303–315. doi: 10.1016/j.preteyeres.2012.03.002. [DOI] [PubMed] [Google Scholar]
- 14.Beatty S, Murray IJ, Henson DB, Carden D, Koh H, Boulton ME. Macular pigment and risk for age-related macular degenerationin subjects from a Northern European population. Invest Ophthalmol Vis Sci. 2001;42:439–446. [PubMed] [Google Scholar]
- 15.Bone RA, Landrum JT, Mayne ST, Gomez CM, Tibor SE, Twaroska EE. Macular pigment in donor eyes with and without AMD: a case-control study. Invest Ophthalmol Vis Sci. 2001;42:235–240. [PubMed] [Google Scholar]
- 16.Olmedilla-Alonso B, Beltrán-de-Miguel B, Estévez-Santiago R, Cuadrado-Vives C. Markers of lutein and zeaxanthin status in two age groups of men and women: dietary intake, serum concentrations, lipid profile and macular pigment optical density. Nutr J. 2014 Jun 3;13:52. doi: 10.1186/1475-2891-13-52. [DOI] [PMC free article] [PubMed] [Google Scholar]
- 17.SanGiovanni JP, Chew EY, Clemons TE, et al. Age-Related Eye Disease Study Research Group The relationship of dietary carotenoid and vitamin A, E, and C intake with age-related macular degeneration in a case-control study: AREDS report no. 22. Arch Ophthalmol. 2007;125(9):1225–1232. doi: 10.1001/archopht.125.9.1225. [DOI] [PubMed] [Google Scholar]
- 18.Huang YM, Dou HL, Huang FF, Xu XR, Zou ZY, Lu XR, Lin XM. Changes following supplementation with lutein and zeaxanthin in retinal function in eyes with early age-related macular degeneration: a randomised, double-blind, placebo-controlled trial. Br J Ophthalmol. 2014 Sep 16; doi: 10.1136/bjophthalmol-2014-305503. [Epub ahead of print] [DOI] [PubMed] [Google Scholar]
- 19.Age-Related Eye Disease Study Research Group1. SanGiovanni JP, Chew EY, Clemons TE, Ferris FL, 3rd, Gensler G, Lindblad AS, Milton RC, Seddon JM, Sperduto RD. The relationship of dietary carotenoid and vitamin A, E, and C intake with age-related macular degeneration in a case-control study: AREDS Report No. 22. Arch Ophthalmol. 2007 Sep;125(9):1225–32. doi: 10.1001/archopht.125.9.1225. [DOI] [PubMed] [Google Scholar]
- 20.Age-Related Eye Disease Study 2 Research Group. Lutein + zeaxanthin and omega-3 fatty acids for age-related macular degeneration: the Age-Related Eye Disease Study 2 (AREDS2) randomized clinical trial. JAMA. 2013 May 15;309(19):2005–15. doi: 10.1001/jama.2013.4997. [DOI] [PubMed] [Google Scholar]
- 21.Trieschmann M, Heimes B, Hense HW, Pauleikhoff D. Macular pigment optical density measurement in autofluorescence imaging: comparison of one- and two-wavelength methods. Graefes Arch Clin Exp Ophthalmol. 2006 Dec;244(12):1565–74. doi: 10.1007/s00417-006-0289-3. [DOI] [PubMed] [Google Scholar]
- 22.Creuzot-Garcher C, Koehrer P, Picot C, Aho S, Bron AM. Comparison of two methods to measure macular pigment optical density in healthy subjects. Invest Ophthalmol Vis Sci. 2014 May 2;55(5):2941–6. doi: 10.1167/iovs.13-13568. [DOI] [PubMed] [Google Scholar]
- 23.Degli Esposti S, Egan C, Bunce C, Moreland JD, Bird AC, Robson AG. Macular pigment parameters in patients with macular telangiectasia (MacTel) and normal subjects: implications of a novel analysis. Invest Ophthalmol Vis Sci. 2012;53:6568–6575. doi: 10.1167/iovs.12-9756. [DOI] [PubMed] [Google Scholar]
- 24.Dietzel M, Zeimer M, Heimes B, Pauleikhoff D, Hense HW. The ringlike structure of macular pigment in age-related maculopathy: results from the Muenster Aging and Retina Study (MARS) Invest Ophthalmol Vis Sci. 2011 Oct 11;52(11):8016–24. doi: 10.1167/iovs.11-7610. [DOI] [PubMed] [Google Scholar]
- 25.CharbelIssa P, van der Veen RL, Stijfs A, Holz FG, Scholl HP, Berendschot TT. Quantification of reduced macular pigment optical density in the central retina in macular telangiectasia type 2. Exp Eye Res. 2009 Jun 15;89(1):25–31. doi: 10.1016/j.exer.2009.02.006. [DOI] [PubMed] [Google Scholar]
- 26.Zeimer MB1, Krömer I, Spital G, Lommatzsch A, Pauleikhoff D. Macular telangiectasia: patterns of distribution of macular pigment and response to supplementation. Retina. 2010 Sep;30(8):1282–93. doi: 10.1097/IAE.0b013e3181e096dd. [DOI] [PubMed] [Google Scholar]